Click here for the BAT GCN circular template
Image
Pre-slew 15.0-350.0 keV image (Event data)
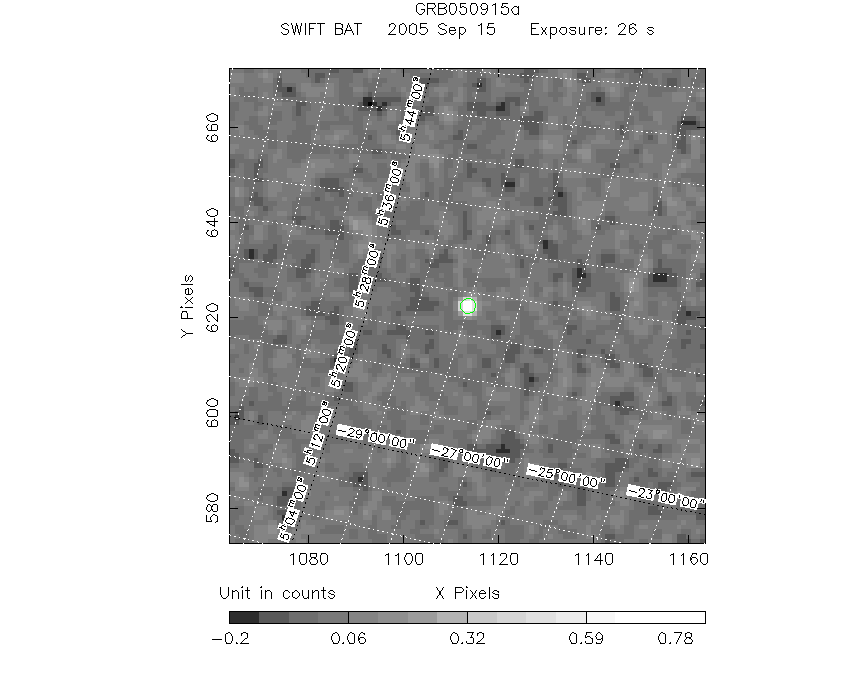
#   RAcent    DECcent   POSerr    Theta     Phi              Peak Cts       SNR   Name
   81.6892   -28.0116   0.0105    30.0854  -148.0589         0.9777866     18.307 TRIG_00155242

Foreground time interval of the image:
 -8.140  18.253 (delta_t =  26.393 [sec])
Background time interval of the image:
-291.747  -8.140 (delta_t = 283.607 [sec])
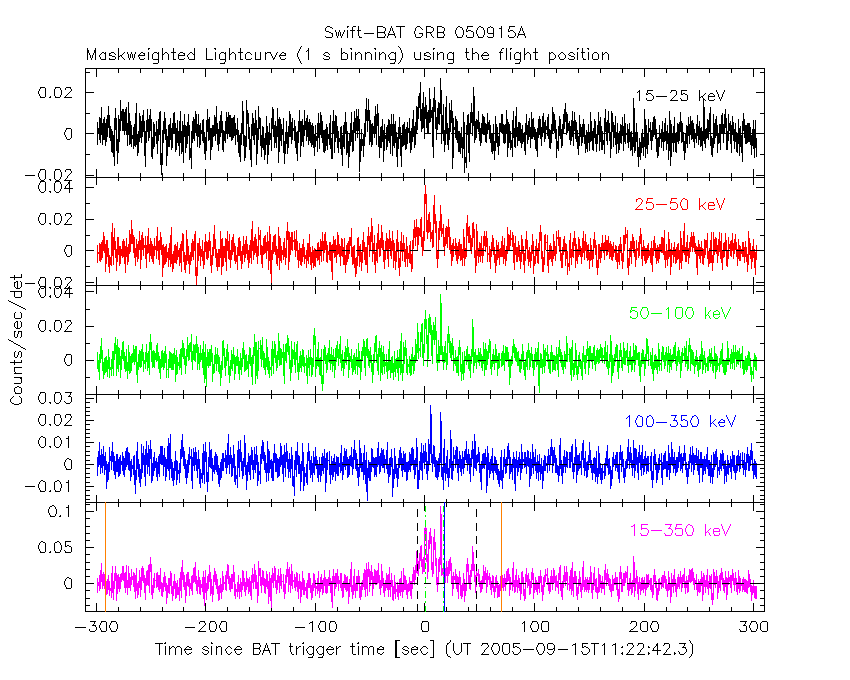
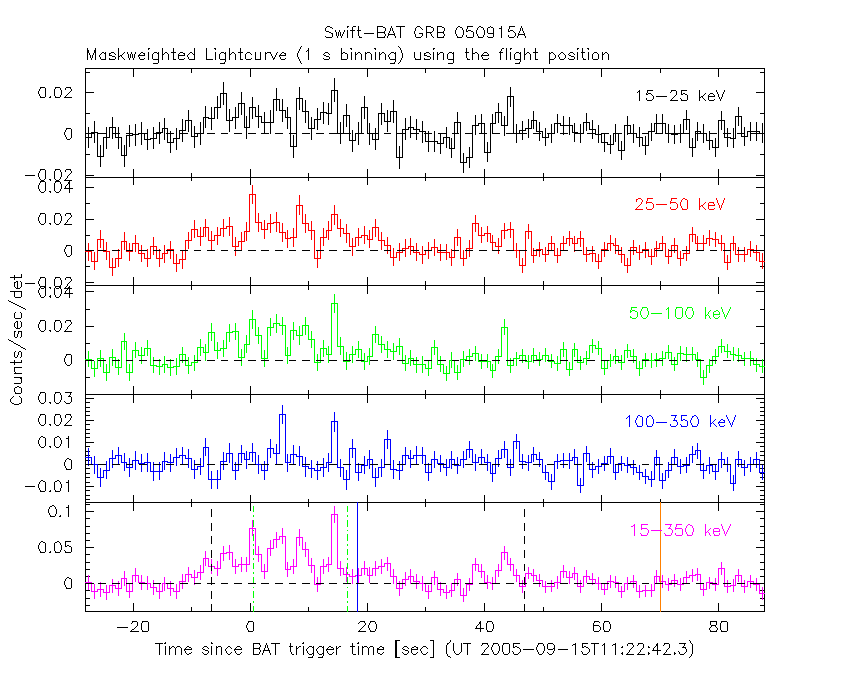
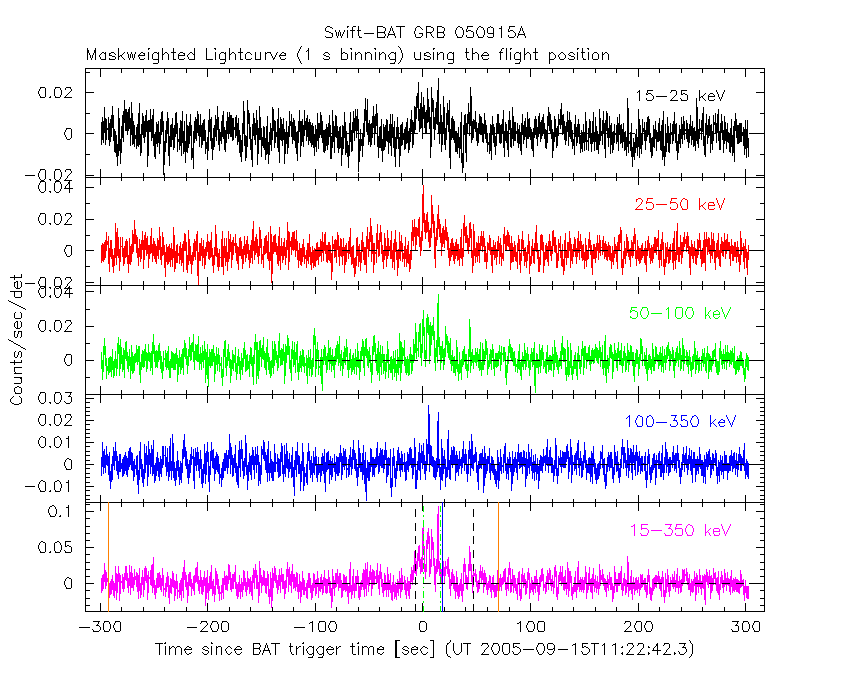
Lightcurves
Notes:
- 1) The mask-weighted light curves are using the flight position.
- 2) Multiple plots of different time binning/intervals are shown to cover all scenarios of short/long GRBs, rate/image triggers, and real/false positives.
- 3) For all the mask-weighted lightcurves, the y-axis units are counts/sec/det where a det is 0.4 x 0.4 = 0.16 sq cm.
- 4) The verticle lines correspond to following: green dotted lines are T50 interval, black dotted lines are T90 interval, blue solid line(s) is a spacecraft slew start time, and orange solid line(s) is a spacecraft slew end time.
- 5) Time of each bin is in the middle of the bin.
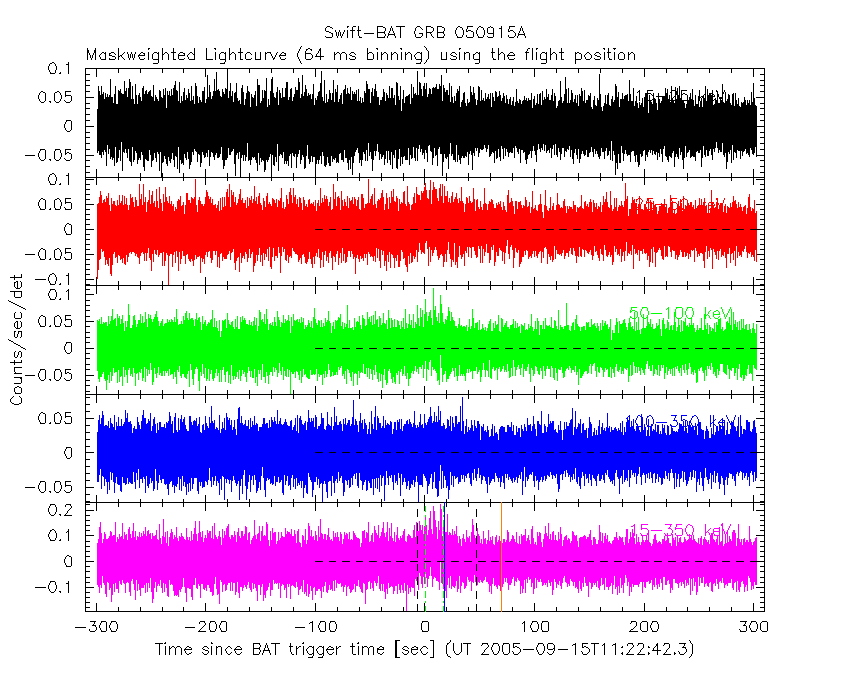
1 s binning
From T0-310 s to T0+310 s
From T100_start - 20 s to T100_end + 30 s
Full time interval
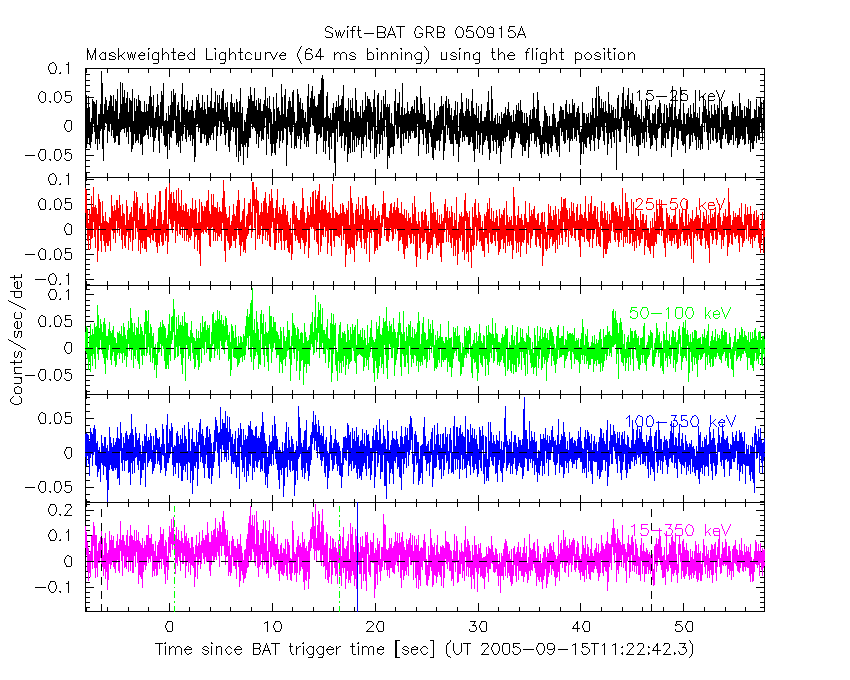
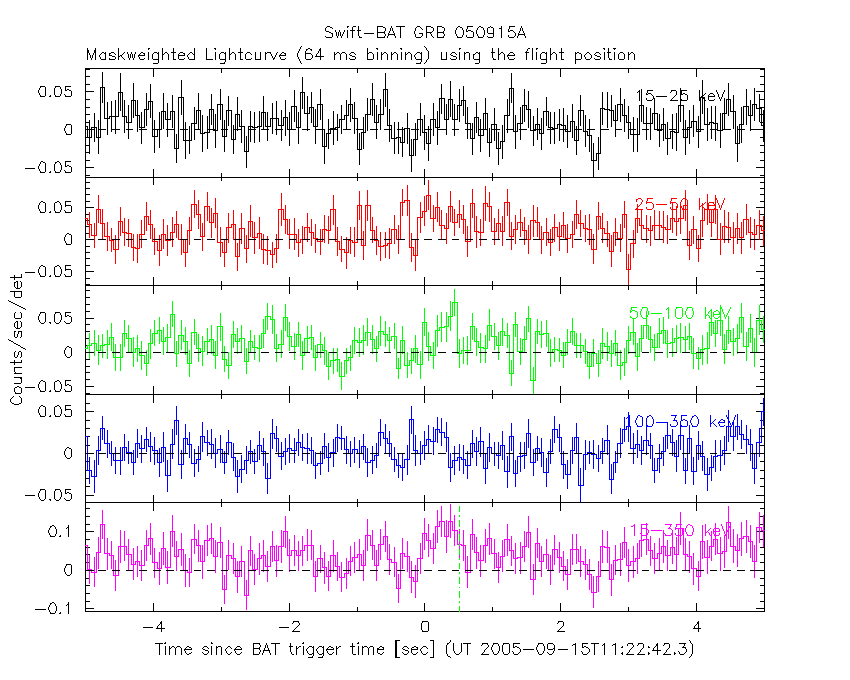
64 ms binning
Full time interval
From T100_start to T100_end
From T0-5 sec to T0+5 sec
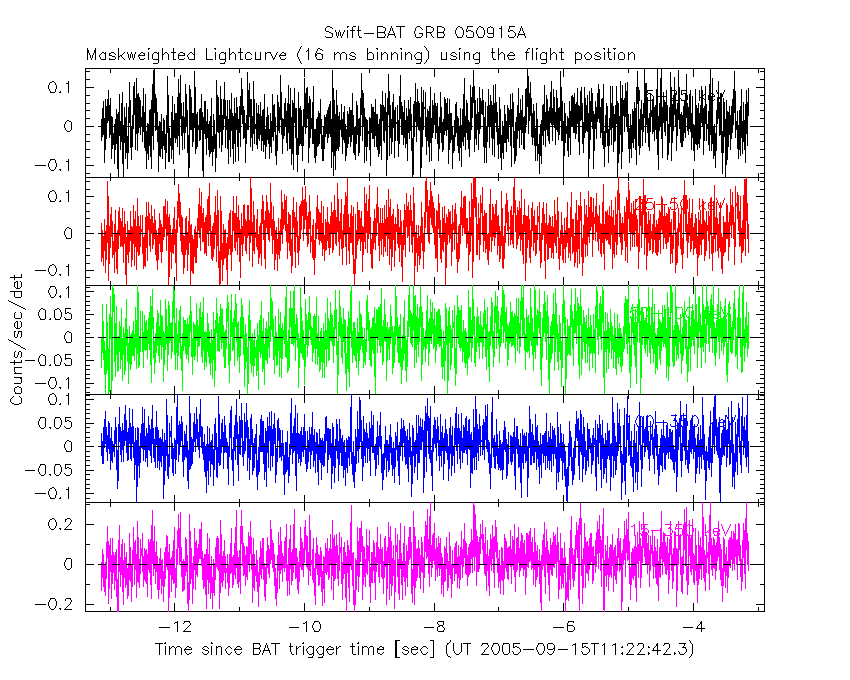
16 ms binning
From T100_start-5 s to T100_start+5 s
Blue+Cyan dotted lines: Time interval of the scaled map
From 0.000000 to 1.024000
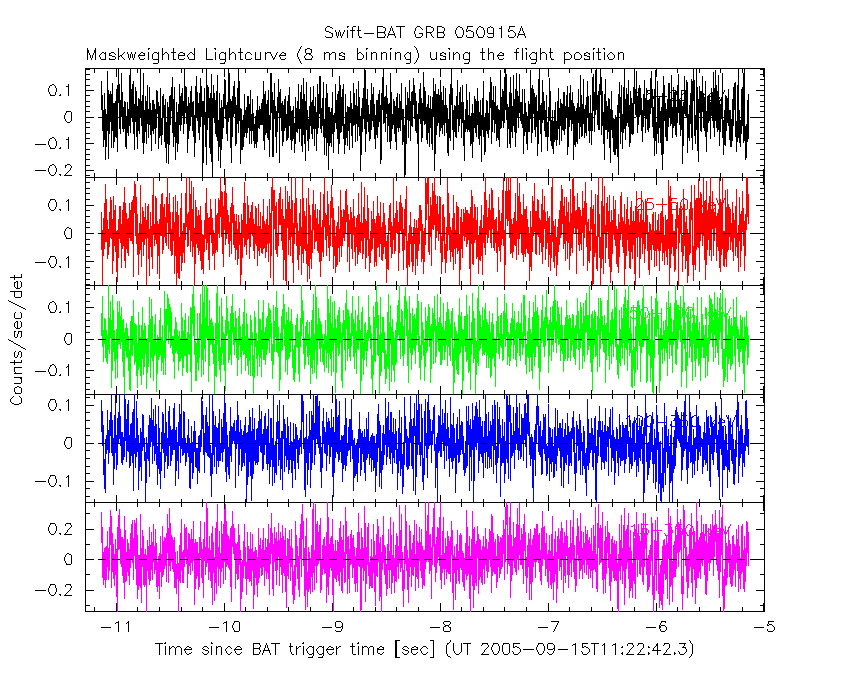
8 ms binning
From T100_start-3 s to T100_start+3 s
Blue+Cyan dotted lines: Time interval of the scaled map
From 0.000000 to 1.024000
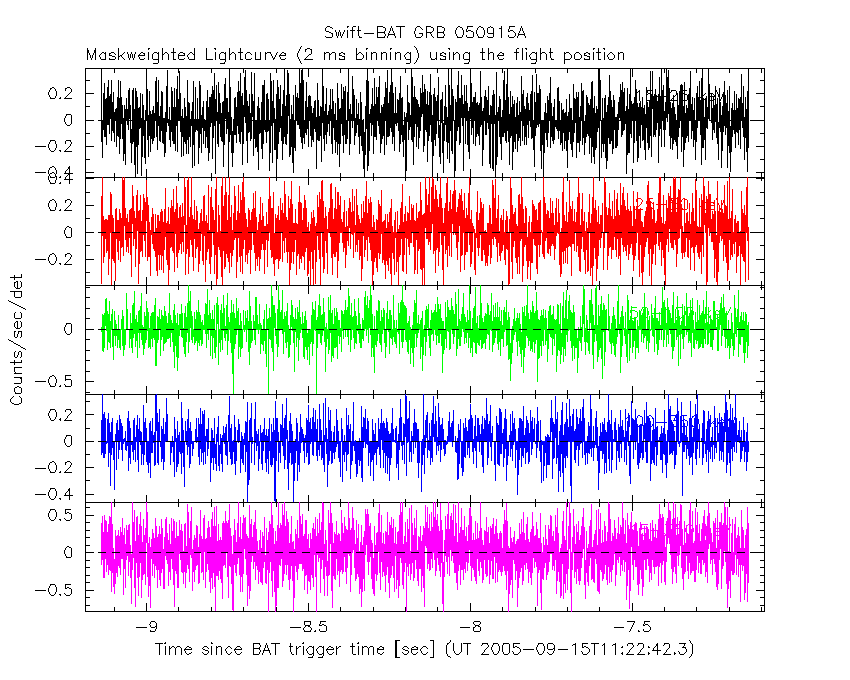
2 ms binning
From T100_start-1 s to T100_start+1 s
Blue+Cyan dotted lines: Time interval of the scaled map
From 0.000000 to 1.024000
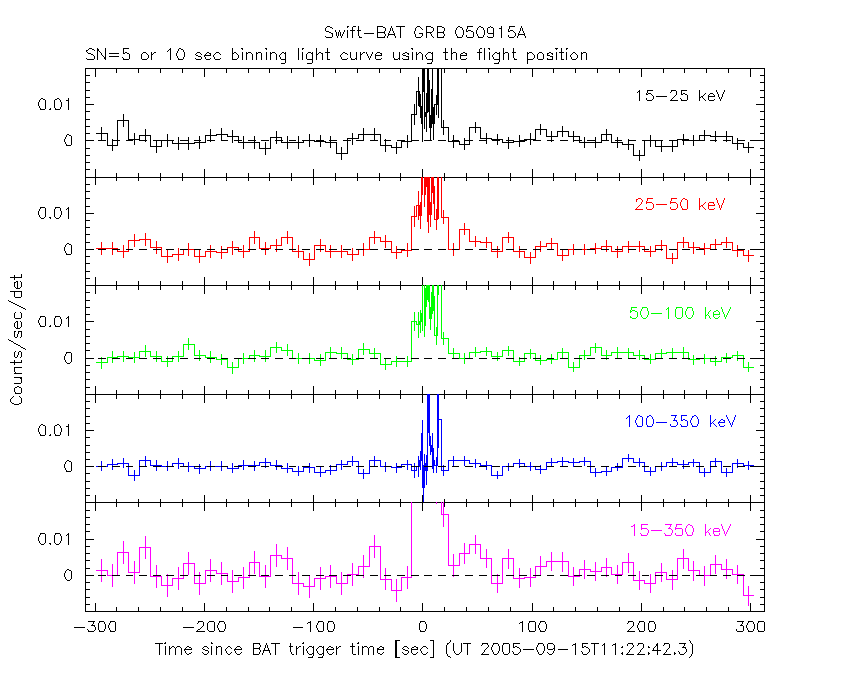
SN=5 or 10 sec. binning (whichever binning is satisfied first)
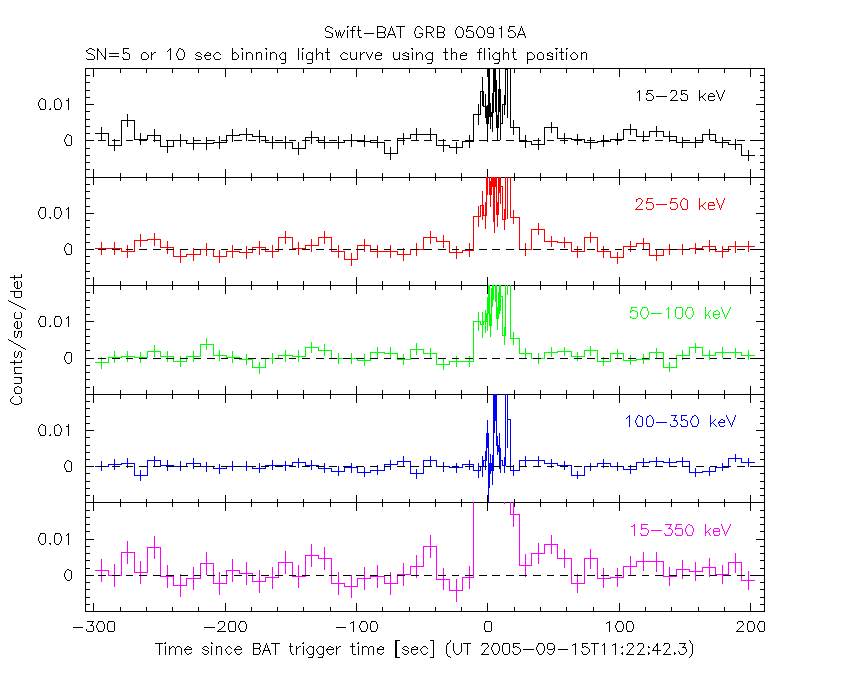
SN=5 or 10 sec. binning (T < 200 sec)
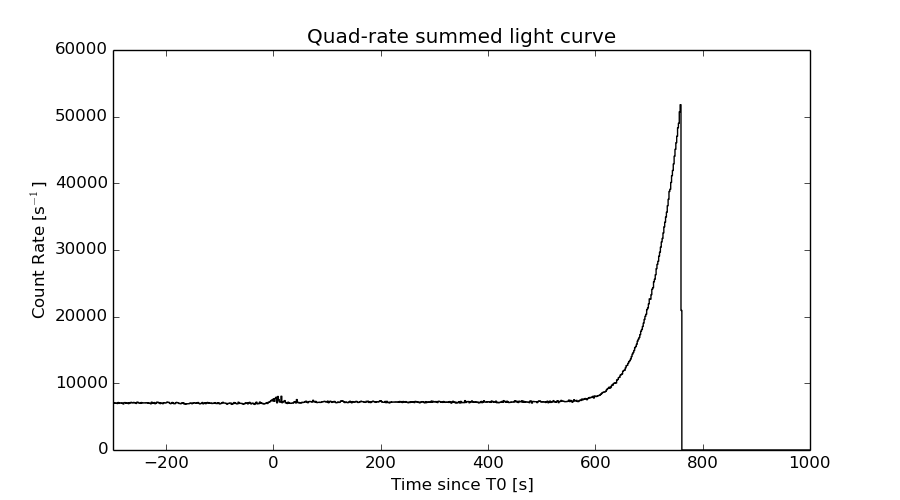
Quad-rate summed light curves (from T0-300s to T0+1000s)
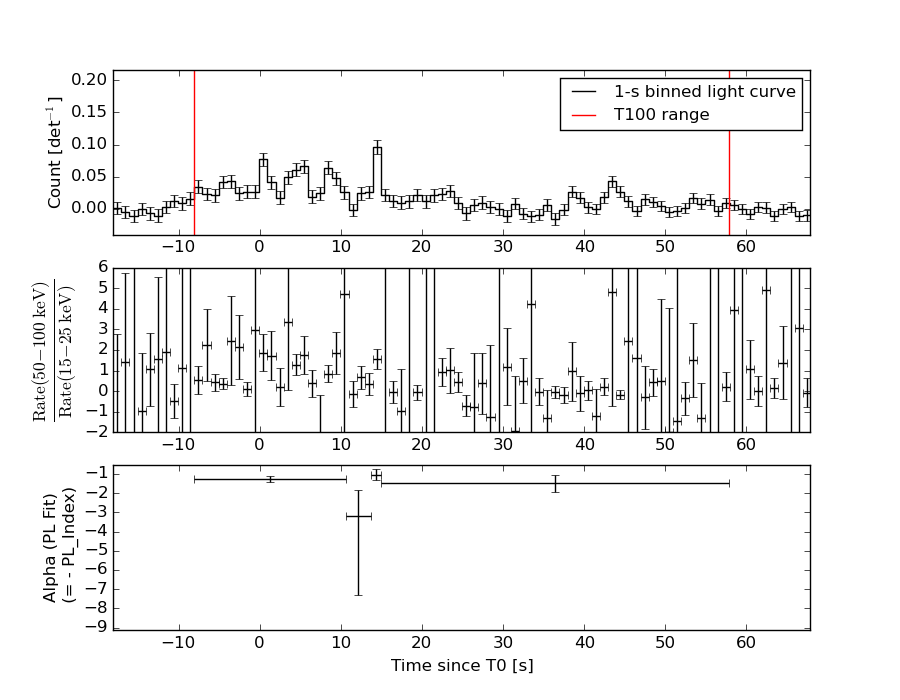
Spectral Evolution
Spectra
Notes:
- 1) The fitting includes the systematic errors.
- 2) When the burst includes telescope slew time periods, the fitting uses an average response file made from multiple 5-s response files through out the slew time plus single time preiod for the non-slew times, and weighted by the total counts in the corresponding time period using addrmf. An average response file is needed becuase a spectral fit using the pre-slew DRM will introduce some errors in both a spectral shape and a normalization if the PHA file contains a lot of the slew/post-slew time interval.
- 3) For fits to more complicated models (e.g. a power-law over a cutoff power-law), the BAT team has decided to require a chi-square improvement of more than 6 for each extra dof.
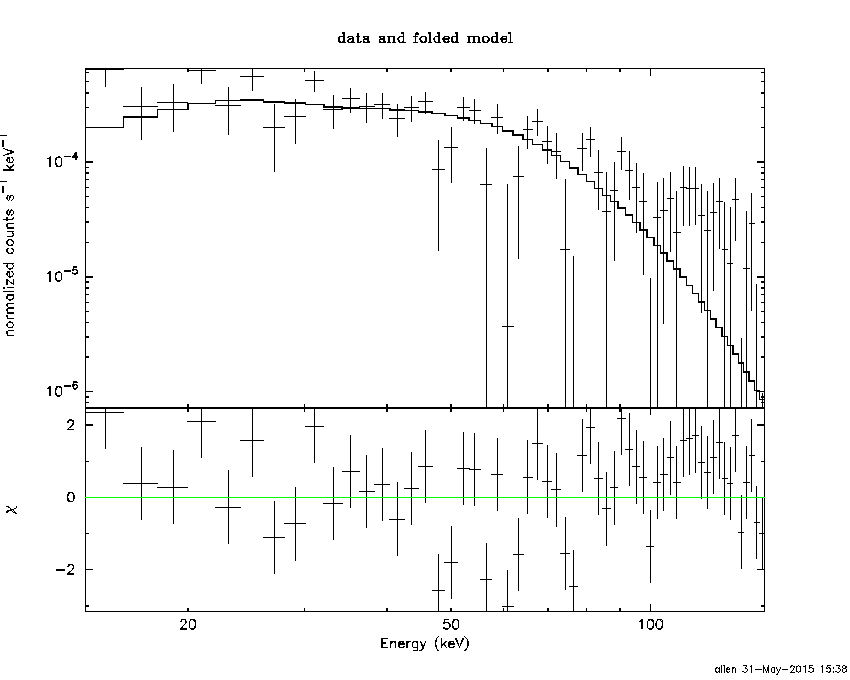
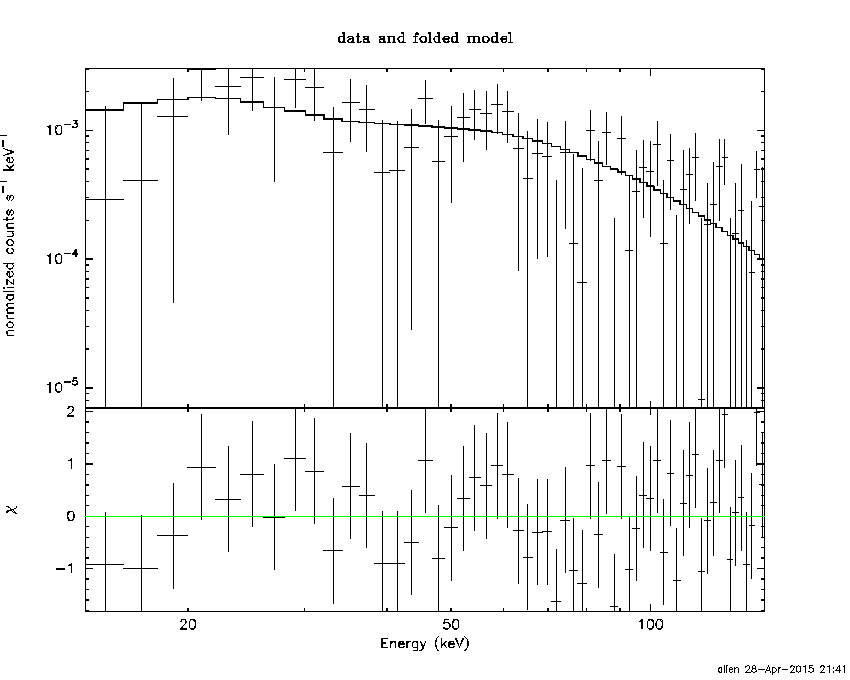
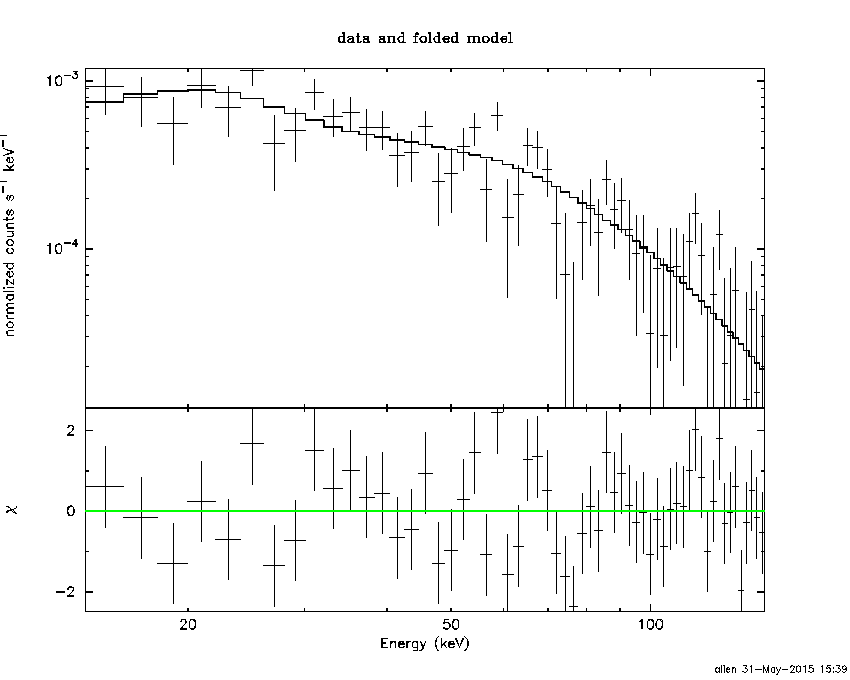
Time averaged spectrum fit using the average DRM
Power-law model
Time interval is from   -8.140 sec. to   57.836 sec.

Spectral model in power-law:
------------------------------------------------------------
Parameters  : value       lower 90%   higher 90%
Photon index: 1.37244     ( -0.166356   0.165657 )
Norm@50keV  : 1.30372E-03    ( -0.000125014   0.000124694 )
------------------------------------------------------------
#Fit statistic : Chi-Squared =          78.35 using 59 PHA bins.
# Reduced chi-squared =          1.375 for     57 degrees of freedom
# Null hypothesis probability =   3.187419e-02

Photon flux (15-150 keV)    in 65.98 sec: 0.157803 ( -0.0154584  0.0154905 ) ph/cm2/s
Energy fluence (15-150 keV)             : 8.36e-07 ( -8.82159e-08  8.89206e-08 ) ergs/cm2
Cutoff power-law model
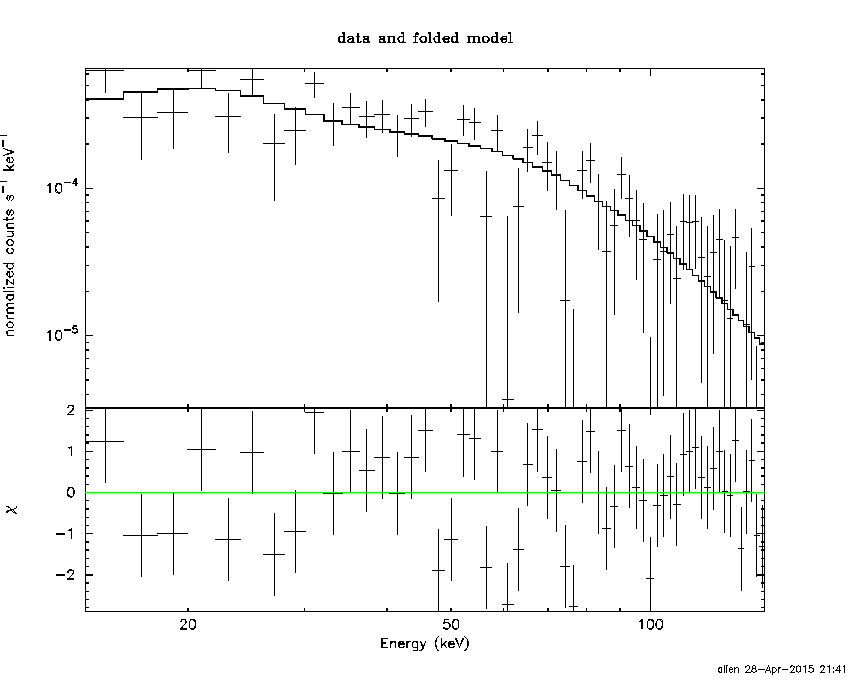
Time interval is from   -8.140 sec. to   57.836 sec.
Spectral model in the cutoff power-law:
------------------------------------------------------------
Parameters  : value       lower 90%   higher 90%
Photon index: 1.00193     ( -0.753787   0.45333 )
Epeak [keV] : 137.149      ( -66.021 -137.161 )
Norm@50keV  : 1.99566E-03    ( -0.000741462   0.00266644 )
------------------------------------------------------------
#Fit statistic : Chi-Squared =          77.41 using 59 PHA bins.
# Reduced chi-squared =          1.382 for     56 degrees of freedom
# Null hypothesis probability =   3.057843e-02

Photon flux (15-150 keV)    in 65.98 sec: 0.155247 ( -0.016129  0.016107 ) ph/cm2/s
Energy fluence (15-150 keV)             : 8.12992e-07 ( -9.94253e-08  9.79803e-08 ) ergs/cm2
Band function

Time interval is from   -8.140 sec. to   57.836 sec.

Spectral model in the Band function:
------------------------------------------------------------
Parameters  : value       lower 90%   higher 90%
alpha       : 4.41671E-02   ( 0.125313   5.05917 )
beta        : -1.61193    ( 1.60399   0.294901 )
Epeak [keV] : 55.9048      ( -55.3879 219.511 )
Norm@50keV   : 8.72405E-03    ( -0.00933059   27.9402 )
------------------------------------------------------------
#Fit statistic : Chi-Squared =          75.95 using 59 PHA bins.
# Reduced chi-squared =          1.381 for     55 degrees of freedom
# Null hypothesis probability =   3.214450e-02

Photon flux (15-150 keV)    in 65.98 sec:  (    ) ph/cm2/s
Energy fluence (15-150 keV)             : 0 ( 0  0 ) ergs/cm2
Single BB
Spectral model blackbody:
------------------------------------------------------------
Parameters  : value    Lower 90%  Upper 90%
kT [keV]    : 15.6361  (-1.85037  2.20378)
R^2/D10^2   : 1.58619E-02  (-0.00582445   0.0087768)
(R is the radius in km and D10 is the distance to the source in units of 10 kpc)
------------------------------------------------------------
#Fit statistic : Chi-Squared =          96.97 using 59 PHA bins.
# Reduced chi-squared =          1.701 for     57 degrees of freedom
# Null hypothesis probability =   7.592066e-04

Energy  Fluence     90% Error
[keV]   [erg/cm2]   [erg/cm2]
15- 25  5.316e-08   1.041e-08
25- 50  2.193e-07   3.454e-08
50-150  3.714e-07   7.489e-08
15-150  6.438e-07   8.986e-08
Thermal bremsstrahlung (OTTB)
Spectral model: thermal bremsstrahlung
------------------------------------------------------------
Parameters  : value         Lower 90%    Upper 90%
kT [keV]    : 200.000       (      )
Norm        : 0.654138       (-0.0624096     0.0624062)
------------------------------------------------------------
#Fit statistic : Chi-Squared =          80.64 using 59 PHA bins.
# Reduced chi-squared =          1.415 for     57 degrees of freedom
# Null hypothesis probability =   2.135146e-02

Energy  Fluence     90% Error
[keV]   [erg/cm2]   [erg/cm2]
15- 25  1.075e-07   5.714e-08
25- 50  2.067e-07   6.446e-08
50-150  4.534e-07   2.162e-07
15-150  7.676e-07   4.072e-07
Double BB
Spectral model: bbodyrad<1> + bbodyrad<2>
------------------------------------------------------------
Parameters  : value         Lower 90%    Upper 90%
kT1 [keV]   : 9.88211        (-2.35421      2.41107)
R1^2/D10^2  : 5.64343E-02        (-0.0271146      0.0459377)
kT2 [keV]   : 43.2352        (-17.6826      -43.4283)
R2^2/D10^2  : 3.91951E-04    (-0.00033092   0.00177802)
------------------------------------------------------------
#Fit statistic : Chi-Squared =          75.17 using 59 PHA bins.
# Reduced chi-squared =          1.367 for     55 degrees of freedom
# Null hypothesis probability =   3.669877e-02

Energy  Fluence     90% Error
[keV]   [erg/cm2]   [erg/cm2]
15- 25  7.964e-08   2.728e-08
25- 50  2.214e-07   7.848e-08
50-150  5.216e-07   2.719e-07
15-150  8.226e-07   3.537e-07
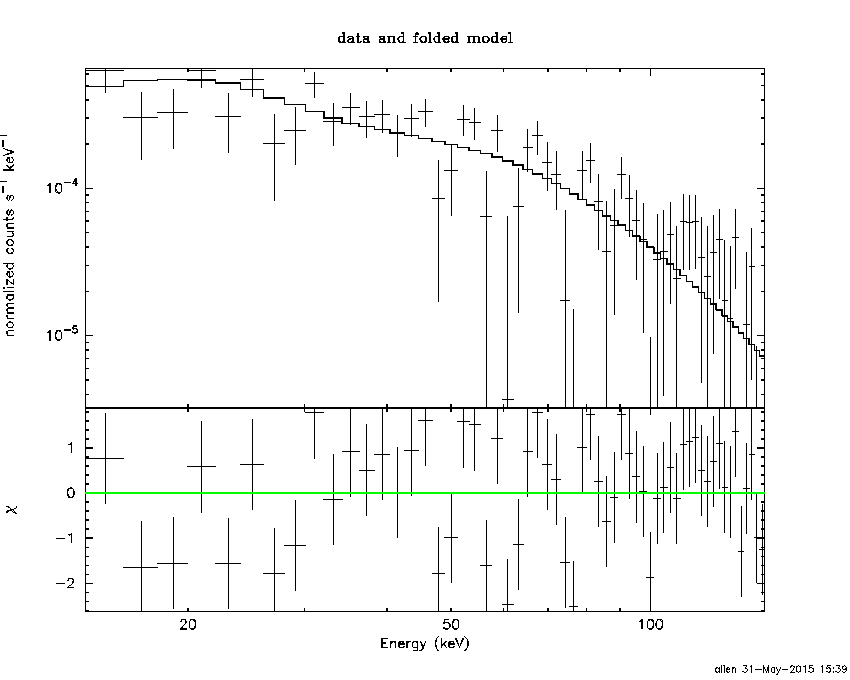
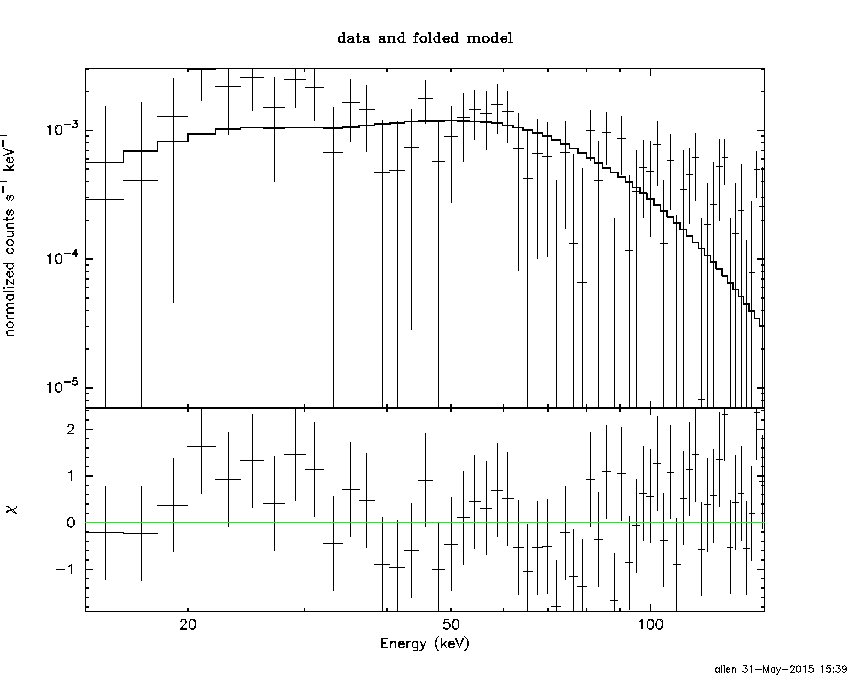
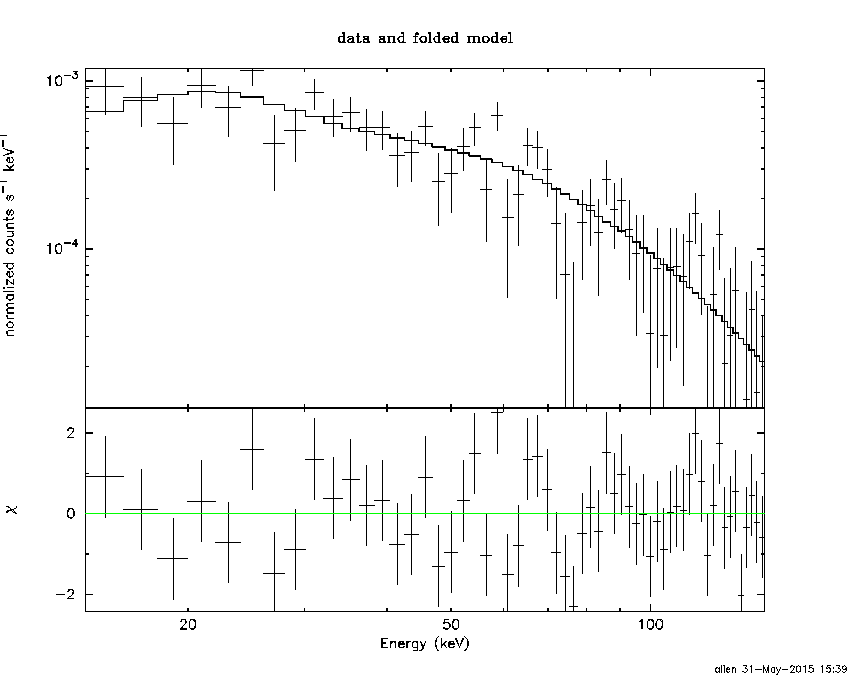
Peak spectrum fit
Power-law model
Time interval is from   13.688 sec. to   14.688 sec.

Spectral model in power-law:
------------------------------------------------------------
Parameters  : value       lower 90%   higher 90%
Photon index: 0.949027     ( -0.333621   0.304084 )
Norm@50keV  : 6.65404E-03    ( -0.00121003   0.00118426 )
------------------------------------------------------------
#Fit statistic : Chi-Squared =          44.30 using 59 PHA bins.
# Reduced chi-squared =         0.7773 for     57 degrees of freedom
# Null hypothesis probability =   8.901264e-01

Photon flux (15-150 keV)    in 1 sec: 0.764436 ( -0.139101  0.140138 ) ph/cm2/s
Energy fluence (15-150 keV)             : 7.33003e-08 ( -1.31696e-08  1.32482e-08 ) ergs/cm2
Cutoff power-law model
Time interval is from   13.688 sec. to   14.688 sec.
Spectral model in the cutoff power-law:
------------------------------------------------------------
Parameters  : value       lower 90%   higher 90%
Photon index: 0.950725     ( -0.564492   0.299304 )
Epeak [keV] : 9999.36      ( -9999.36 -9999.36 )
Norm@50keV  : 6.70518E-03    ( -0.00122098   0.00939687 )
------------------------------------------------------------
#Fit statistic : Chi-Squared =          44.32 using 59 PHA bins.
# Reduced chi-squared =         0.7914 for     56 degrees of freedom
# Null hypothesis probability =   8.702258e-01

Photon flux (15-150 keV)    in 1 sec: 0.766872 ( -0.141757  0.136122 ) ph/cm2/s
Energy fluence (15-150 keV)             : 7.32603e-08 ( -1.31197e-08  1.3295e-08 ) ergs/cm2
Band function

Time interval is from   13.688 sec. to   14.688 sec.

Spectral model in the Band function:
------------------------------------------------------------
Parameters  : value       lower 90%   higher 90%
alpha       : 5.00000   ( -5   -5 )
beta        : -1.08543    ( -0.387406   0.380867 )
Epeak [keV] : 31.1251      ( -31.1248 49.6512 )
Norm@50keV   : 129.521    ( -21.8679   1.302e+06 )
------------------------------------------------------------
#Fit statistic : Chi-Squared =          42.89 using 59 PHA bins.
# Reduced chi-squared =         0.7798 for     55 degrees of freedom
# Null hypothesis probability =   8.824494e-01

Photon flux (15-150 keV)    in 1 sec:  (    ) ph/cm2/s
Energy fluence (15-150 keV)             : 0 ( 0  0 ) ergs/cm2
Single BB
Spectral model blackbody:
------------------------------------------------------------
Parameters  : value    Lower 90%  Upper 90%
kT [keV]    : 23.3518  (-5.8398  9.52661)
R^2/D10^2   : 2.23234E-02  (-0.0142852   0.0335245)
(R is the radius in km and D10 is the distance to the source in units of 10 kpc)
------------------------------------------------------------
#Fit statistic : Chi-Squared =          54.06 using 59 PHA bins.
# Reduced chi-squared =         0.9485 for     57 degrees of freedom
# Null hypothesis probability =   5.860048e-01

Energy  Fluence     90% Error
[keV]   [erg/cm2]   [erg/cm2]
15- 25  2.190e-09   8.230e-10
25- 50  1.198e-08   4.020e-09
50-150  4.877e-08   1.836e-08
15-150  6.294e-08   2.070e-08
Thermal bremsstrahlung (OTTB)
Spectral model: thermal bremsstrahlung
------------------------------------------------------------
Parameters  : value         Lower 90%    Upper 90%
kT [keV]    : 200.000       (      )
Norm        : 3.18497       (-0.5767     0.576617)
------------------------------------------------------------
#Fit statistic : Chi-Squared =          55.22 using 59 PHA bins.
# Reduced chi-squared =         0.9687 for     57 degrees of freedom
# Null hypothesis probability =   5.422627e-01

Energy  Fluence     90% Error
[keV]   [erg/cm2]   [erg/cm2]
15- 25  7.930e-09   4.657e-09
25- 50  1.526e-08   8.740e-09
50-150  3.346e-08   1.929e-08
15-150  5.664e-08   3.253e-08
Double BB

R1^2/D10^2  : 0.164981        (      )
kT2 [keV]   : 200.000        (      )
R2^2/D10^2  : 1.62284E-04    (-4.88765e-05   0.000684278)
------------------------------------------------------------
#Fit statistic : Chi-Squared =          41.53 using 59 PHA bins.
#Fit statistic : Chi-Squared =          41.31 using 59 PHA bins.
#Fit statistic : Chi-Squared =          41.29 using 59 PHA bins.
# Reduced chi-squared =         0.7552 for     55 degrees of freedom
# Reduced chi-squared =         0.7511 for     55 degrees of freedom
# Reduced chi-squared =         0.7508 for     55 degrees of freedom
# Null hypothesis probability =   9.101638e-01
# Null hypothesis probability =   9.143144e-01
# Null hypothesis probability =   9.145663e-01

Energy  Fluence     90% Error
[keV]   [erg/cm2]   [erg/cm2]
15- 25  4.928e-09   2.877e-09
25- 50  1.513e-08   8.800e-09
50-150  5.458e-08   5.085e-08
15-150  7.464e-08   5.505e-08
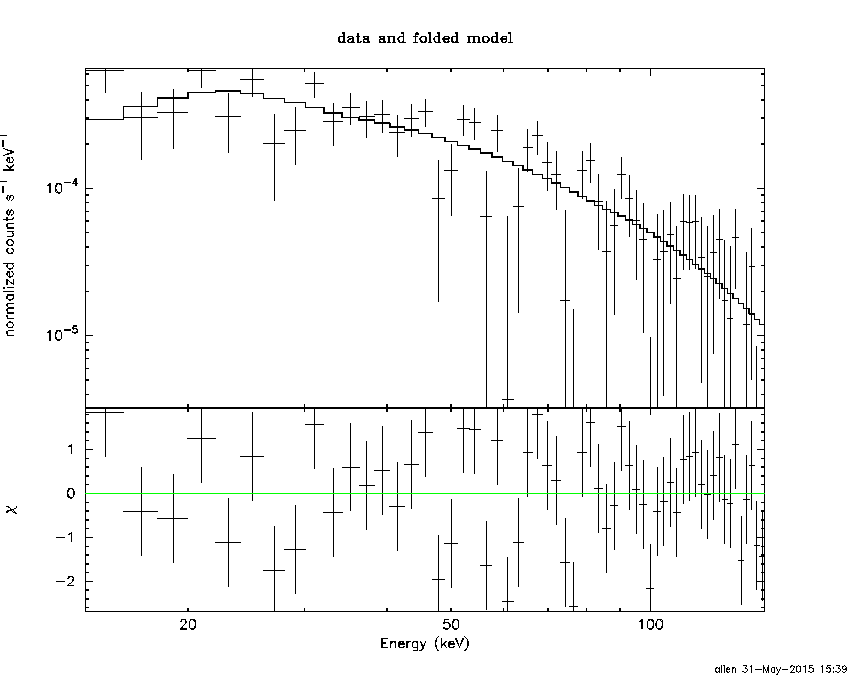
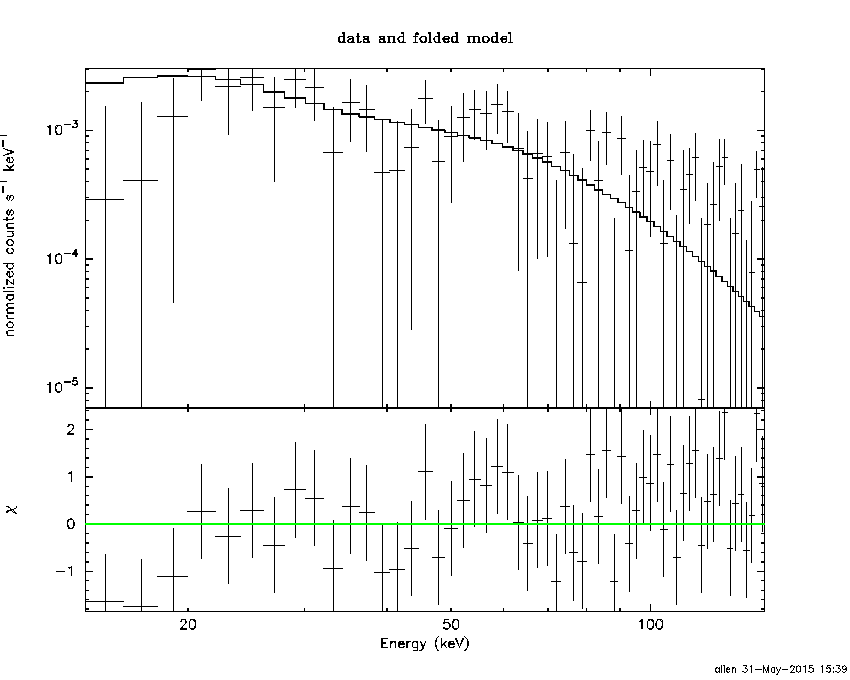
Pre-slew spectrum (Pre-slew PHA with pre-slew DRM)
Power-law model
Spectral model in power-law:
------------------------------------------------------------
Parameters  : value       lower 90%   higher 90%
Photon index: 1.34607     ( -0.151718   0.150769 )
Norm@50keV  : 2.48077E-03    ( -0.000214799   0.000214555 )
------------------------------------------------------------
#Fit statistic : Chi-Squared =          62.98 using 59 PHA bins.
# Reduced chi-squared =          1.105 for     57 degrees of freedom
# Null hypothesis probability =   2.730548e-01

Photon flux (15-150 keV)    in 26.39 sec: 0.298620 ( -0.0266681  0.0267207 ) ph/cm2/s
Energy fluence (15-150 keV)             : 6.39973e-07 ( -6.09226e-08  6.13169e-08 ) ergs/cm2
Cutoff power-law model
Spectral model in the cutoff power-law:
------------------------------------------------------------
Parameters  : value       lower 90%   higher 90%
Photon index: 1.07514     ( -0.648826   0.349659 )
Epeak [keV] : 177.661      ( -177.662 -177.662 )
Norm@50keV  : 3.36880E-03    ( -0.0010651   0.00349164 )
------------------------------------------------------------
#Fit statistic : Chi-Squared =          62.34 using 59 PHA bins.
# Reduced chi-squared =          1.113 for     56 degrees of freedom
# Null hypothesis probability =   2.608781e-01

Photon flux (15-150 keV)    in 26.39 sec: 0.295066 ( -0.02774  0.027715 ) ph/cm2/s
Energy fluence (15-150 keV)             : 6.28298e-07 ( -6.70649e-08  6.63128e-08 ) ergs/cm2
Band function
Spectral model in the Band function:
------------------------------------------------------------
Parameters  : value       lower 90%   higher 90%
alpha       : -0.251115   ( 0.528966   0.528966 )
beta        : -1.48118    ( 1.47768   0.24108 )
Epeak [keV] : 58.2016      ( -56.9248 236.966 )
Norm@50keV   : 1.13703E-02    ( -0.0125638   62.5963 )
------------------------------------------------------------
#Fit statistic : Chi-Squared =          61.61 using 59 PHA bins.
# Reduced chi-squared =          1.120 for     55 degrees of freedom
# Null hypothesis probability =   2.514419e-01

Photon flux (15-150 keV)    in 26.39 sec:  (    ) ph/cm2/s
Energy fluence (15-150 keV)             : 0 ( 0  0 ) ergs/cm2
S(25-50 keV) vs. S(50-100 keV) plot
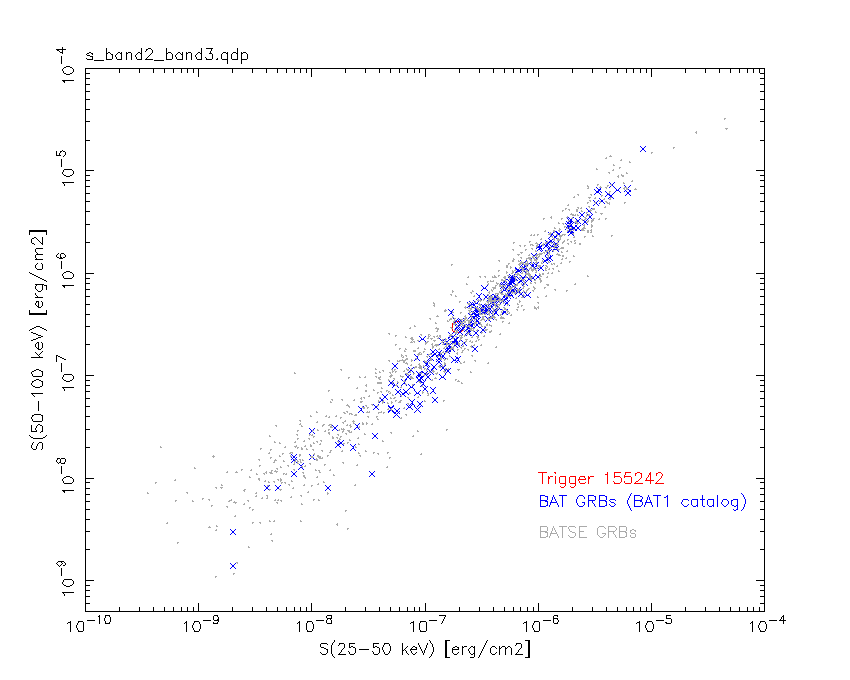
S(25-50 keV)  = 1.94e-07
S(50-100 keV) = 2.99e-07
T90 vs. Hardness ratio plot
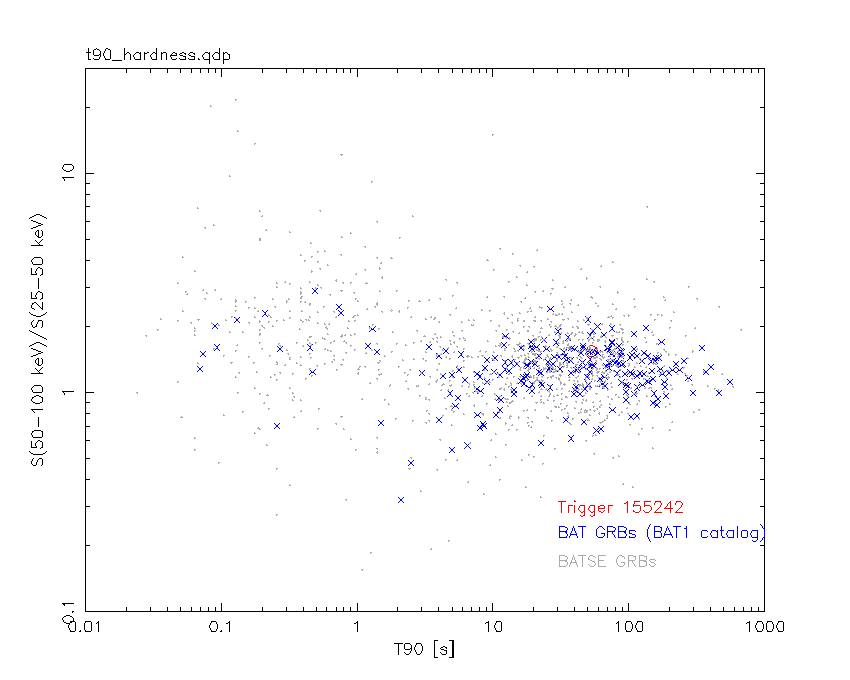
T90                                   = 53.419999986887 sec.
Hardness ratio (energy fluence ratio) = 1.54124
Color vs. Color plot
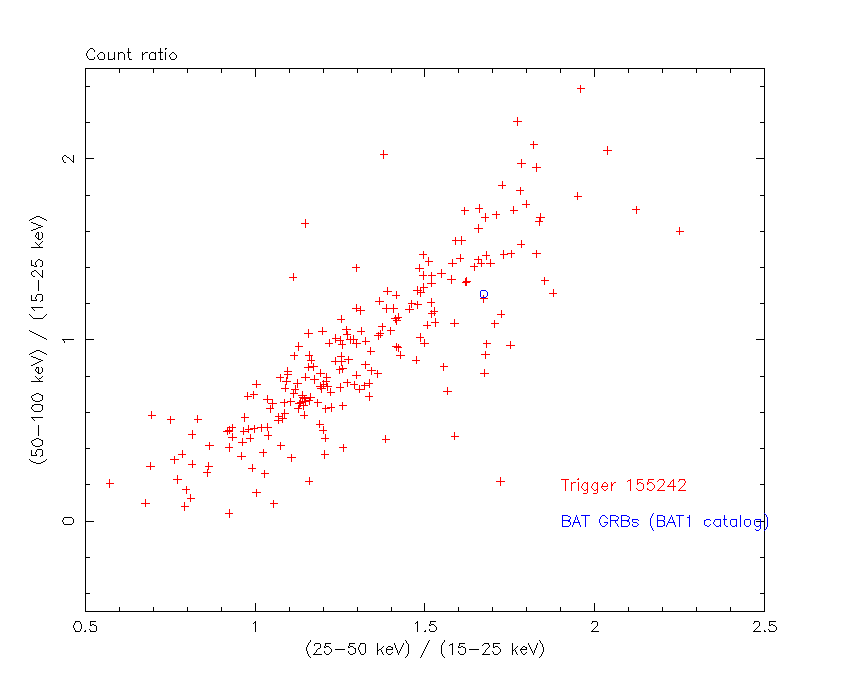
Count Ratio  (25-50 keV) / (15-25 keV) = 1.67285
Count Ratio (50-100 keV) / (15-25 keV) = 1.2541
Mask shadow pattern
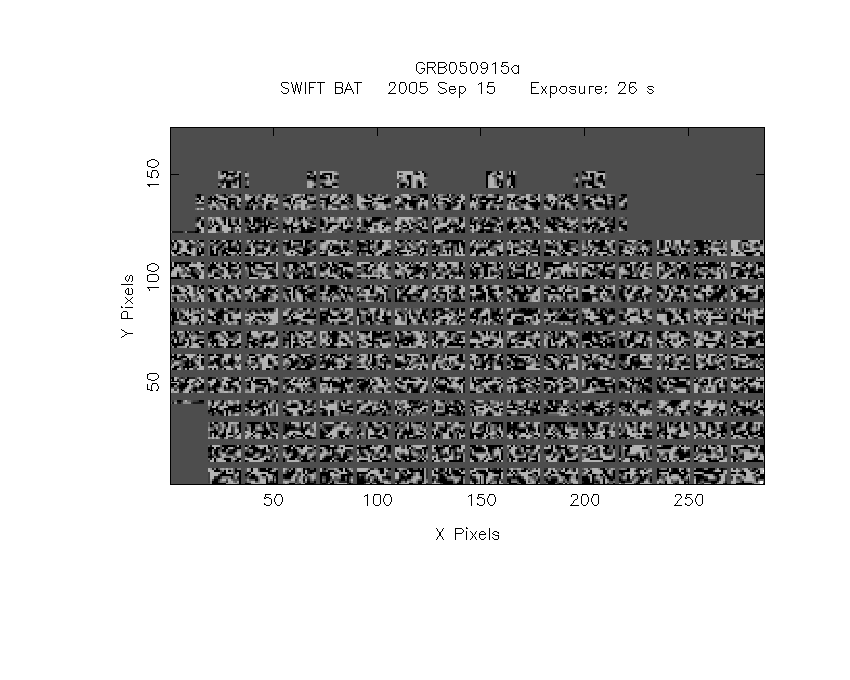
IMX = -4.916238833133412E-01, IMY = 3.064985312080724E-01
TIME vs. PHA plot around the trigger time
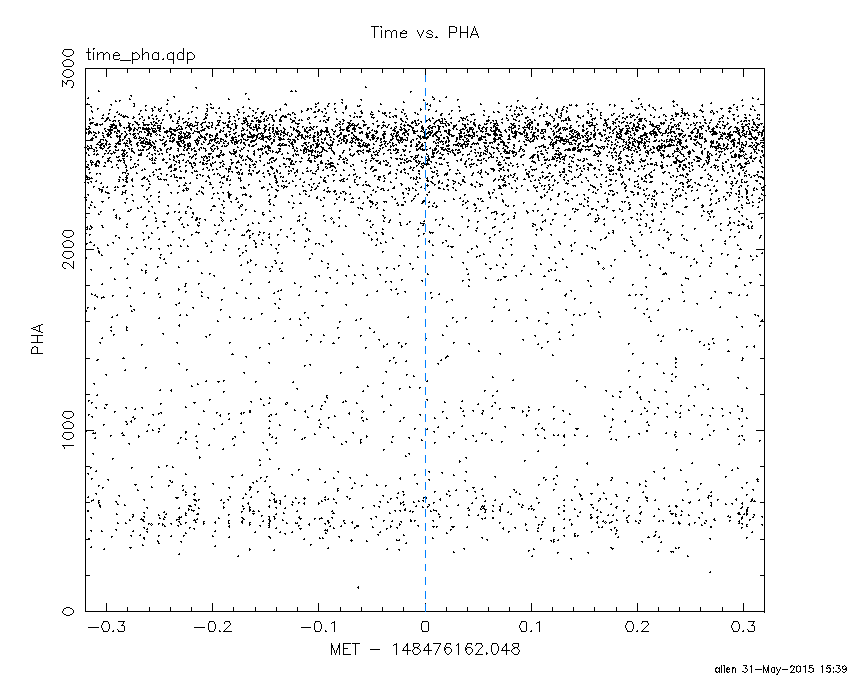
Blue+Cyan dotted lines: Time interval of the scaled map
From 0.000000 to 1.024000
TIME vs. DetID plot around the trigger time
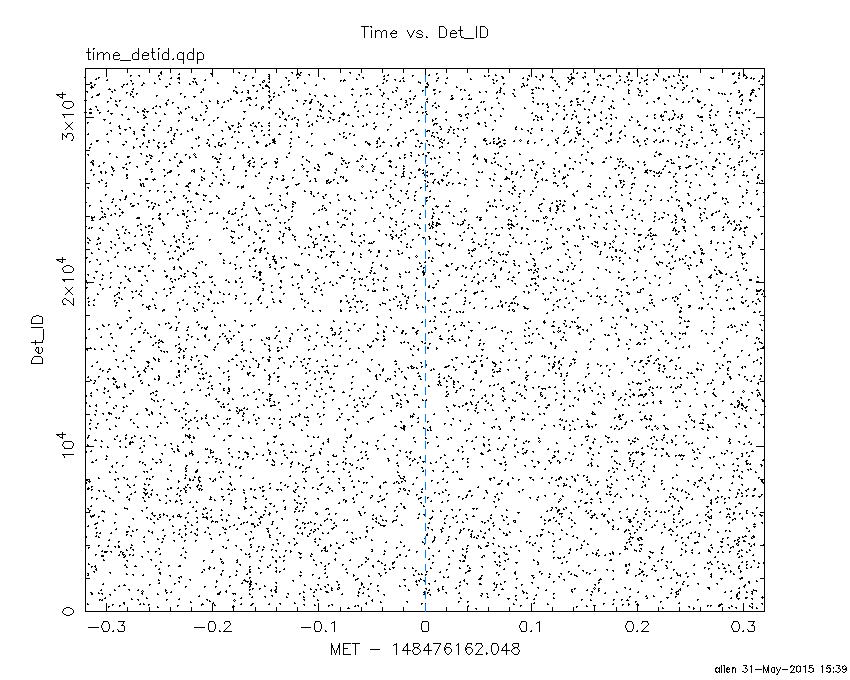
Blue+Cyan dotted lines: Time interval of the scaled map
From 0.000000 to 1.024000
100 us light curve (15-350 keV)
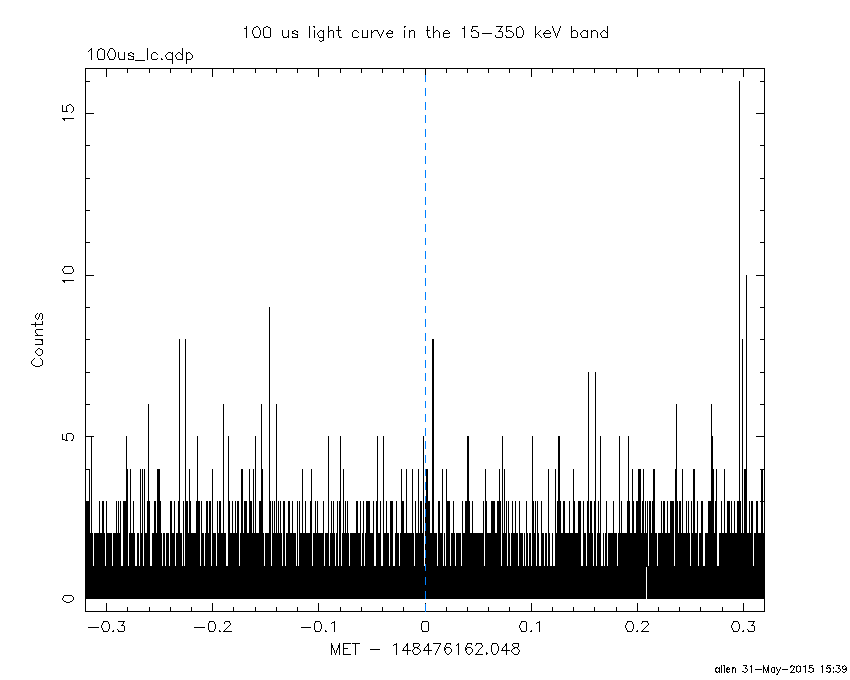
Blue+Cyan dotted lines: Time interval of the scaled map
From 0.000000 to 1.024000
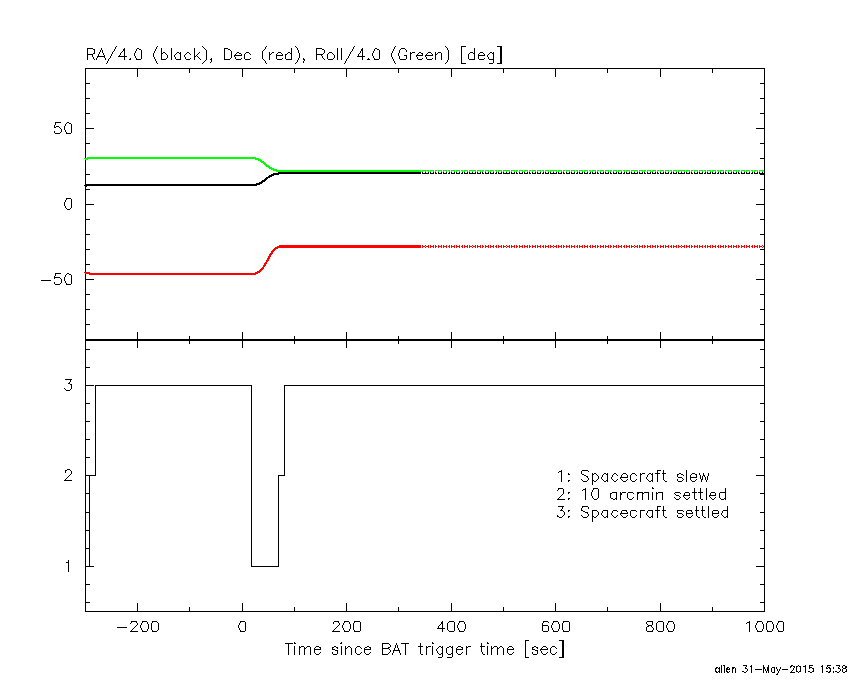
Spacecraft aspect plot
Bright source in the pre-burst/pre-slew/post-slew images
Pre-burst image of 15-350 keV band
Time interval of the image:
-291.747410 -8.140000

# RAcent  DECcent POSerr Theta    Phi  PeakCts   SNR AngSep     Name
#  [deg]    [deg]    ['] [deg]  [deg]                   [']
 33.8105 -18.0689    2.4  31.5  115.4   1.3211   4.7 ------	UNKNOWN
 79.2550 -19.9434    2.1  34.9 -160.9   1.0750   5.4 ------	UNKNOWN
 91.3220   1.5605    2.6  59.4 -163.2   5.8917   4.5 ------	UNKNOWN
111.3744 -44.8382    3.1  41.3 -100.9   3.3556   3.8 ------	UNKNOWN
Pre-slew background subtracted image of 15-350 keV band
Time interval of the image:
-8.140000 18.252600

# RAcent  DECcent POSerr Theta    Phi  PeakCts   SNR AngSep     Name
#  [deg]    [deg]    ['] [deg]  [deg]                   [']
 81.6892 -28.0115    0.6  30.1 -148.1   0.9778  18.3 ------	UNKNOWN
 97.5662  -9.5148    2.0  53.8 -149.5   0.9985   5.8 ------	UNKNOWN
Post-slew image of 15-350 keV band
Time interval of the image:
70.052610 303.005500

# RAcent  DECcent POSerr Theta    Phi  PeakCts   SNR AngSep     Name
#  [deg]    [deg]    ['] [deg]  [deg]                   [']
 83.6313  22.0132    0.5  50.1 -175.9   8.7973  24.1    0.1	Crab
135.7259 -40.5770   16.3  45.6  -57.5  -0.5336  -0.7    9.1	Vela X-1
 36.3887 -27.1342    1.9  40.0   82.1   3.5823   6.0 ------	UNKNOWN
 57.8604   8.9643    2.4  43.6  146.4   1.8918   4.8 ------	UNKNOWN
 93.7702 -72.2569    2.3  44.7   -3.4   1.3732   4.9 ------	UNKNOWN
121.7862 -75.9438    2.8  51.7   -9.7   1.5108   4.1 ------	UNKNOWN
Plot creation:
Sun May 31 15:40:06 EDT 2015