Special notes of this burst
Image
Pre-slew 15.0-350.0 keV image (Event data)

#   RAcent    DECcent   POSerr    Theta     Phi              Peak Cts       SNR   Name
  219.1205   -67.4058   0.0043    24.5428    88.2863         6.1487488     44.910 TRIG_00155284

Foreground time interval of the image:
 -4.499  56.916 (delta_t =  61.415 [sec])
Background time interval of the image:
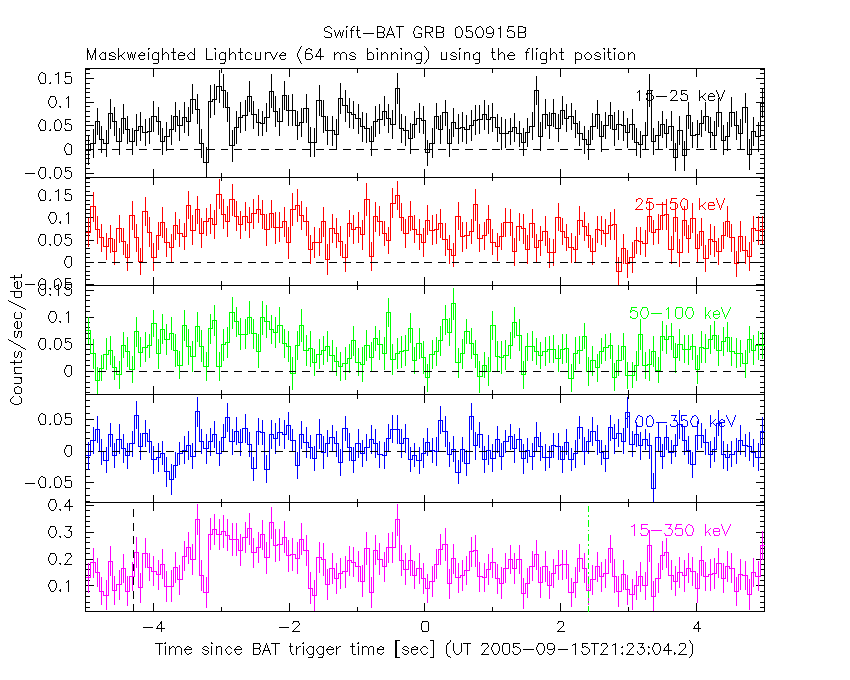
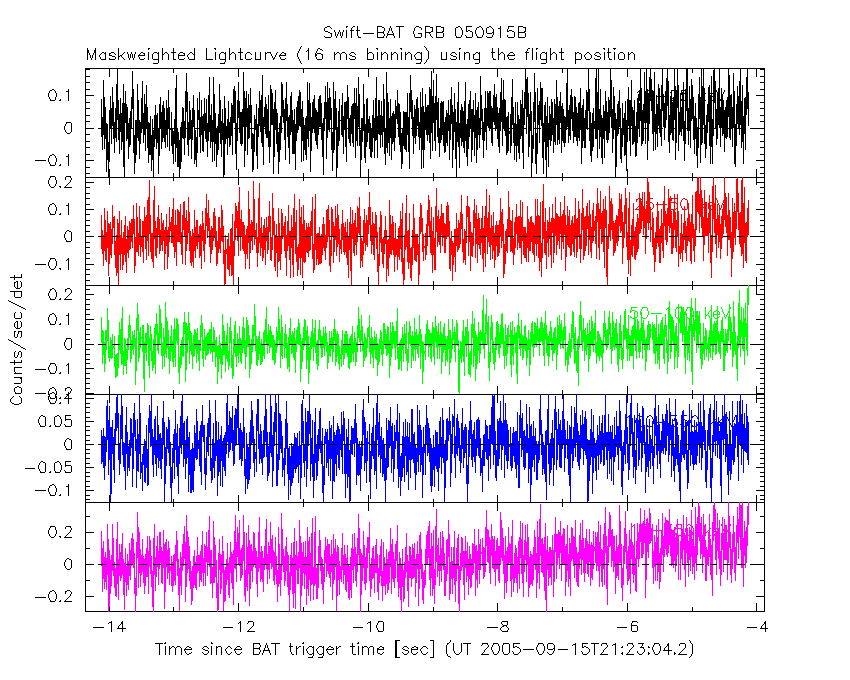
Lightcurves
Notes:
- 1) The mask-weighted light curves are using the flight position.
- 2) Multiple plots of different time binning/intervals are shown to cover all scenarios of short/long GRBs, rate/image triggers, and real/false positives.
- 3) For all the mask-weighted lightcurves, the y-axis units are counts/sec/det where a det is 0.4 x 0.4 = 0.16 sq cm.
- 4) The verticle lines correspond to following: green dotted lines are T50 interval, black dotted lines are T90 interval, blue solid line(s) is a spacecraft slew start time, and orange solid line(s) is a spacecraft slew end time.
- 5) Time of each bin is in the middle of the bin.
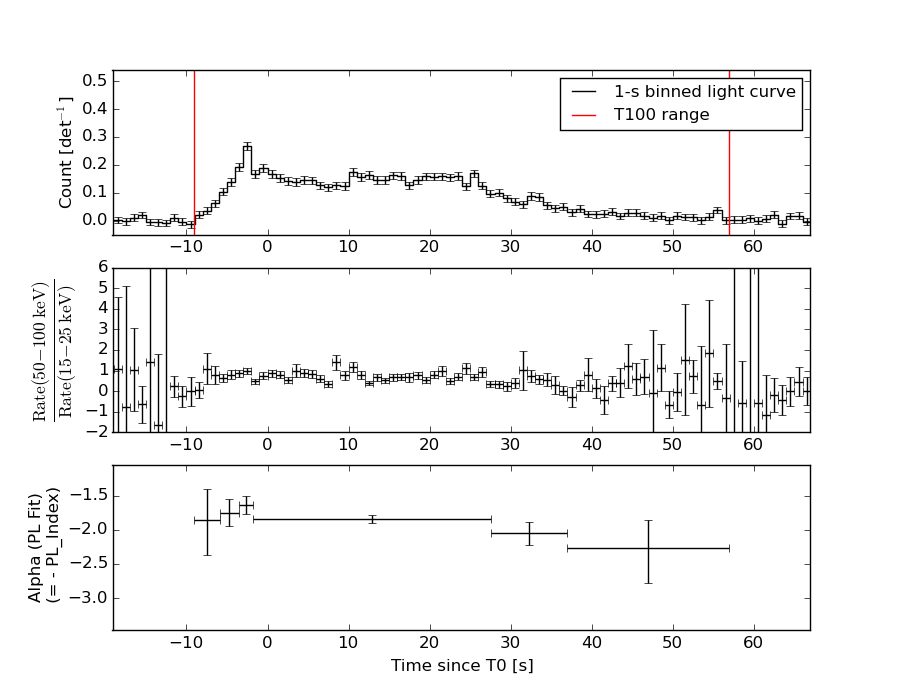
1 s binning
From T0-310 s to T0+310 s
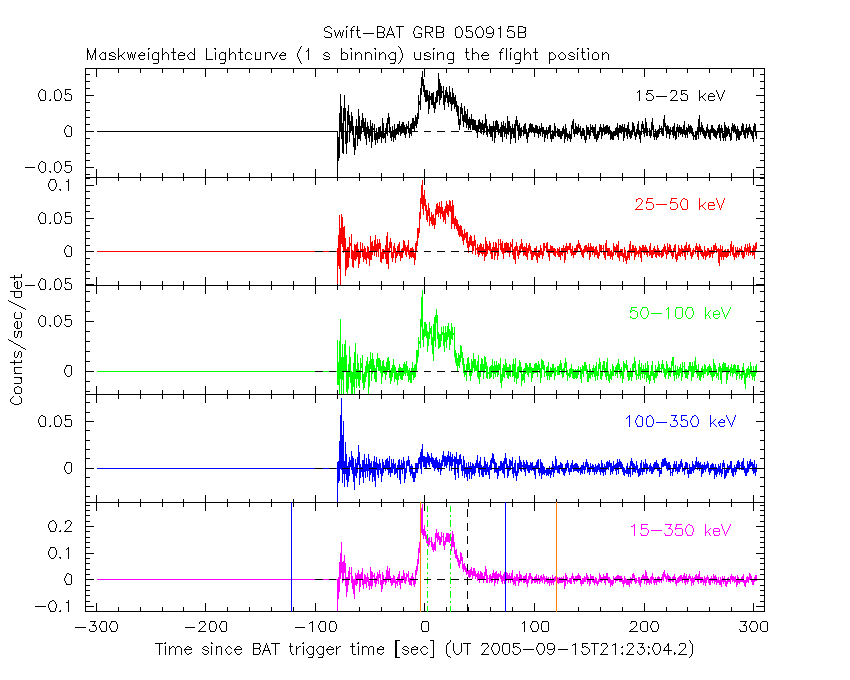
From T100_start - 20 s to T100_end + 30 s

Full time interval

64 ms binning
Full time interval

From T100_start to T100_end
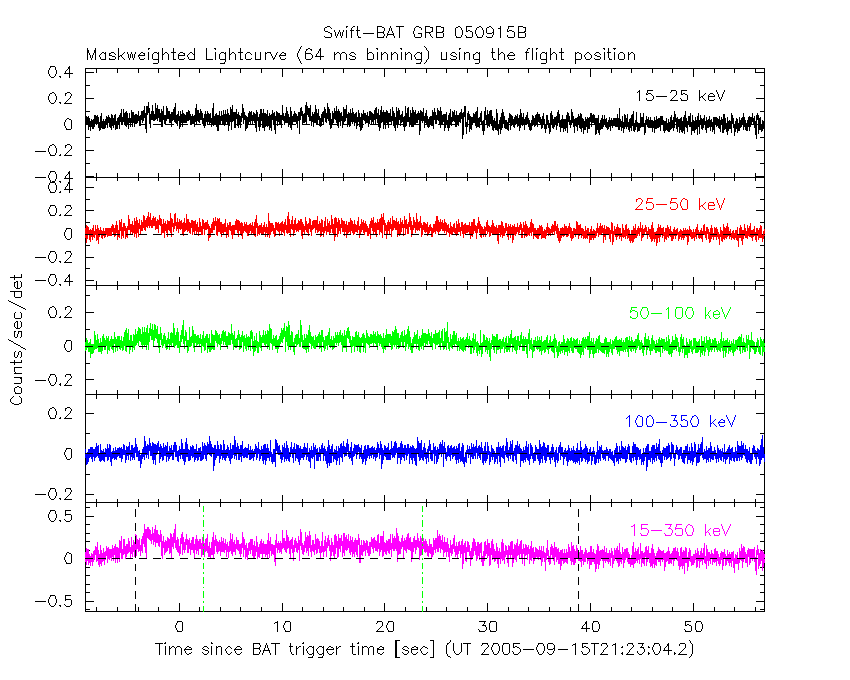
From T0-5 sec to T0+5 sec
16 ms binning
From T100_start-5 s to T100_start+5 s
Blue+Cyan dotted lines: Time interval of the scaled map
From 0.000000 to 64.000000
8 ms binning
From T100_start-3 s to T100_start+3 s

Blue+Cyan dotted lines: Time interval of the scaled map
From 0.000000 to 64.000000
2 ms binning
From T100_start-1 s to T100_start+1 s

Blue+Cyan dotted lines: Time interval of the scaled map
From 0.000000 to 64.000000
SN=5 or 10 sec. binning (whichever binning is satisfied first)
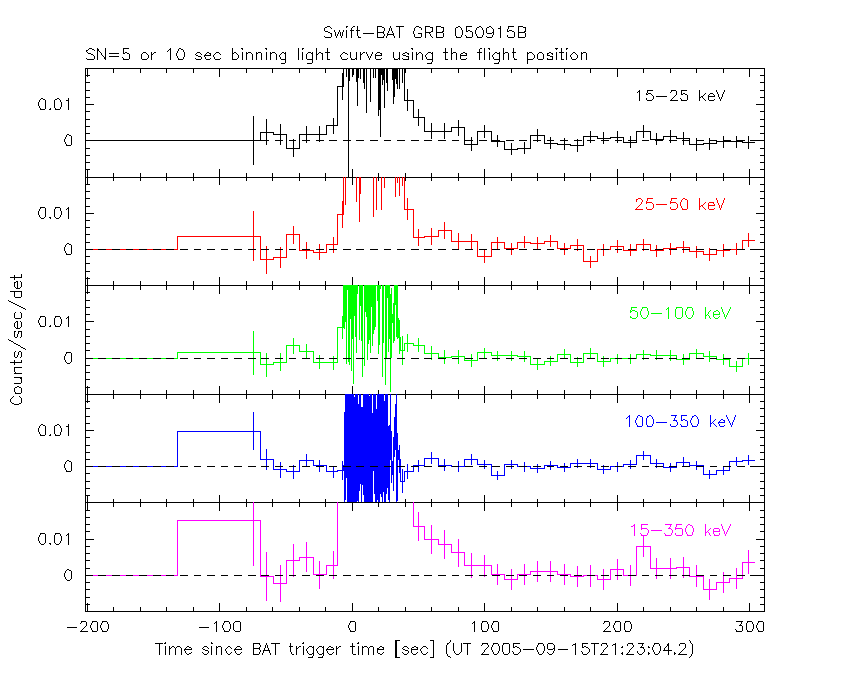
SN=5 or 10 sec. binning (T < 200 sec)

Quad-rate summed light curves (from T0-300s to T0+1000s)

Spectral Evolution
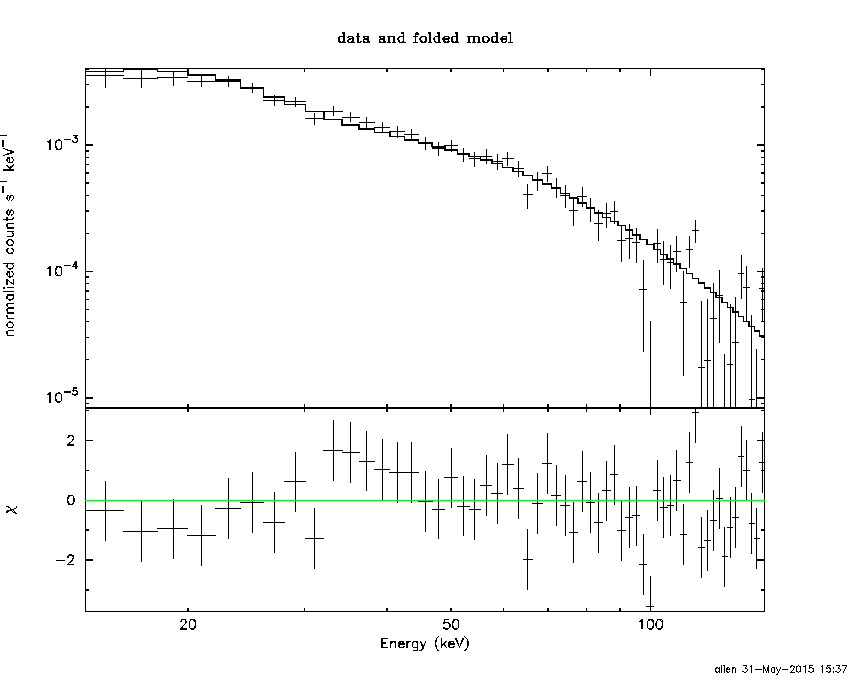
Spectra
Notes:
- 1) The fitting includes the systematic errors.
- 2) When the burst includes telescope slew time periods, the fitting uses an average response file made from multiple 5-s response files through out the slew time plus single time preiod for the non-slew times, and weighted by the total counts in the corresponding time period using addrmf. An average response file is needed becuase a spectral fit using the pre-slew DRM will introduce some errors in both a spectral shape and a normalization if the PHA file contains a lot of the slew/post-slew time interval.
- 3) For fits to more complicated models (e.g. a power-law over a cutoff power-law), the BAT team has decided to require a chi-square improvement of more than 6 for each extra dof.
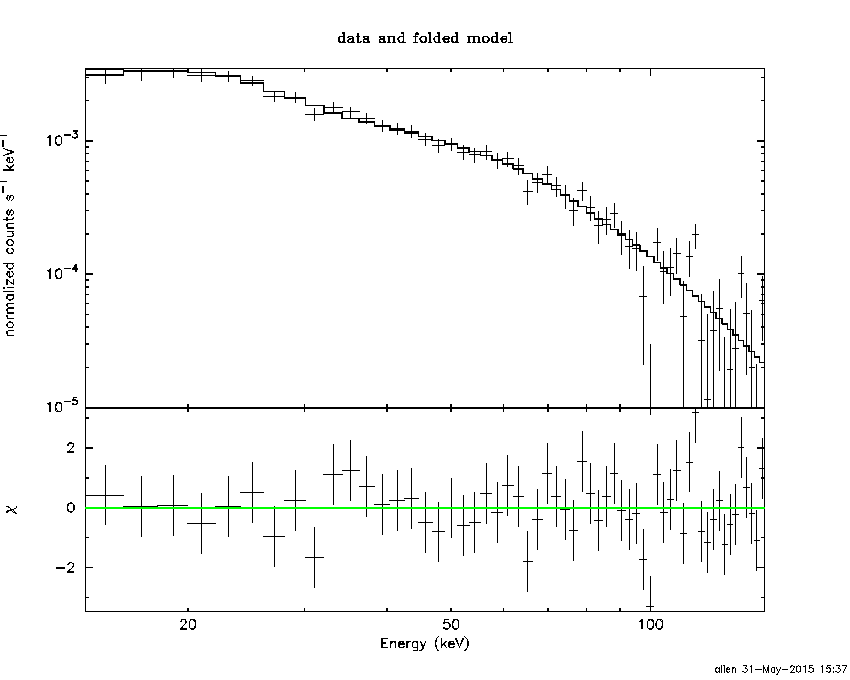
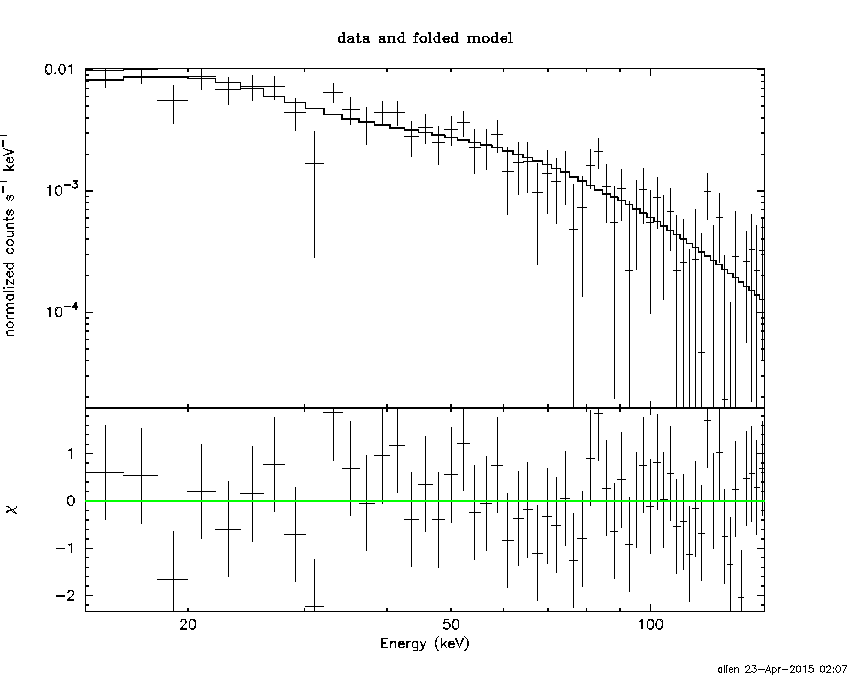
Time averaged spectrum fit using the average DRM
Power-law model

Time interval is from   -9.124 sec. to   56.916 sec.

Spectral model in power-law:
------------------------------------------------------------
Parameters  : value       lower 90%   higher 90%
Photon index: 1.88667     ( -0.0615787   0.0620983 )
Norm@50keV  : 5.86294E-03    ( -0.000198396   0.000197766 )
------------------------------------------------------------
#Fit statistic : Chi-Squared =          73.62 using 59 PHA bins.
# Reduced chi-squared =          1.292 for     57 degrees of freedom
# Null hypothesis probability =   6.841046e-02

Photon flux (15-150 keV)    in 66.04 sec: 0.836672 ( -0.0292371  0.0293432 ) ph/cm2/s
Energy fluence (15-150 keV)             : 3.55943e-06 ( -1.19909e-07  1.20184e-07 ) ergs/cm2
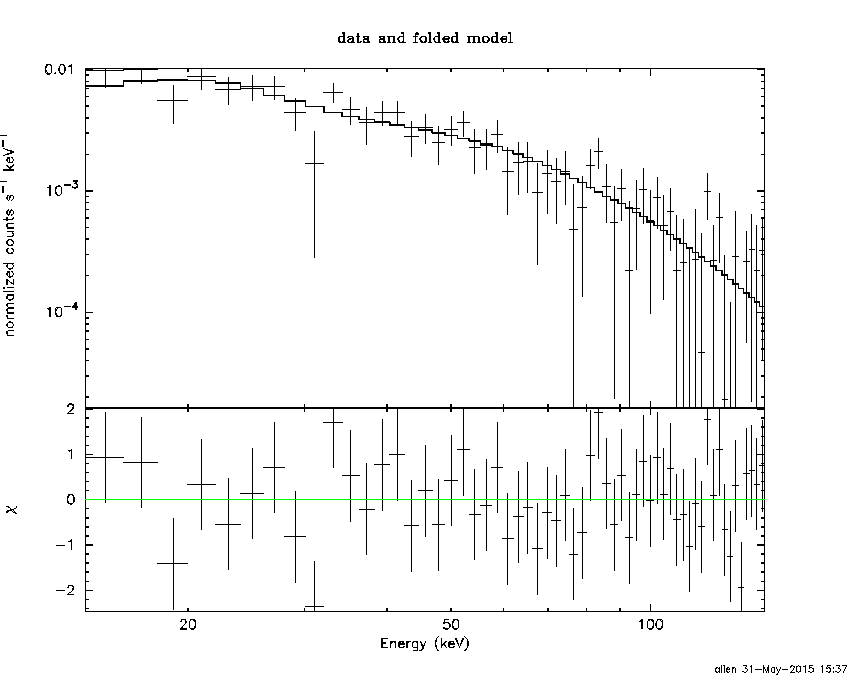
Cutoff power-law model

Time interval is from   -9.124 sec. to   56.916 sec.
Spectral model in the cutoff power-law:
------------------------------------------------------------
Parameters  : value       lower 90%   higher 90%
Photon index: 1.37401     ( -0.281655   0.26462 )
Epeak [keV] : 59.4409      ( -7.26838 14.634 )
Norm@50keV  : 1.06394E-02    ( -0.00275936   0.00404717 )
------------------------------------------------------------
#Fit statistic : Chi-Squared =          62.11 using 59 PHA bins.
# Reduced chi-squared =          1.109 for     56 degrees of freedom
# Null hypothesis probability =   2.676335e-01

Photon flux (15-150 keV)    in 66.04 sec: 0.804889 ( -0.032877  0.033031 ) ph/cm2/s
Energy fluence (15-150 keV)             : 3.40492e-06 ( -1.42422e-07  1.42739e-07 ) ergs/cm2
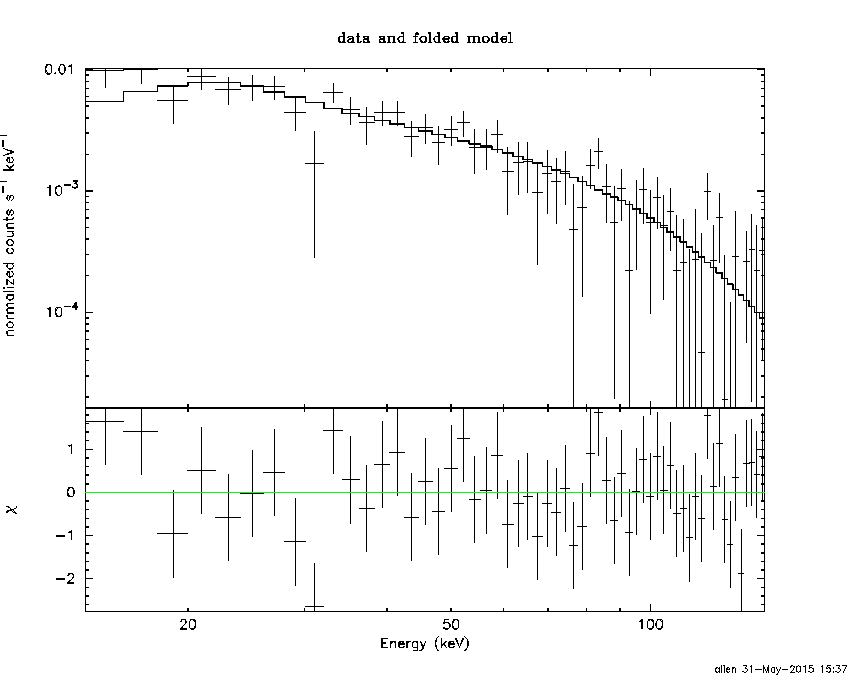
Band function
Time interval is from   -9.124 sec. to   56.916 sec.

Spectral model in the Band function:
------------------------------------------------------------
Parameters  : value       lower 90%   higher 90%
alpha       : -1.28389   ( -0.322706   1.05454 )
beta        : -2.31445    ( 2.31445   0.330983 )
Epeak [keV] : 55.7993      ( -18.5001 15.3747 )
Norm@50keV   : 1.19901E-02    ( -0.00382089   0.0459198 )
------------------------------------------------------------
#Fit statistic : Chi-Squared =          61.48 using 59 PHA bins.
# Reduced chi-squared =          1.118 for     55 degrees of freedom
# Null hypothesis probability =   2.552933e-01

Photon flux (15-150 keV)    in 66.04 sec:  (    ) ph/cm2/s
Energy fluence (15-150 keV)             : 3.40438e-06 ( 0  0 ) ergs/cm2
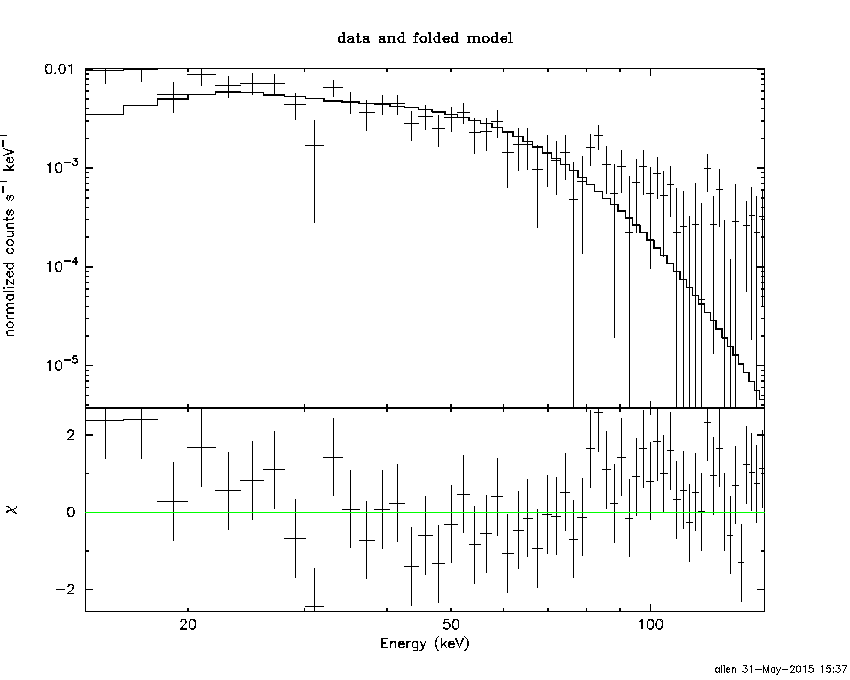
Single BB

Spectral model blackbody:
------------------------------------------------------------
Parameters  : value    Lower 90%  Upper 90%
kT [keV]    : 12.4948  (  )
R^2/D10^2   : 0.161615  (   )
(R is the radius in km and D10 is the distance to the source in units of 10 kpc)
------------------------------------------------------------
#Fit statistic : Chi-Squared =         229.53 using 59 PHA bins.
# Reduced chi-squared =         4.0268 for     57 degrees of freedom
# Null hypothesis probability =   1.451501e-22

Energy  Fluence     90% Error
[keV]   [erg/cm2]   [erg/cm2]
15- 25  3.533e-07   2.196e-08
25- 50  1.165e-06   4.326e-08
50-150  1.122e-06   7.859e-08
15-150  2.640e-06   9.279e-08
Thermal bremsstrahlung (OTTB)
Spectral model: thermal bremsstrahlung
------------------------------------------------------------
Parameters  : value         Lower 90%    Upper 90%
kT [keV]    : 92.0521       (-10.127      12.2742)
Norm        : 3.68697       (-0.191763     0.205453)
------------------------------------------------------------
#Fit statistic : Chi-Squared =          62.23 using 59 PHA bins.
# Reduced chi-squared =          1.092 for     57 degrees of freedom
# Null hypothesis probability =   2.955607e-01

Energy  Fluence     90% Error
[keV]   [erg/cm2]   [erg/cm2]
15- 25  6.357e-07   3.801e-08
25- 50  1.080e-06   3.995e-08
50-150  1.668e-06   3.992e-07
15-150  3.384e-06   3.906e-07
Double BB

Spectral model: bbodyrad<1> + bbodyrad<2>
------------------------------------------------------------
Parameters  : value         Lower 90%    Upper 90%
kT1 [keV]   : 6.74202        (-0.869278      0.912748)
R1^2/D10^2  : 1.07296        (-0.366797      0.67373)
kT2 [keV]   : 21.2977        (-2.51981      3.59898)
R2^2/D10^2  : 1.57622E-02    (-0.00741607   0.0110409)
------------------------------------------------------------
#Fit statistic : Chi-Squared =          69.82 using 59 PHA bins.
# Reduced chi-squared =          1.269 for     55 degrees of freedom
# Null hypothesis probability =   8.609582e-02

Energy  Fluence     90% Error
[keV]   [erg/cm2]   [erg/cm2]
15- 25  5.855e-07   6.994e-08
25- 50  1.092e-06   7.826e-08
50-150  1.647e-06   2.027e-07
15-150  3.324e-06   2.724e-07
Peak spectrum fit
Power-law model
Time interval is from   -3.076 sec. to   -2.076 sec.

Spectral model in power-law:
------------------------------------------------------------
Parameters  : value       lower 90%   higher 90%
Photon index: 1.59700     ( -0.15216   0.154924 )
Norm@50keV  : 1.78329E-02    ( -0.00162712   0.00161383 )
------------------------------------------------------------
#Fit statistic : Chi-Squared =          44.92 using 59 PHA bins.
# Reduced chi-squared =         0.7881 for     57 degrees of freedom
# Null hypothesis probability =   8.767827e-01

Photon flux (15-150 keV)    in 1 sec: 2.28945 ( -0.201653  0.201969 ) ph/cm2/s
Energy fluence (15-150 keV)             : 1.66837e-07 ( -1.63371e-08  1.64788e-08 ) ergs/cm2
Cutoff power-law model

Time interval is from   -3.076 sec. to   -2.076 sec.
Spectral model in the cutoff power-law:
------------------------------------------------------------
Parameters  : value       lower 90%   higher 90%
Photon index: 1.35250     ( -0.647505   0.376383 )
Epeak [keV] : 130.512      ( -63.8667 -130.513 )
Norm@50keV  : 2.38185E-02    ( -0.0146976   0.0267323 )
------------------------------------------------------------
#Fit statistic : Chi-Squared =          44.40 using 59 PHA bins.
# Reduced chi-squared =         0.7929 for     56 degrees of freedom
# Null hypothesis probability =   8.682127e-01

Photon flux (15-150 keV)    in 1 sec: 2.26491 ( -0.21008  0.20918 ) ph/cm2/s
Energy fluence (15-150 keV)             : 1.63875e-07 ( -1.8076e-08  1.7717e-08 ) ergs/cm2
Band function
Time interval is from   -3.076 sec. to   -2.076 sec.

Spectral model in the Band function:
------------------------------------------------------------
Parameters  : value       lower 90%   higher 90%
alpha       : -1.08651   ( 1.09245   1.09245 )
beta        : -1.74678    ( 1.75655   0.290527 )
Epeak [keV] : 74.0264      ( -76.8436 -76.8436 )
Norm@50keV   : 3.47070E-02    ( -0.0168064   0 )
------------------------------------------------------------
#Fit statistic : Chi-Squared =          44.22 using 59 PHA bins.
# Reduced chi-squared =         0.8039 for     55 degrees of freedom
# Null hypothesis probability =   8.507343e-01

Photon flux (15-150 keV)    in 1 sec:  (    ) ph/cm2/s
Energy fluence (15-150 keV)             : 0 ( 0  0 ) ergs/cm2
Single BB
Spectral model blackbody:
------------------------------------------------------------
Parameters  : value    Lower 90%  Upper 90%
kT [keV]    : 13.5869  (-1.46728  1.70398)
R^2/D10^2   : 0.358229  (-0.123707   0.182512)
(R is the radius in km and D10 is the distance to the source in units of 10 kpc)
------------------------------------------------------------
#Fit statistic : Chi-Squared =          74.96 using 59 PHA bins.
# Reduced chi-squared =          1.315 for     57 degrees of freedom
# Null hypothesis probability =   5.557140e-02

Energy  Fluence     90% Error
[keV]   [erg/cm2]   [erg/cm2]
15- 25  1.400e-08   2.345e-09
25- 50  5.052e-08   5.525e-09
50-150  6.045e-08   1.132e-08
15-150  1.250e-07   1.405e-08
Thermal bremsstrahlung (OTTB)

Spectral model: thermal bremsstrahlung
------------------------------------------------------------
Parameters  : value         Lower 90%    Upper 90%
kT [keV]    : 179.088       (-63.1556      -179.143)
Norm        : 9.34259       (-0.853595     0.971623)
------------------------------------------------------------
#Fit statistic : Chi-Squared =          44.46 using 59 PHA bins.
# Reduced chi-squared =         0.7799 for     57 degrees of freedom
# Null hypothesis probability =   8.869255e-01

Energy  Fluence     90% Error
[keV]   [erg/cm2]   [erg/cm2]
15- 25  2.357e-08   7.395e-09
25- 50  4.476e-08   1.754e-08
50-150  9.460e-08   5.082e-08
15-150  1.629e-07   6.437e-08
Double BB
Spectral model: bbodyrad<1> + bbodyrad<2>
------------------------------------------------------------
Parameters  : value         Lower 90%    Upper 90%
kT1 [keV]   : 7.95324        (-2.48997      2.2091)
R1^2/D10^2  : 1.67104        (-0.877305      2.46828)
kT2 [keV]   : 29.3785        (-9.27018      26.8353)
R2^2/D10^2  : 1.69672E-02    (-0.0145828   0.0549183)
------------------------------------------------------------
#Fit statistic : Chi-Squared =          46.69 using 59 PHA bins.
# Reduced chi-squared =         0.8490 for     55 degrees of freedom
# Null hypothesis probability =   7.797143e-01

Energy  Fluence     90% Error
[keV]   [erg/cm2]   [erg/cm2]
15- 25  2.135e-08   7.209e-09
25- 50  4.716e-08   1.464e-08
50-150  9.569e-08   4.626e-08
15-150  1.642e-07   6.523e-08
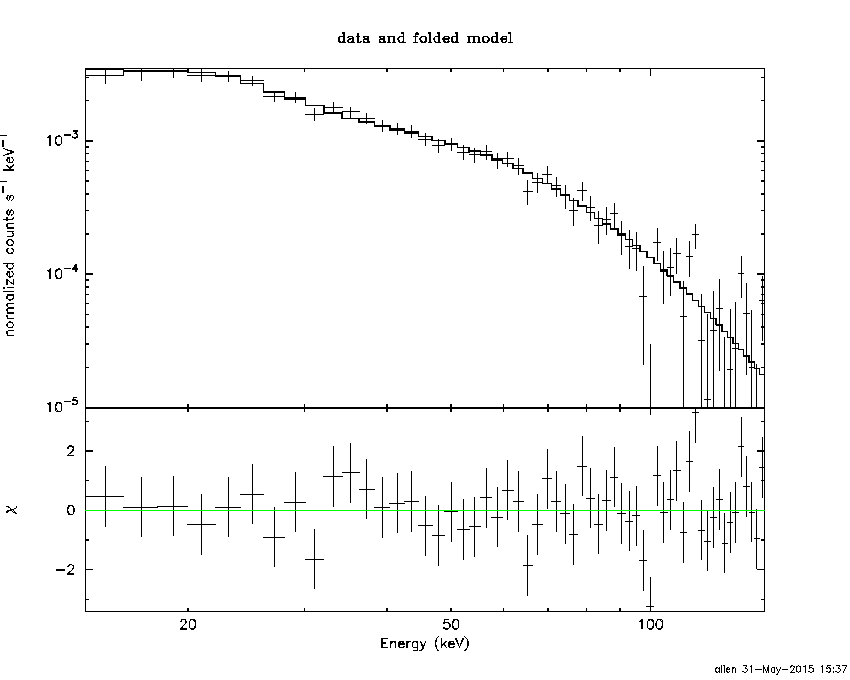
Pre-slew spectrum (Pre-slew PHA with pre-slew DRM)
Power-law model
Spectral model in power-law:
------------------------------------------------------------
Parameters  : value       lower 90%   higher 90%
Photon index: 1.88495     ( -0.0620958   0.0626191 )
Norm@50keV  : 6.02273E-03    ( -0.00020583   0.00020516 )
------------------------------------------------------------
#Fit statistic : Chi-Squared =          75.10 using 59 PHA bins.
# Reduced chi-squared =          1.318 for     57 degrees of freedom
# Null hypothesis probability =   5.430678e-02

Photon flux (15-150 keV)    in 61.42 sec: 0.858855 ( -0.0302372  0.0303509 ) ph/cm2/s
Energy fluence (15-150 keV)             : 3.40062e-06 ( -1.15739e-07  1.16022e-07 ) ergs/cm2
Cutoff power-law model

Spectral model in the cutoff power-law:
------------------------------------------------------------
Parameters  : value       lower 90%   higher 90%
Photon index: 1.39738     ( -0.282534   0.265255 )
Epeak [keV] : 59.9827      ( -7.70075 16.7217 )
Norm@50keV  : 1.06345E-02    ( -0.00277086   0.00407612 )
------------------------------------------------------------
#Fit statistic : Chi-Squared =          64.80 using 59 PHA bins.
# Reduced chi-squared =          1.157 for     56 degrees of freedom
# Null hypothesis probability =   1.965977e-01

Photon flux (15-150 keV)    in 61.42 sec: 0.828124 ( -0.033927  0.034155 ) ph/cm2/s
Energy fluence (15-150 keV)             : 3.25903e-06 ( -1.37734e-07  1.37925e-07 ) ergs/cm2
Band function

Spectral model in the Band function:
------------------------------------------------------------
Parameters  : value       lower 90%   higher 90%
alpha       : -1.13244   ( -0.469628   1.15781 )
beta        : -2.16070    ( 2.16053   0.200391 )
Epeak [keV] : 50.0493      ( -14.684 20.6277 )
Norm@50keV   : 1.53697E-02    ( -0.0069503   0.0748259 )
------------------------------------------------------------
#Fit statistic : Chi-Squared =          63.67 using 59 PHA bins.
# Reduced chi-squared =          1.158 for     55 degrees of freedom
# Null hypothesis probability =   1.978496e-01

Photon flux (15-150 keV)    in 61.42 sec:  (    ) ph/cm2/s
Energy fluence (15-150 keV)             : 3.26647e-06 ( -3.26604e-06  -1.38201e-07 ) ergs/cm2
S(25-50 keV) vs. S(50-100 keV) plot
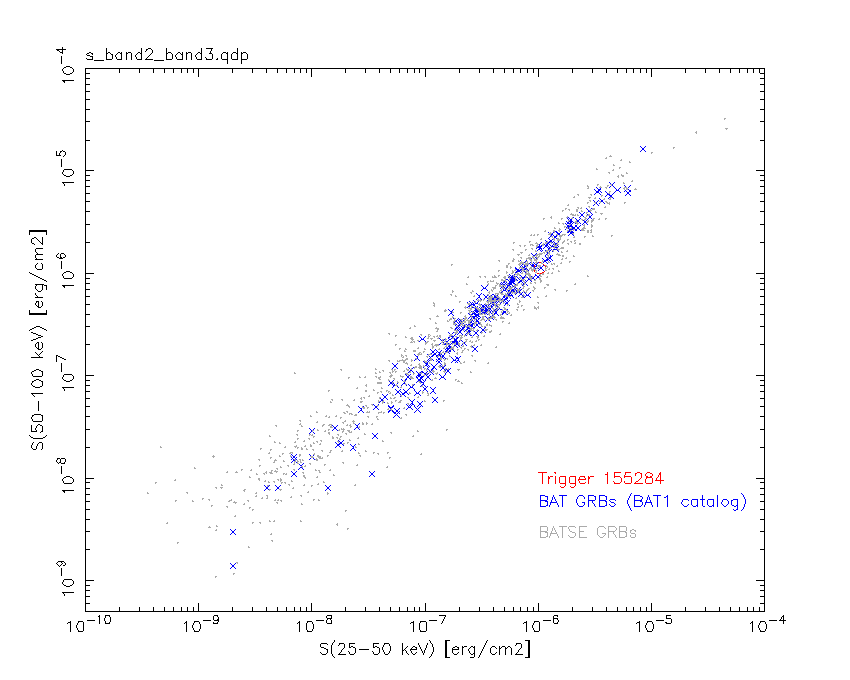
S(25-50 keV)  = 1.03e-06
S(50-100 keV) = 1.12e-06
T90 vs. Hardness ratio plot
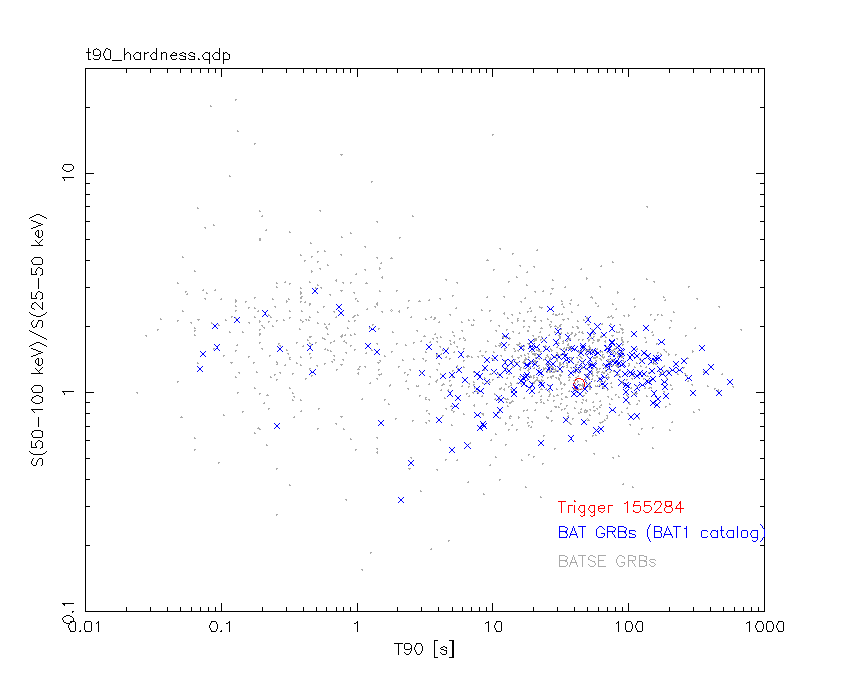
T90                                   = 43.0960000157356 sec.
Hardness ratio (energy fluence ratio) = 1.08738
Color vs. Color plot

Count Ratio  (25-50 keV) / (15-25 keV) = 1.16755
Count Ratio (50-100 keV) / (15-25 keV) = 0.67041
Mask shadow pattern
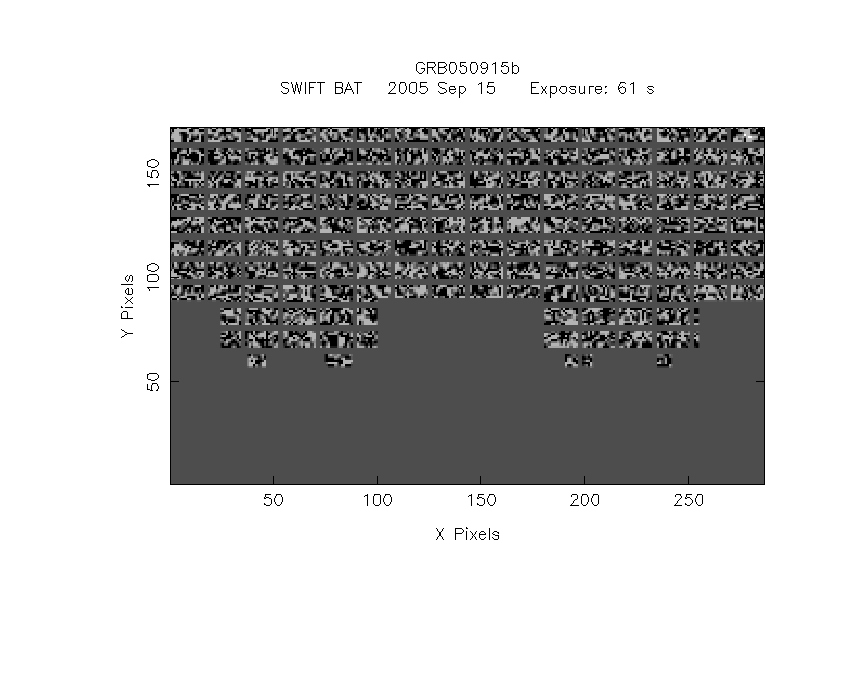
IMX = 1.365583999024523E-02, IMY = -4.564246376089915E-01
TIME vs. PHA plot around the trigger time
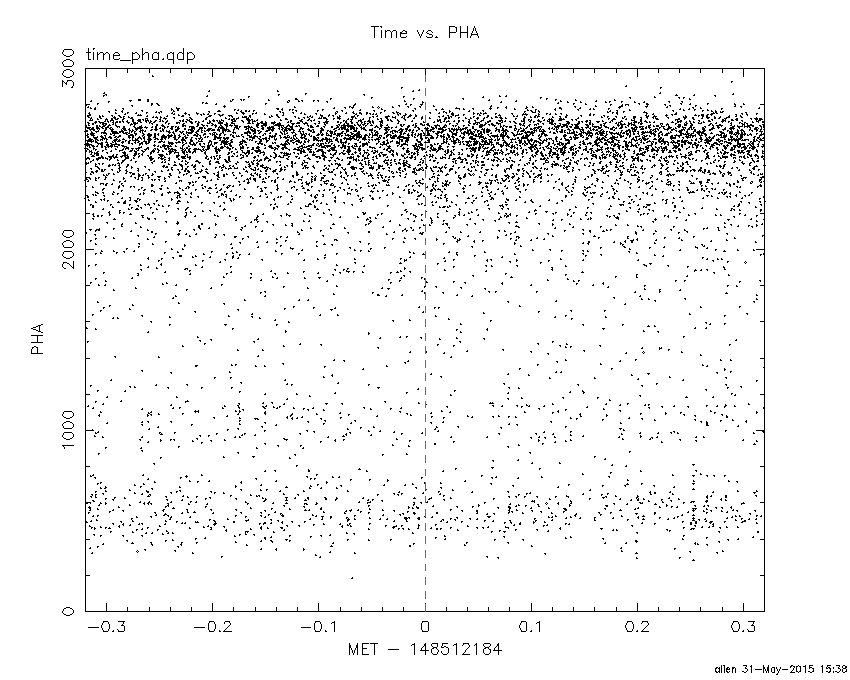
Blue+Cyan dotted lines: Time interval of the scaled map
From 0.000000 to 64.000000
TIME vs. DetID plot around the trigger time
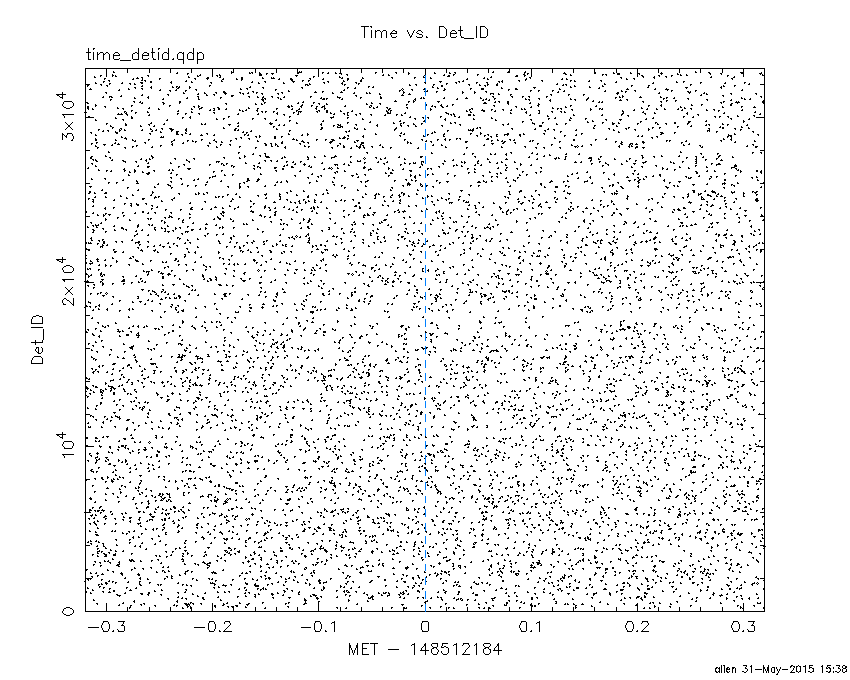
Blue+Cyan dotted lines: Time interval of the scaled map
From 0.000000 to 64.000000
100 us light curve (15-350 keV)
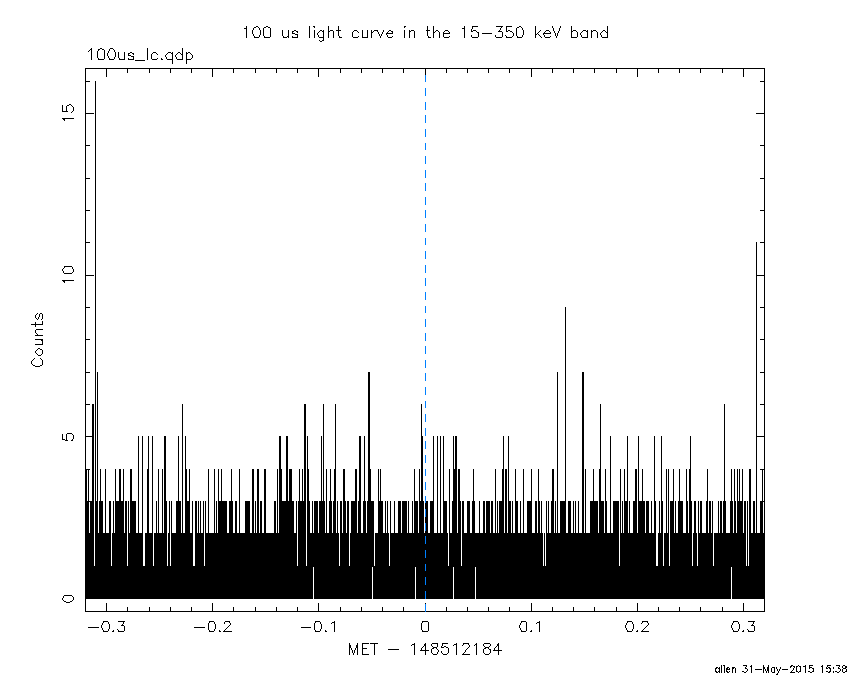
Blue+Cyan dotted lines: Time interval of the scaled map
From 0.000000 to 64.000000
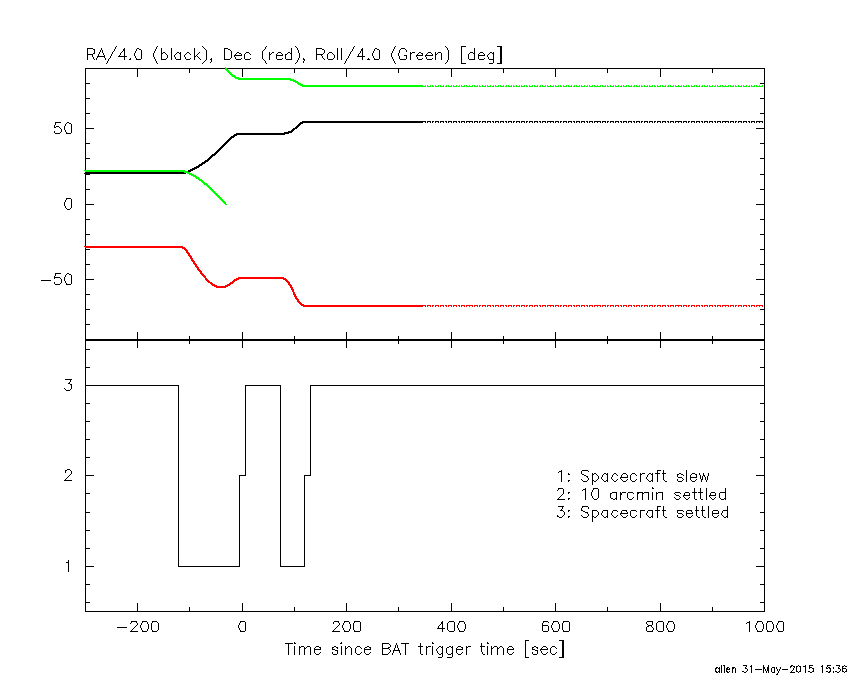
Spacecraft aspect plot
Bright source in the pre-burst/pre-slew/post-slew images
Pre-burst image of 15-350 keV band
Time interval of the image:
Pre-slew background subtracted image of 15-350 keV band
Time interval of the image:
-4.499400 56.916000

# RAcent  DECcent POSerr Theta    Phi  PeakCts   SNR AngSep     Name
#  [deg]    [deg]    ['] [deg]  [deg]                   [']
135.3739 -40.4191    0.0  36.9 -158.9  -0.0409  -0.3   10.8	Vela X-1
170.2887 -60.6877   49.7  15.1  150.4   0.0217   0.2    4.0	Cen X-3
186.6179 -62.7758    0.8  13.9  118.5   1.2732  14.5    1.1	GX 301-2
219.1197 -67.4057    0.3  24.5   88.3   6.1477  44.9 ------	UNKNOWN
229.2329 -46.5561    2.7  28.1   39.2   0.4929   4.3 ------	UNKNOWN
234.0319 -10.7076    2.6  54.5   -0.3   1.5517   4.5 ------	UNKNOWN
138.0279 -18.6523    2.4  49.5 -132.4   2.1433   4.9 ------	UNKNOWN
Post-slew image of 15-350 keV band
Time interval of the image:
120.100600 303.110400

# RAcent  DECcent POSerr Theta    Phi  PeakCts   SNR AngSep     Name
#  [deg]    [deg]    ['] [deg]  [deg]                   [']
135.3124 -40.5473   25.9  50.8 -146.0   0.2071   0.4    9.9	Vela X-1
170.1575 -60.4847    6.9  21.9 -138.6   0.2508   1.7    9.5	Cen X-3
186.6683 -62.7635    0.5  14.2 -129.6   3.3581  24.2    0.5	GX 301-2
244.9972 -15.6400    1.3  54.4  -11.9   4.2413   9.2    1.0	Sco X-1
255.8251 -37.8619    6.3  35.9   10.5  -0.3428  -1.8    7.7	4U 1700-377
256.5857 -36.4286    7.5  37.5   10.5   0.3080   1.5    7.3	GX 349+2
262.9038 -24.6680   15.0  50.4   11.7   0.3212   0.8    7.4	GX 1+4
264.7262 -44.4876    4.4  33.0   26.4   0.4890   2.6    2.4	4U 1735-44
270.3951 -25.0750   16.7  52.5   20.0   0.4419   0.7    6.0	GX 5-1
270.2468 -25.7033    9.0  51.9   20.1   0.7645   1.3    3.8	GRS 1758-258
275.9226 -30.2384   10.7  49.7   28.4   0.6425   1.1    7.7	H1820-303
263.0707 -33.7577    2.8  42.0   16.5   1.0088   4.2    6.2	GX 354-0
253.4647 -39.8573    1.9  33.4    8.9   1.1048   6.0 ------	UNKNOWN
 96.5255 -50.9032    2.8  54.1  177.9   2.1008   4.1 ------	UNKNOWN
 98.4139 -47.3433    3.5  56.9 -179.0   2.6827   3.3 ------	UNKNOWN
163.7184 -36.0127    3.0  44.0 -116.5   2.3837   3.9 ------	UNKNOWN
Plot creation:
Sun May 31 15:38:25 EDT 2015