Special notes of this burst
Image
Pre-slew 15.0-350.0 keV image (Event data)
#   RAcent    DECcent   POSerr    Theta     Phi              Peak Cts       SNR   Name
  317.3872    -8.7625   0.0036    34.5467   158.8477         2.5092686     52.774 TRIG_00156467

Foreground time interval of the image:
 -3.316   3.484 (delta_t =   6.800 [sec])
Background time interval of the image:
-51.843  -3.316 (delta_t =  48.527 [sec])
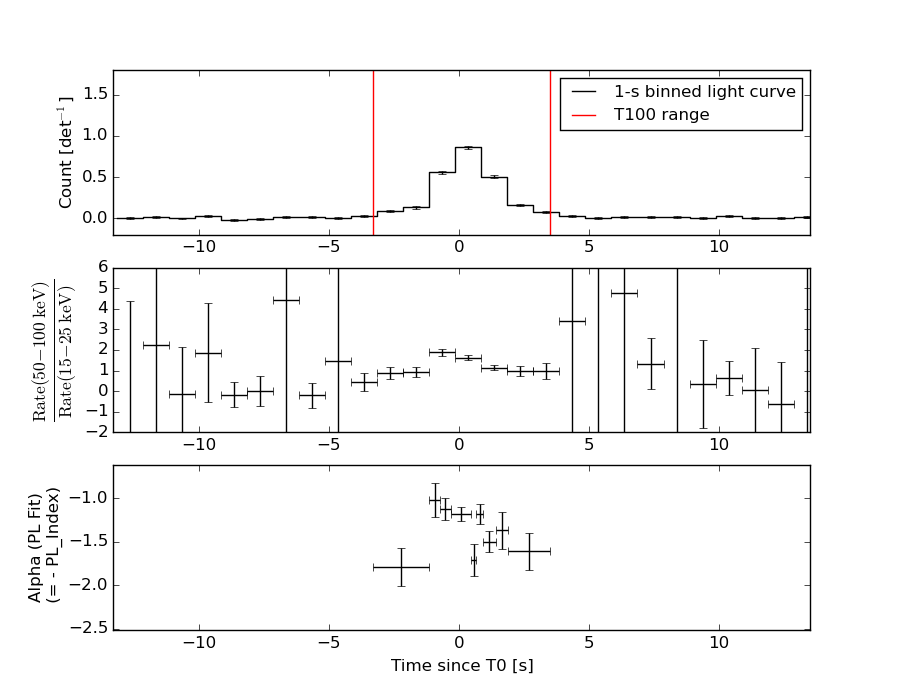
Lightcurves
Notes:
- 1) The mask-weighted light curves are using the flight position.
- 2) Multiple plots of different time binning/intervals are shown to cover all scenarios of short/long GRBs, rate/image triggers, and real/false positives.
- 3) For all the mask-weighted lightcurves, the y-axis units are counts/sec/det where a det is 0.4 x 0.4 = 0.16 sq cm.
- 4) The verticle lines correspond to following: green dotted lines are T50 interval, black dotted lines are T90 interval, blue solid line(s) is a spacecraft slew start time, and orange solid line(s) is a spacecraft slew end time.
- 5) Time of each bin is in the middle of the bin.
1 s binning
From T0-310 s to T0+310 s
From T100_start - 20 s to T100_end + 30 s
Full time interval
64 ms binning
Full time interval

From T100_start to T100_end
From T0-5 sec to T0+5 sec
16 ms binning
From T100_start-5 s to T100_start+5 s
Blue+Cyan dotted lines: Time interval of the scaled map
From 0.000000 to 1.024000
8 ms binning
From T100_start-3 s to T100_start+3 s
Blue+Cyan dotted lines: Time interval of the scaled map
From 0.000000 to 1.024000
2 ms binning
From T100_start-1 s to T100_start+1 s

Blue+Cyan dotted lines: Time interval of the scaled map
From 0.000000 to 1.024000
SN=5 or 10 sec. binning (whichever binning is satisfied first)
SN=5 or 10 sec. binning (T < 200 sec)
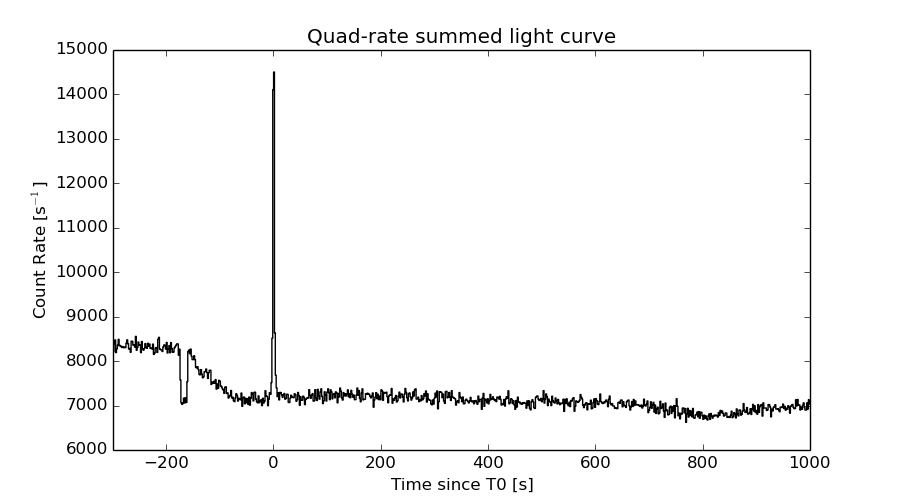
Quad-rate summed light curves (from T0-300s to T0+1000s)
Spectral Evolution
Spectra
Notes:
- 1) The fitting includes the systematic errors.
- 2) When the burst includes telescope slew time periods, the fitting uses an average response file made from multiple 5-s response files through out the slew time plus single time preiod for the non-slew times, and weighted by the total counts in the corresponding time period using addrmf. An average response file is needed becuase a spectral fit using the pre-slew DRM will introduce some errors in both a spectral shape and a normalization if the PHA file contains a lot of the slew/post-slew time interval.
- 3) For fits to more complicated models (e.g. a power-law over a cutoff power-law), the BAT team has decided to require a chi-square improvement of more than 6 for each extra dof.
Time averaged spectrum fit using the average DRM
Power-law model
Time interval is from   -3.316 sec. to    3.484 sec.

Spectral model in power-law:
------------------------------------------------------------
Parameters  : value       lower 90%   higher 90%
Photon index: 1.35664     ( -0.0558196   0.0557072 )
Norm@50keV  : 2.44893E-02    ( -0.000757394   0.000757376 )
------------------------------------------------------------
#Fit statistic : Chi-Squared =          70.98 using 59 PHA bins.
# Reduced chi-squared =          1.245 for     57 degrees of freedom
# Null hypothesis probability =   1.008992e-01

Photon flux (15-150 keV)    in 6.8 sec: 2.95431 ( -0.0983505  0.0985329 ) ph/cm2/s
Energy fluence (15-150 keV)             : 1.62403e-06 ( -5.35595e-08  5.36294e-08 ) ergs/cm2
Cutoff power-law model

Time interval is from   -3.316 sec. to    3.484 sec.
Spectral model in the cutoff power-law:
------------------------------------------------------------
Parameters  : value       lower 90%   higher 90%
Photon index: 1.12629     ( -0.226412   0.212862 )
Epeak [keV] : 209.569      ( -76.9706 919.895 )
Norm@50keV  : 3.12754E-02    ( -0.00607086   0.00824488 )
------------------------------------------------------------
#Fit statistic : Chi-Squared =          67.63 using 59 PHA bins.
# Reduced chi-squared =          1.208 for     56 degrees of freedom
# Null hypothesis probability =   1.371989e-01

Photon flux (15-150 keV)    in 6.8 sec: 2.91605 ( -0.10395  0.10422 ) ph/cm2/s
Energy fluence (15-150 keV)             : 1.60394e-06 ( -5.75348e-08  5.72696e-08 ) ergs/cm2
Band function

Time interval is from   -3.316 sec. to    3.484 sec.

Spectral model in the Band function:
------------------------------------------------------------
Parameters  : value       lower 90%   higher 90%
alpha       : -0.400324   ( -0.290371   0.532511 )
beta        : -1.48925    ( -0.130255   0.109317 )
Epeak [keV] : 67.1752      ( -43.9096 69.6244 )
Norm@50keV   : 8.45109E-02    ( -0.048904   419.115 )
------------------------------------------------------------
#Fit statistic : Chi-Squared =          62.37 using 59 PHA bins.
# Reduced chi-squared =          1.134 for     55 degrees of freedom
# Null hypothesis probability =   2.308275e-01

Photon flux (15-150 keV)    in 6.8 sec:  (    ) ph/cm2/s
Energy fluence (15-150 keV)             : 0 ( 0  0 ) ergs/cm2
Single BB
Spectral model blackbody:
------------------------------------------------------------
Parameters  : value    Lower 90%  Upper 90%
kT [keV]    : 17.5496  (  )
R^2/D10^2   : 0.198718  (   )
(R is the radius in km and D10 is the distance to the source in units of 10 kpc)
------------------------------------------------------------
#Fit statistic : Chi-Squared =         276.11 using 59 PHA bins.
# Reduced chi-squared =         4.8441 for     57 degrees of freedom
# Null hypothesis probability =   1.702354e-30

Energy  Fluence     90% Error
[keV]   [erg/cm2]   [erg/cm2]
15- 25  8.399e-08   5.474e-09
25- 50  3.810e-07   1.615e-08
50-150  8.459e-07   4.488e-08
15-150  1.311e-06   4.624e-08
Thermal bremsstrahlung (OTTB)
Spectral model: thermal bremsstrahlung
------------------------------------------------------------
Parameters  : value         Lower 90%    Upper 90%
kT [keV]    : 200.000       (      )
Norm        : 12.4006       (-0.386168     0.386026)
------------------------------------------------------------
#Fit statistic : Chi-Squared =         108.80 using 59 PHA bins.
# Reduced chi-squared =         1.9087 for     57 degrees of freedom
# Null hypothesis probability =   4.331335e-05

Energy  Fluence     90% Error
[keV]   [erg/cm2]   [erg/cm2]
15- 25  2.100e-07   6.902e-09
25- 50  4.039e-07   1.299e-08
50-150  8.858e-07   2.924e-08
15-150  1.500e-06   4.794e-08
Double BB
Spectral model: bbodyrad<1> + bbodyrad<2>
------------------------------------------------------------
Parameters  : value         Lower 90%    Upper 90%
kT1 [keV]   : 9.40571        (-0.941568      0.974733)
R1^2/D10^2  : 1.11777        (-0.282202      0.419435)
kT2 [keV]   : 37.7511        (-5.58273      8.75721)
R2^2/D10^2  : 1.18714E-02    (-0.00555206   0.00825608)
------------------------------------------------------------
#Fit statistic : Chi-Squared =          61.13 using 59 PHA bins.
# Reduced chi-squared =          1.112 for     55 degrees of freedom
# Null hypothesis probability =   2.652030e-01

Energy  Fluence     90% Error
[keV]   [erg/cm2]   [erg/cm2]
15- 25  1.492e-07   1.465e-08
25- 50  4.077e-07   2.822e-08
50-150  1.053e-06   1.778e-07
15-150  1.610e-06   1.941e-07
Peak spectrum fit
Power-law model
Time interval is from   -0.076 sec. to    0.924 sec.

Spectral model in power-law:
------------------------------------------------------------
Parameters  : value       lower 90%   higher 90%
Photon index: 1.29912     ( -0.0696675   0.0696745 )
Norm@50keV  : 6.03769E-02    ( -0.00247541   0.00247517 )
------------------------------------------------------------
#Fit statistic : Chi-Squared =          69.86 using 59 PHA bins.
# Reduced chi-squared =          1.226 for     57 degrees of freedom
# Null hypothesis probability =   1.178458e-01

Photon flux (15-150 keV)    in 1 sec: 7.20195 ( -0.305059  0.305339 ) ph/cm2/s
Energy fluence (15-150 keV)             : 5.96761e-07 ( -2.68822e-08  2.69478e-08 ) ergs/cm2
Cutoff power-law model
Time interval is from   -0.076 sec. to    0.924 sec.
Spectral model in the cutoff power-law:
------------------------------------------------------------
Parameters  : value       lower 90%   higher 90%
Photon index: 0.889568     ( -0.293391   0.274956 )
Epeak [keV] : 146.482      ( -40.0061 174.475 )
Norm@50keV  : 9.45515E-02    ( -0.0240426   0.0348189 )
------------------------------------------------------------
#Fit statistic : Chi-Squared =          63.19 using 59 PHA bins.
# Reduced chi-squared =          1.128 for     56 degrees of freedom
# Null hypothesis probability =   2.373631e-01

Photon flux (15-150 keV)    in 1 sec: 7.08746 ( -0.31375  0.31397 ) ph/cm2/s
Energy fluence (15-150 keV)             : 5.84584e-07 ( -2.8749e-08  2.8581e-08 ) ergs/cm2
Band function
Time interval is from   -0.076 sec. to    0.924 sec.

Spectral model in the Band function:
------------------------------------------------------------
Parameters  : value       lower 90%   higher 90%
alpha       : 8.89558E-02   ( -0.671762   3.22257 )
beta        : -1.51415    ( -0.178951   0.149097 )
Epeak [keV] : 59.9225      ( -29.5012 39.6751 )
Norm@50keV   : 0.373199    ( -0.255676   55.7482 )
------------------------------------------------------------
#Fit statistic : Chi-Squared =          57.68 using 59 PHA bins.
# Reduced chi-squared =          1.049 for     55 degrees of freedom
# Null hypothesis probability =   3.765013e-01

Photon flux (15-150 keV)    in 1 sec:  (    ) ph/cm2/s
Energy fluence (15-150 keV)             : 0 ( 0  0 ) ergs/cm2
Single BB

Spectral model blackbody:
------------------------------------------------------------
Parameters  : value    Lower 90%  Upper 90%
kT [keV]    : 17.2177  (  )
R^2/D10^2   : 0.536841  (   )
(R is the radius in km and D10 is the distance to the source in units of 10 kpc)
------------------------------------------------------------
#Fit statistic : Chi-Squared =         171.12 using 59 PHA bins.
# Reduced chi-squared =         3.0021 for     57 degrees of freedom
# Null hypothesis probability =   2.431678e-13

Energy  Fluence     90% Error
[keV]   [erg/cm2]   [erg/cm2]
15- 25  3.230e-08   2.595e-09
25- 50  1.443e-07   7.950e-09
50-150  3.067e-07   2.175e-08
15-150  4.834e-07   2.495e-08
Thermal bremsstrahlung (OTTB)

Spectral model: thermal bremsstrahlung
------------------------------------------------------------
Parameters  : value         Lower 90%    Upper 90%
kT [keV]    : 200.000       (      )
Norm        : 29.9676       (-1.23998     1.23978)
------------------------------------------------------------
#Fit statistic : Chi-Squared =         101.71 using 59 PHA bins.
# Reduced chi-squared =         1.7845 for     57 degrees of freedom
# Null hypothesis probability =   2.503667e-04

Energy  Fluence     90% Error
[keV]   [erg/cm2]   [erg/cm2]
15- 25  7.464e-08   3.195e-09
25- 50  1.436e-07   6.600e-09
50-150  3.149e-07   1.325e-08
15-150  5.331e-07   2.575e-08
Double BB
Spectral model: bbodyrad<1> + bbodyrad<2>
------------------------------------------------------------
Parameters  : value         Lower 90%    Upper 90%
kT1 [keV]   : 9.63847        (-1.2001      1.26776)
R1^2/D10^2  : 2.48083        (-0.724718      1.15385)
kT2 [keV]   : 36.9291        (-6.53216      11.7368)
R2^2/D10^2  : 3.16178E-02    (-0.0179996   0.0295525)
------------------------------------------------------------
#Fit statistic : Chi-Squared =          55.44 using 59 PHA bins.
# Reduced chi-squared =          1.008 for     55 degrees of freedom
# Null hypothesis probability =   4.580907e-01

Energy  Fluence     90% Error
[keV]   [erg/cm2]   [erg/cm2]
15- 25  5.219e-08   7.560e-09
25- 50  1.484e-07   1.885e-08
50-150  3.892e-07   1.163e-07
15-150  5.897e-07   1.286e-07
Pre-slew spectrum (Pre-slew PHA with pre-slew DRM)
Power-law model

Spectral model in power-law:
------------------------------------------------------------
Parameters  : value       lower 90%   higher 90%
Photon index: 1.35664     ( -0.0558196   0.0557072 )
Norm@50keV  : 2.44893E-02    ( -0.000757394   0.000757376 )
------------------------------------------------------------
#Fit statistic : Chi-Squared =          70.98 using 59 PHA bins.
# Reduced chi-squared =          1.245 for     57 degrees of freedom
# Null hypothesis probability =   1.008992e-01

Photon flux (15-150 keV)    in 6.8 sec: 2.95431 ( -0.0983505  0.0985329 ) ph/cm2/s
Energy fluence (15-150 keV)             : 1.62403e-06 ( -5.35595e-08  5.36294e-08 ) ergs/cm2
Cutoff power-law model

Spectral model in the cutoff power-law:
------------------------------------------------------------
Parameters  : value       lower 90%   higher 90%
Photon index: 1.12629     ( -0.226412   0.212862 )
Epeak [keV] : 209.569      ( -76.9706 1452.8 )
Norm@50keV  : 3.12754E-02    ( -0.00607086   0.00824488 )
------------------------------------------------------------
#Fit statistic : Chi-Squared =          67.63 using 59 PHA bins.
# Reduced chi-squared =          1.208 for     56 degrees of freedom
# Null hypothesis probability =   1.371989e-01

Photon flux (15-150 keV)    in 6.8 sec: 2.91605 ( -0.10395  0.10422 ) ph/cm2/s
Energy fluence (15-150 keV)             : 1.60394e-06 ( -5.75348e-08  5.72696e-08 ) ergs/cm2
Band function
Spectral model in the Band function:
------------------------------------------------------------
Parameters  : value       lower 90%   higher 90%
alpha       : -0.400324   ( -0.290371   0.532511 )
beta        : -1.48925    ( -0.130255   0.109317 )
Epeak [keV] : 67.1752      ( -43.9096 69.6244 )
Norm@50keV   : 8.45109E-02    ( -0.0508051   419.102 )
------------------------------------------------------------
#Fit statistic : Chi-Squared =          62.37 using 59 PHA bins.
# Reduced chi-squared =          1.134 for     55 degrees of freedom
# Null hypothesis probability =   2.308275e-01

Photon flux (15-150 keV)    in 6.8 sec:  (    ) ph/cm2/s
Energy fluence (15-150 keV)             : 0 ( 0  0 ) ergs/cm2
S(25-50 keV) vs. S(50-100 keV) plot
S(25-50 keV)  = 3.73e-07
S(50-100 keV) = 5.83e-07
T90 vs. Hardness ratio plot
T90                                   = 4.55200001597404 sec.
Hardness ratio (energy fluence ratio) = 1.563
Color vs. Color plot
Count Ratio  (25-50 keV) / (15-25 keV) = 1.68259
Count Ratio (50-100 keV) / (15-25 keV) = 1.37689
Mask shadow pattern

IMX = -6.420951896159968E-01, IMY = -2.484374243543705E-01
TIME vs. PHA plot around the trigger time
Blue+Cyan dotted lines: Time interval of the scaled map
From 0.000000 to 1.024000
TIME vs. DetID plot around the trigger time
Blue+Cyan dotted lines: Time interval of the scaled map
From 0.000000 to 1.024000
100 us light curve (15-350 keV)

Blue+Cyan dotted lines: Time interval of the scaled map
From 0.000000 to 1.024000
Spacecraft aspect plot
Bright source in the pre-burst/pre-slew/post-slew images
Pre-burst image of 15-350 keV band
Time interval of the image:
-51.843410 -3.316000

# RAcent  DECcent POSerr Theta    Phi  PeakCts   SNR AngSep     Name
#  [deg]    [deg]    ['] [deg]  [deg]                   [']
288.8513  11.0461    7.8  47.5 -150.8   0.2107   1.5    6.8	GRS 1915+105
299.6241  35.2224    0.9  36.8 -114.8   1.5580  12.3    2.1	Cyg X-1
307.9639  40.8999    4.7  33.0 -101.1   0.2546   2.4    7.3	Cyg X-3
325.9388  38.3711    8.9  21.3  -83.5   0.0962   1.3   11.4	Cyg X-2
 23.8111   4.4776    2.4  47.6   44.4   1.3237   4.8 ------	UNKNOWN
303.3412 -23.4899    2.4  54.4  161.3   1.6638   4.9 ------	UNKNOWN
340.5935  36.8177    2.0  17.5  -49.6   0.3582   5.7 ------	UNKNOWN
Pre-slew background subtracted image of 15-350 keV band
Time interval of the image:
-3.316000 3.484000

# RAcent  DECcent POSerr Theta    Phi  PeakCts   SNR AngSep     Name
#  [deg]    [deg]    ['] [deg]  [deg]                   [']
288.8074  11.1652    0.0  47.5 -150.6  -0.0604  -0.8   13.2	GRS 1915+105
299.7005  35.2618    9.7  36.7 -114.7   0.0713   1.2    6.5	Cyg X-1
308.2089  40.8109    6.1  32.8 -101.1  -0.1028  -1.9    9.6	Cyg X-3
325.9115  38.3548    0.0  21.3  -83.5  -0.0969  -2.7   12.4	Cyg X-2
335.9986  -3.3706    2.1  23.0  125.9   0.2083   5.4 ------	UNKNOWN
317.3872  -8.7625    0.2  34.5  158.8   2.5092  52.8 ------	UNKNOWN
291.2812 -15.1650    3.1  57.2  178.1   0.8184   3.8 ------	UNKNOWN
289.1272 -12.3933    2.1  57.3 -177.8   1.0875   5.5 ------	UNKNOWN
Post-slew image of 15-350 keV band
Time interval of the image:
94.756600 302.973400

# RAcent  DECcent POSerr Theta    Phi  PeakCts   SNR AngSep     Name
#  [deg]    [deg]    ['] [deg]  [deg]                   [']
285.0209 -25.0044    7.1  34.8 -112.4   0.4187   1.6    5.1	HT1900.1-2455
288.8113  10.9722    1.1  34.6  -46.3   2.1981  10.5    1.8	GRS 1915+105
299.5849  35.2084    0.5  47.1  -10.5   6.7223  23.6    0.5	Cyg X-1
308.0889  40.9687    3.2  50.5    0.4   1.3054   3.6    1.4	Cyg X-3
326.1954  38.3508   22.7  47.8   18.8   0.2055   0.5    2.1	Cyg X-2
336.2902  34.1671    2.7  46.5   31.2   1.7465   4.3 ------	UNKNOWN
308.4031  25.2698    3.5  35.1   -4.7   0.6036   3.3 ------	UNKNOWN
301.1025  35.2884    2.2  46.6   -8.9   1.3735   5.2 ------	UNKNOWN
302.7724 -31.4891    2.7  26.5 -141.8   0.6633   4.3 ------	UNKNOWN
291.5370 -20.2617    2.6  27.4 -108.2   0.8122   4.5 ------	UNKNOWN
278.0801 -49.1705    2.8  52.0 -138.9   3.2274   4.1 ------	UNKNOWN
Plot creation:
Sun May 31 15:32:27 EDT 2015