Special notes of this burst
Image
Pre-slew 15.0-350.0 keV image (Event data)
#   RAcent    DECcent   POSerr    Theta     Phi              Peak Cts       SNR   Name
  303.4871    34.3295   0.0114    44.9956   -15.7064         0.1468028     16.798 TRIG_00156838

Foreground time interval of the image:
 -0.036   0.068 (delta_t =   0.104 [sec])
Background time interval of the image:
-299.376  -0.036 (delta_t = 299.340 [sec])
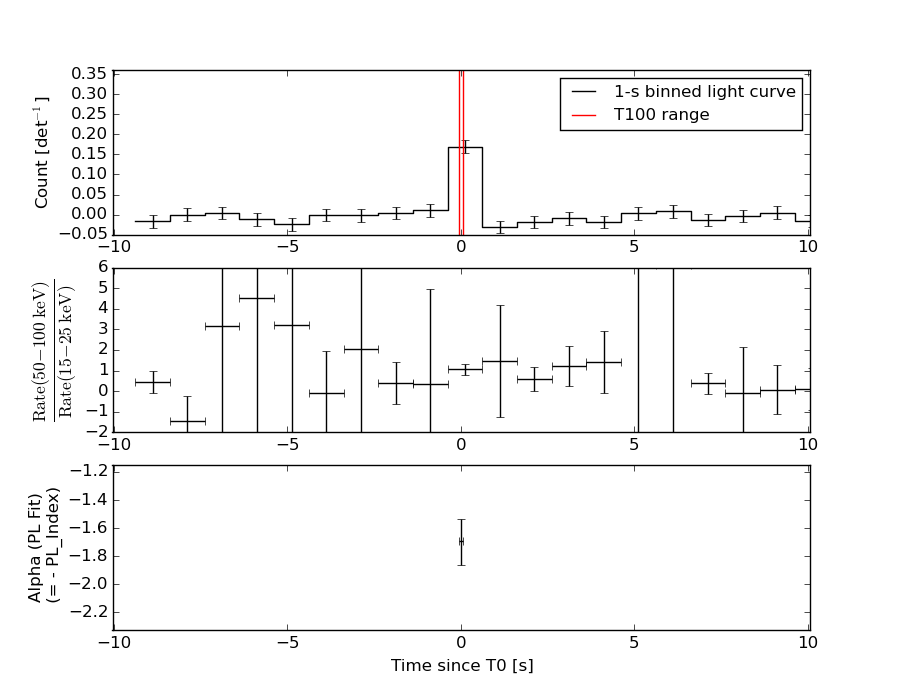
Lightcurves
Notes:
- 1) The mask-weighted light curves are using the flight position.
- 2) Multiple plots of different time binning/intervals are shown to cover all scenarios of short/long GRBs, rate/image triggers, and real/false positives.
- 3) For all the mask-weighted lightcurves, the y-axis units are counts/sec/det where a det is 0.4 x 0.4 = 0.16 sq cm.
- 4) The verticle lines correspond to following: green dotted lines are T50 interval, black dotted lines are T90 interval, blue solid line(s) is a spacecraft slew start time, and orange solid line(s) is a spacecraft slew end time.
- 5) Time of each bin is in the middle of the bin.
1 s binning
From T0-310 s to T0+310 s

From T100_start - 20 s to T100_end + 30 s
Full time interval
64 ms binning
Full time interval
From T100_start to T100_end
From T0-5 sec to T0+5 sec
16 ms binning
From T100_start-5 s to T100_start+5 s
Blue+Cyan dotted lines: Time interval of the scaled map
From 0.000000 to 0.064000
8 ms binning
From T100_start-3 s to T100_start+3 s
Blue+Cyan dotted lines: Time interval of the scaled map
From 0.000000 to 0.064000
2 ms binning
From T100_start-1 s to T100_start+1 s
Blue+Cyan dotted lines: Time interval of the scaled map
From 0.000000 to 0.064000
SN=5 or 10 sec. binning (whichever binning is satisfied first)
SN=5 or 10 sec. binning (T < 200 sec)
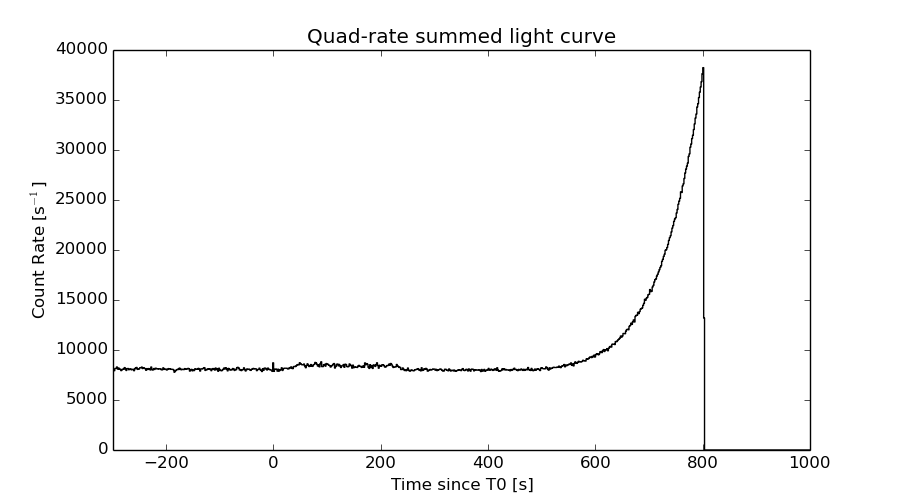
Quad-rate summed light curves (from T0-300s to T0+1000s)
Spectral Evolution
Spectra
Notes:
- 1) The fitting includes the systematic errors.
- 2) When the burst includes telescope slew time periods, the fitting uses an average response file made from multiple 5-s response files through out the slew time plus single time preiod for the non-slew times, and weighted by the total counts in the corresponding time period using addrmf. An average response file is needed becuase a spectral fit using the pre-slew DRM will introduce some errors in both a spectral shape and a normalization if the PHA file contains a lot of the slew/post-slew time interval.
- 3) For fits to more complicated models (e.g. a power-law over a cutoff power-law), the BAT team has decided to require a chi-square improvement of more than 6 for each extra dof.
Time averaged spectrum fit using the average DRM
Power-law model
Time interval is from   -0.036 sec. to    0.068 sec.

Spectral model in power-law:
------------------------------------------------------------
Parameters  : value       lower 90%   higher 90%
Photon index: 1.69462     ( -0.157896   0.165705 )
Norm@50keV  : 7.75132E-02    ( -0.00912239   0.00906176 )
------------------------------------------------------------
#Fit statistic : Chi-Squared =          87.31 using 59 PHA bins.
# Reduced chi-squared =          1.532 for     57 degrees of freedom
# Null hypothesis probability =   6.023477e-03

Photon flux (15-150 keV)    in 0.104 sec: 10.2752 ( -1.17787  1.17907 ) ph/cm2/s
Energy fluence (15-150 keV)             : 7.4673e-08 ( -9.0639e-09  9.08786e-09 ) ergs/cm2
Cutoff power-law model

Time interval is from   -0.036 sec. to    0.068 sec.
Spectral model in the cutoff power-law:
------------------------------------------------------------
Parameters  : value       lower 90%   higher 90%
Photon index: -0.110934     ( -0.94517   0.804274 )
Epeak [keV] : 63.8001      ( -8.01271 11.9385 )
Norm@50keV  : 0.575344    ( -0.332743   0.98903 )
------------------------------------------------------------
#Fit statistic : Chi-Squared =          70.77 using 59 PHA bins.
# Reduced chi-squared =          1.264 for     56 degrees of freedom
# Null hypothesis probability =   8.842928e-02

Photon flux (15-150 keV)    in 0.104 sec: 10.1455 ( -1.17833  1.1825 ) ph/cm2/s
Energy fluence (15-150 keV)             : 7.65087e-08 ( -9.25912e-09  9.29427e-09 ) ergs/cm2
Band function

Time interval is from   -0.036 sec. to    0.068 sec.

Spectral model in the Band function:
------------------------------------------------------------
Parameters  : value       lower 90%   higher 90%
alpha       : 0.112673   ( -0.765275   1.02274 )
beta        : -10.0000    ( 10   1.77636e-15 )
Epeak [keV] : 63.7569      ( -7.98596 11.9898 )
Norm@50keV   : 0.576826    ( -0.334159   0.989833 )
------------------------------------------------------------
#Fit statistic : Chi-Squared =          70.77 using 59 PHA bins.
# Reduced chi-squared =          1.287 for     55 degrees of freedom
# Null hypothesis probability =   7.463806e-02

Photon flux (15-150 keV)    in 0.104 sec: 10.2505 ( -3.2505  -1.13968 ) ph/cm2/s
Energy fluence (15-150 keV)             : 0 ( 0  0 ) ergs/cm2
Single BB
Spectral model blackbody:
------------------------------------------------------------
Parameters  : value    Lower 90%  Upper 90%
kT [keV]    : 15.4884  (-1.54966  1.65332)
R^2/D10^2   : 1.18664  (-0.369243   0.537036)
(R is the radius in km and D10 is the distance to the source in units of 10 kpc)
------------------------------------------------------------
#Fit statistic : Chi-Squared =          75.80 using 59 PHA bins.
# Reduced chi-squared =          1.330 for     57 degrees of freedom
# Null hypothesis probability =   4.857109e-02

Energy  Fluence     90% Error
[keV]   [erg/cm2]   [erg/cm2]
15- 25  6.163e-09   1.119e-09
25- 50  2.521e-08   3.401e-09
50-150  4.173e-08   7.862e-09
15-150  7.310e-08   1.006e-08
Thermal bremsstrahlung (OTTB)
Spectral model: thermal bremsstrahlung
------------------------------------------------------------
Parameters  : value         Lower 90%    Upper 90%
kT [keV]    : 144.822       (-45.2573      -137.712)
Norm        : 42.5427       (-5.41461     6.29253)
------------------------------------------------------------
#Fit statistic : Chi-Squared =          80.08 using 59 PHA bins.
# Reduced chi-squared =          1.405 for     57 degrees of freedom
# Null hypothesis probability =   2.361233e-02

Energy  Fluence     90% Error
[keV]   [erg/cm2]   [erg/cm2]
15- 25  1.140e-08   1.777e-09
25- 50  2.101e-08   5.356e-09
50-150  4.087e-08   2.024e-08
15-150  7.328e-08   2.176e-08
Double BB
Spectral model: bbodyrad<1> + bbodyrad<2>
------------------------------------------------------------
Parameters  : value         Lower 90%    Upper 90%
kT1 [keV]   : 2.38534        (-1.49354      4.92495)
R1^2/D10^2  : 1164.48        (-1197.07      1.45054e+07)
kT2 [keV]   : 16.5784        (-1.87064      2.98839)
R2^2/D10^2  : 0.884825    (-0.470272   0.384429)
------------------------------------------------------------
#Fit statistic : Chi-Squared =          67.50 using 59 PHA bins.
# Reduced chi-squared =          1.227 for     55 degrees of freedom
# Null hypothesis probability =   1.201864e-01

Energy  Fluence     90% Error
[keV]   [erg/cm2]   [erg/cm2]
15- 25  9.876e-09   3.458e-09
25- 50  2.276e-08   4.207e-09
50-150  4.375e-08   8.549e-09
15-150  7.639e-08   1.207e-08
Peak spectrum fit
Power-law model
Time interval is from   -0.482 sec. to    0.518 sec.

Spectral model in power-law:
------------------------------------------------------------
Parameters  : value       lower 90%   higher 90%
Photon index: 1.73306     ( -0.254822   0.268223 )
Norm@50keV  : 1.10761E-02    ( -0.00198423   0.00195628 )
------------------------------------------------------------
#Fit statistic : Chi-Squared =          49.69 using 59 PHA bins.
# Reduced chi-squared =         0.8717 for     57 degrees of freedom
# Null hypothesis probability =   7.432809e-01

Photon flux (15-150 keV)    in 1 sec: 1.48838 ( -0.247868  0.248317 ) ph/cm2/s
Energy fluence (15-150 keV)             : 1.02319e-07 ( -1.87138e-08  1.90145e-08 ) ergs/cm2
Cutoff power-law model

Time interval is from   -0.482 sec. to    0.518 sec.
Spectral model in the cutoff power-law:
------------------------------------------------------------
Parameters  : value       lower 90%   higher 90%
Photon index: 8.56650E-02     ( -1.60714   1.18194 )
Epeak [keV] : 55.0538      ( -11.4004 27.0858 )
Norm@50keV  : 8.18886E-02    ( -0.0818875   0.488718 )
------------------------------------------------------------
#Fit statistic : Chi-Squared =          43.46 using 59 PHA bins.
# Reduced chi-squared =         0.7761 for     56 degrees of freedom
# Null hypothesis probability =   8.892872e-01

Photon flux (15-150 keV)    in 1 sec: 1.42469 ( -0.25071  0.25186 ) ph/cm2/s
Energy fluence (15-150 keV)             : 9.45024e-08 ( -1.86922e-08  1.96356e-08 ) ergs/cm2
Band function
Time interval is from   -0.482 sec. to    0.518 sec.

Spectral model in the Band function:
------------------------------------------------------------
Parameters  : value       lower 90%   higher 90%
alpha       : -8.55185E-02   ( -1.40079   1.47436 )
beta        : -10.0000    ( 10   1.06581e-14 )
Epeak [keV] : 55.0431      ( -11.4011 27.0906 )
Norm@50keV   : 8.19132E-02    ( -0.0819127   0.491157 )
------------------------------------------------------------
#Fit statistic : Chi-Squared =          43.46 using 59 PHA bins.
# Reduced chi-squared =         0.7902 for     55 degrees of freedom
# Null hypothesis probability =   8.693781e-01

Photon flux (15-150 keV)    in 1 sec:  (    ) ph/cm2/s
Energy fluence (15-150 keV)             : 0 ( 0  0 ) ergs/cm2
Single BB
Spectral model blackbody:
------------------------------------------------------------
Parameters  : value    Lower 90%  Upper 90%
kT [keV]    : 13.0665  (-2.1115  2.47812)
R^2/D10^2   : 0.285812  (-0.135676   0.255779)
(R is the radius in km and D10 is the distance to the source in units of 10 kpc)
------------------------------------------------------------
#Fit statistic : Chi-Squared =          46.24 using 59 PHA bins.
# Reduced chi-squared =         0.8112 for     57 degrees of freedom
# Null hypothesis probability =   8.451752e-01

Energy  Fluence     90% Error
[keV]   [erg/cm2]   [erg/cm2]
15- 25  1.035e-08   3.057e-09
25- 50  3.584e-08   1.052e-08
50-150  3.880e-08   1.263e-08
15-150  8.499e-08   2.064e-08
Thermal bremsstrahlung (OTTB)
Spectral model: thermal bremsstrahlung
------------------------------------------------------------
Parameters  : value         Lower 90%    Upper 90%
kT [keV]    : 116.060       (-47.0272      -111.87)
Norm        : 6.39806       (-1.20163     1.64461)
------------------------------------------------------------
#Fit statistic : Chi-Squared =          46.36 using 59 PHA bins.
# Reduced chi-squared =         0.8133 for     57 degrees of freedom
# Null hypothesis probability =   8.421409e-01

Energy  Fluence     90% Error
[keV]   [erg/cm2]   [erg/cm2]
15- 25  1.669e-08   5.216e-09
25- 50  2.967e-08   1.209e-08
50-150  5.208e-08   3.443e-08
15-150  9.844e-08   5.265e-08
Double BB
Spectral model: bbodyrad<1> + bbodyrad<2>
------------------------------------------------------------
Parameters  : value         Lower 90%    Upper 90%
kT1 [keV]   : 6.39659        (-4.19945      24.3862)
R1^2/D10^2  : 1.61897        (-1.50584      126.121)
kT2 [keV]   : 17.0877        (-4.60019      31.7016)
R2^2/D10^2  : 8.34193E-02    (-0.0834579   0.241253)
------------------------------------------------------------
#Fit statistic : Chi-Squared =          43.02 using 59 PHA bins.
# Reduced chi-squared =         0.7821 for     55 degrees of freedom
# Null hypothesis probability =   8.796546e-01

Energy  Fluence     90% Error
[keV]   [erg/cm2]   [erg/cm2]
15- 25  1.455e-08   8.175e-09
25- 50  3.297e-08   1.677e-08
50-150  4.725e-08   2.863e-08
15-150  9.477e-08   4.926e-08
Pre-slew spectrum (Pre-slew PHA with pre-slew DRM)
Power-law model

Spectral model in power-law:
------------------------------------------------------------
Parameters  : value       lower 90%   higher 90%
Photon index: 1.69462     ( -0.157896   0.165705 )
Norm@50keV  : 7.75132E-02    ( -0.00912239   0.00906176 )
------------------------------------------------------------
#Fit statistic : Chi-Squared =          87.31 using 59 PHA bins.
# Reduced chi-squared =          1.532 for     57 degrees of freedom
# Null hypothesis probability =   6.023477e-03

Photon flux (15-150 keV)    in 0.104 sec: 10.2752 ( -1.17787  1.17907 ) ph/cm2/s
Energy fluence (15-150 keV)             : 7.4673e-08 ( -9.0639e-09  9.08786e-09 ) ergs/cm2
Cutoff power-law model
Spectral model in the cutoff power-law:
------------------------------------------------------------
Parameters  : value       lower 90%   higher 90%
Photon index: -0.110934     ( -0.94517   0.804274 )
Epeak [keV] : 63.8001      ( -8.01271 11.9385 )
Norm@50keV  : 0.575344    ( -0.332743   0.98903 )
------------------------------------------------------------
#Fit statistic : Chi-Squared =          70.77 using 59 PHA bins.
# Reduced chi-squared =          1.264 for     56 degrees of freedom
# Null hypothesis probability =   8.842928e-02

Photon flux (15-150 keV)    in 0.104 sec: 10.1455 ( -1.17833  1.1825 ) ph/cm2/s
Energy fluence (15-150 keV)             : 7.65087e-08 ( -9.25912e-09  9.29427e-09 ) ergs/cm2
Band function

Spectral model in the Band function:
------------------------------------------------------------
Parameters  : value       lower 90%   higher 90%
alpha       : 0.112673   ( -0.765275   1.02274 )
beta        : -10.0000    ( 10   3.55271e-15 )
Epeak [keV] : 63.7569      ( -7.98596 11.9898 )
Norm@50keV   : 0.576826    ( -0.334159   0.989833 )
------------------------------------------------------------
#Fit statistic : Chi-Squared =          70.77 using 59 PHA bins.
# Reduced chi-squared =          1.287 for     55 degrees of freedom
# Null hypothesis probability =   7.463806e-02

Photon flux (15-150 keV)    in 0.104 sec: 10.2505 ( -3.2505  -1.13968 ) ph/cm2/s
Energy fluence (15-150 keV)             : 0 ( 0  0 ) ergs/cm2
S(25-50 keV) vs. S(50-100 keV) plot
S(25-50 keV)  = 2.02e-08
S(50-100 keV) = 2.49e-08
T90 vs. Hardness ratio plot
T90                                   = 0.0920000076293945 sec.
Hardness ratio (energy fluence ratio) = 1.23267
Color vs. Color plot
Count Ratio  (25-50 keV) / (15-25 keV) = 1.67379
Count Ratio (50-100 keV) / (15-25 keV) = 1.52053
Mask shadow pattern
IMX = 9.625137830726542E-01, IMY = 2.706669988381329E-01
TIME vs. PHA plot around the trigger time
Blue+Cyan dotted lines: Time interval of the scaled map
From 0.000000 to 0.064000
TIME vs. DetID plot around the trigger time
Blue+Cyan dotted lines: Time interval of the scaled map
From 0.000000 to 0.064000
100 us light curve (15-350 keV)
Blue+Cyan dotted lines: Time interval of the scaled map
From 0.000000 to 0.064000
Spacecraft aspect plot
Bright source in the pre-burst/pre-slew/post-slew images
Pre-burst image of 15-350 keV band
Time interval of the image:
-299.376000 -0.036000

# RAcent  DECcent POSerr Theta    Phi  PeakCts   SNR AngSep     Name
#  [deg]    [deg]    ['] [deg]  [deg]                   [']
275.7787 -30.4459    9.9  44.4 -124.6  -0.8136  -1.2    8.9	H1820-303
285.0650 -24.9642    7.1  34.8 -121.3   0.5215   1.6    3.1	HT1900.1-2455
288.9102  11.0917    3.7  34.5  -55.0   0.9664   3.2   11.0	GRS 1915+105
299.5878  35.2084    0.4  47.0  -19.4  10.9058  29.2    0.4	Cyg X-1
308.2357  40.8451   57.1  50.3   -8.4   0.0925   0.2    8.6	Cyg X-3
326.1686  38.3077    3.8  47.7    9.9   1.3954   3.1    0.8	Cyg X-2
327.4683  40.5951    2.5  50.2   10.5   2.6116   4.6 ------	UNKNOWN
319.6869  48.3236    2.9  57.1    2.4   4.4707   3.9 ------	UNKNOWN
Pre-slew background subtracted image of 15-350 keV band
Time interval of the image:
-0.036000 0.068000

# RAcent  DECcent POSerr Theta    Phi  PeakCts   SNR AngSep     Name
#  [deg]    [deg]    ['] [deg]  [deg]                   [']
276.0435 -30.3004    4.5  44.2 -124.5   0.0347   2.6    7.3	H1820-303
285.0385 -25.0143    9.3  34.8 -121.4   0.0092   1.2    5.6	HT1900.1-2455
288.9379  10.8669   12.2  34.4  -55.3   0.0061   0.9    9.5	GRS 1915+105
299.7223  35.1844   12.8  46.9  -19.3   0.0084   0.9    6.6	Cyg X-1
307.9814  40.9475    4.2  50.4   -8.6   0.0304   2.7    5.8	Cyg X-3
326.0377  38.3722    6.8  47.8    9.7  -0.0202  -1.7    7.0	Cyg X-2
354.4076 -10.4088    2.2  36.6   96.3   0.0531   5.2 ------	UNKNOWN
303.4871  34.3295    0.7  45.0  -15.7   0.1468  16.8 ------	UNKNOWN
Post-slew image of 15-350 keV band
Time interval of the image:
75.124600 176.724600

# RAcent  DECcent POSerr Theta    Phi  PeakCts   SNR AngSep     Name
#  [deg]    [deg]    ['] [deg]  [deg]                   [']
254.3055  35.2023    0.0  40.0  -92.3   0.1390   0.3   11.2	Her X-1
268.2516  -1.3613   31.1  48.6 -147.8  -0.0995  -0.4    8.9	SW J1753.5-0127
274.0226 -14.0449    9.5  55.9 -162.9   0.4417   1.2    1.1	GX 17+2
288.7702  11.1049  367.0  26.8 -164.5   0.0036   0.0    9.7	GRS 1915+105
299.5831  35.2012    0.3   3.3  -92.1   3.9193  40.5    0.4	Cyg X-1
308.1393  40.9623    2.2   7.6    9.6   0.5074   5.2    1.4	Cyg X-3
326.0795  38.3577    4.8  18.6   52.9   0.2752   2.4    4.8	Cyg X-2
241.7101  61.4995    2.3  47.0  -53.2   2.5103   5.0 ------	UNKNOWN
Plot creation:
Sun May 31 15:30:55 EDT 2015