Special notes of this burst
Image
Pre-slew 15.0-350.0 keV image (Event data)
#   RAcent    DECcent   POSerr    Theta     Phi              Peak Cts       SNR   Name
  202.8656    42.0997   0.0040    44.0309   -28.6781         6.9821156     48.430 TRIG_00158855

Foreground time interval of the image:
-24.932  13.332 (delta_t =  38.264 [sec])
Background time interval of the image:
-299.088 -24.932 (delta_t = 274.156 [sec])
Lightcurves
Notes:
- 1) The mask-weighted light curves are using the flight position.
- 2) Multiple plots of different time binning/intervals are shown to cover all scenarios of short/long GRBs, rate/image triggers, and real/false positives.
- 3) For all the mask-weighted lightcurves, the y-axis units are counts/sec/det where a det is 0.4 x 0.4 = 0.16 sq cm.
- 4) The verticle lines correspond to following: green dotted lines are T50 interval, black dotted lines are T90 interval, blue solid line(s) is a spacecraft slew start time, and orange solid line(s) is a spacecraft slew end time.
- 5) Time of each bin is in the middle of the bin.
1 s binning
From T0-310 s to T0+310 s
From T100_start - 20 s to T100_end + 30 s
Full time interval
64 ms binning
Full time interval
From T100_start to T100_end
From T0-5 sec to T0+5 sec
16 ms binning
From T100_start-5 s to T100_start+5 s
Blue+Cyan dotted lines: Time interval of the scaled map
From 0.000000 to 1.024000
8 ms binning
From T100_start-3 s to T100_start+3 s
Blue+Cyan dotted lines: Time interval of the scaled map
From 0.000000 to 1.024000
2 ms binning
From T100_start-1 s to T100_start+1 s
Blue+Cyan dotted lines: Time interval of the scaled map
From 0.000000 to 1.024000
SN=5 or 10 sec. binning (whichever binning is satisfied first)
SN=5 or 10 sec. binning (T < 200 sec)

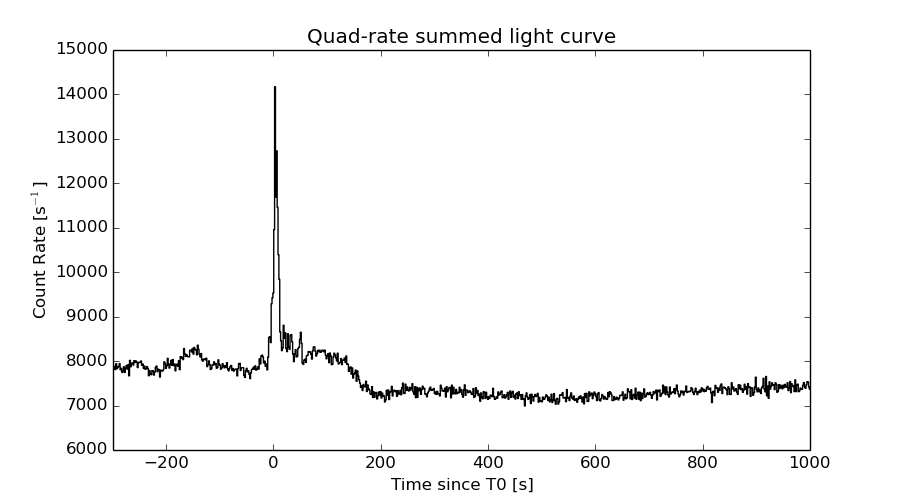
Quad-rate summed light curves (from T0-300s to T0+1000s)
Spectral Evolution

Spectra
Notes:
- 1) The fitting includes the systematic errors.
- 2) When the burst includes telescope slew time periods, the fitting uses an average response file made from multiple 5-s response files through out the slew time plus single time preiod for the non-slew times, and weighted by the total counts in the corresponding time period using addrmf. An average response file is needed becuase a spectral fit using the pre-slew DRM will introduce some errors in both a spectral shape and a normalization if the PHA file contains a lot of the slew/post-slew time interval.
- 3) For fits to more complicated models (e.g. a power-law over a cutoff power-law), the BAT team has decided to require a chi-square improvement of more than 6 for each extra dof.
Time averaged spectrum fit using the average DRM
Power-law model

Time interval is from  -24.932 sec. to   13.332 sec.

Spectral model in power-law:
------------------------------------------------------------
Parameters  : value       lower 90%   higher 90%
Photon index: 1.11750     ( -0.0514033   0.0509945 )
Norm@50keV  : 1.29197E-02    ( -0.000378374   0.000377305 )
------------------------------------------------------------
#Fit statistic : Chi-Squared =          61.45 using 59 PHA bins.
# Reduced chi-squared =          1.078 for     57 degrees of freedom
# Null hypothesis probability =   3.196470e-01

Photon flux (15-150 keV)    in 38.26 sec: 1.50124 ( -0.0470437  0.0472011 ) ph/cm2/s
Energy fluence (15-150 keV)             : 5.13962e-06 ( -1.45976e-07  1.46034e-07 ) ergs/cm2
Cutoff power-law model

Time interval is from  -24.932 sec. to   13.332 sec.
Spectral model in the cutoff power-law:
------------------------------------------------------------
Parameters  : value       lower 90%   higher 90%
Photon index: 0.748953     ( -0.220239   0.209759 )
Epeak [keV] : 212.094      ( -55.7589 184.77 )
Norm@50keV  : 1.81892E-02    ( -0.00314466   0.0039716 )
------------------------------------------------------------
#Fit statistic : Chi-Squared =          52.17 using 59 PHA bins.
# Reduced chi-squared =         0.9315 for     56 degrees of freedom
# Null hypothesis probability =   6.207718e-01

Photon flux (15-150 keV)    in 38.26 sec: 1.46637 ( -0.05033  0.05059 ) ph/cm2/s
Energy fluence (15-150 keV)             : 5.08185e-06 ( -1.51471e-07  1.51127e-07 ) ergs/cm2
Band function
Time interval is from  -24.932 sec. to   13.332 sec.

Spectral model in the Band function:
------------------------------------------------------------
Parameters  : value       lower 90%   higher 90%
alpha       : -0.749058   ( -0.22646   0.194107 )
beta        : -10.0000    ( 10   1.77636e-15 )
Epeak [keV] : 212.115      ( -55.8291 184.651 )
Norm@50keV   : 1.81863E-02    ( -0.00314295   0.00397464 )
------------------------------------------------------------
#Fit statistic : Chi-Squared =          52.17 using 59 PHA bins.
# Reduced chi-squared =         0.9485 for     55 degrees of freedom
# Null hypothesis probability =   5.836019e-01

Photon flux (15-150 keV)    in 38.26 sec:  (    ) ph/cm2/s
Energy fluence (15-150 keV)             : 0 ( 0  0 ) ergs/cm2
Single BB
Spectral model blackbody:
------------------------------------------------------------
Parameters  : value    Lower 90%  Upper 90%
kT [keV]    : 23.0118  (  )
R^2/D10^2   : 4.47376E-02  (   )
(R is the radius in km and D10 is the distance to the source in units of 10 kpc)
------------------------------------------------------------
#Fit statistic : Chi-Squared =         219.15 using 59 PHA bins.
# Reduced chi-squared =         3.8447 for     57 degrees of freedom
# Null hypothesis probability =   7.412840e-21

Energy  Fluence     90% Error
[keV]   [erg/cm2]   [erg/cm2]
15- 25  1.642e-07   9.508e-09
25- 50  8.912e-07   3.749e-08
50-150  3.525e-06   1.429e-07
15-150  4.581e-06   1.435e-07
Thermal bremsstrahlung (OTTB)

Spectral model: thermal bremsstrahlung
------------------------------------------------------------
Parameters  : value         Lower 90%    Upper 90%
kT [keV]    : 199.363       (      )
Norm        : 6.58207       (     )
------------------------------------------------------------
#Fit statistic : Chi-Squared =         288.81 using 59 PHA bins.
# Reduced chi-squared =         5.0669 for     57 degrees of freedom
# Null hypothesis probability =   1.014095e-32

Energy  Fluence     90% Error
[keV]   [erg/cm2]   [erg/cm2]
15- 25  6.271e-07   1.970e-08
25- 50  1.206e-06   3.730e-08
50-150  2.646e-06   8.322e-08
15-150  4.479e-06   1.473e-07
Double BB

Spectral model: bbodyrad<1> + bbodyrad<2>
------------------------------------------------------------
Parameters  : value         Lower 90%    Upper 90%
kT1 [keV]   : 7.95842        (-0.970686      1.09661)
R1^2/D10^2  : 0.695723        (-0.239657      0.395922)
kT2 [keV]   : 31.8208        (-2.41418      3.10606)
R2^2/D10^2  : 1.38491E-02    (-0.00372449   0.00427941)
------------------------------------------------------------
#Fit statistic : Chi-Squared =          44.99 using 59 PHA bins.
# Reduced chi-squared =         0.8180 for     55 degrees of freedom
# Null hypothesis probability =   8.301718e-01

Energy  Fluence     90% Error
[keV]   [erg/cm2]   [erg/cm2]
15- 25  3.846e-07   5.299e-08
25- 50  1.037e-06   8.207e-08
50-150  3.698e-06   2.242e-07
15-150  5.120e-06   3.023e-07
Peak spectrum fit
Power-law model

Time interval is from    2.880 sec. to    3.880 sec.

Spectral model in power-law:
------------------------------------------------------------
Parameters  : value       lower 90%   higher 90%
Photon index: 1.04472     ( -0.108227   0.10689 )
Norm@50keV  : 4.72949E-02    ( -0.00288214   0.00287359 )
------------------------------------------------------------
#Fit statistic : Chi-Squared =          60.49 using 59 PHA bins.
# Reduced chi-squared =          1.061 for     57 degrees of freedom
# Null hypothesis probability =   3.510616e-01

Photon flux (15-150 keV)    in 1 sec: 5.46027 ( -0.343314  0.344259 ) ph/cm2/s
Energy fluence (15-150 keV)             : 5.0356e-07 ( -3.20887e-08  3.2159e-08 ) ergs/cm2
Cutoff power-law model

Time interval is from    2.880 sec. to    3.880 sec.
Spectral model in the cutoff power-law:
------------------------------------------------------------
Parameters  : value       lower 90%   higher 90%
Photon index: 0.849989     ( -0.423304   0.244452 )
Epeak [keV] : 358.864      ( -358.862 -358.862 )
Norm@50keV  : 5.71162E-02    ( -0.0119632   0.0274724 )
------------------------------------------------------------
#Fit statistic : Chi-Squared =          59.77 using 59 PHA bins.
# Reduced chi-squared =          1.067 for     56 degrees of freedom
# Null hypothesis probability =   3.405402e-01

Photon flux (15-150 keV)    in 1 sec: 5.40964 ( -0.3569  0.35798 ) ph/cm2/s
Energy fluence (15-150 keV)             : 5.0083e-07 ( -3.299e-08  3.2857e-08 ) ergs/cm2
Band function

Time interval is from    2.880 sec. to    3.880 sec.

Spectral model in the Band function:
------------------------------------------------------------
Parameters  : value       lower 90%   higher 90%
alpha       : -0.862948   ( 0.154374   0.154374 )
beta        : -8.98260    ( 8.39239   18.3924 )
Epeak [keV] : 381.528      ( -226.015 -381.528 )
Norm@50keV   : 5.63719E-02    ( -0.00334662   0.0237605 )
------------------------------------------------------------
#Fit statistic : Chi-Squared =          59.77 using 59 PHA bins.
# Reduced chi-squared =          1.087 for     55 degrees of freedom
# Null hypothesis probability =   3.065958e-01

Photon flux (15-150 keV)    in 1 sec:  (    ) ph/cm2/s
Energy fluence (15-150 keV)             : 0 ( 0  0 ) ergs/cm2
Single BB

Spectral model blackbody:
------------------------------------------------------------
Parameters  : value    Lower 90%  Upper 90%
kT [keV]    : 23.6383  (-1.93047  2.16276)
R^2/D10^2   : 0.153946  (-0.0366628   0.0472233)
(R is the radius in km and D10 is the distance to the source in units of 10 kpc)
------------------------------------------------------------
#Fit statistic : Chi-Squared =         107.97 using 59 PHA bins.
# Reduced chi-squared =         1.8942 for     57 degrees of freedom
# Null hypothesis probability =   5.346328e-05

Energy  Fluence     90% Error
[keV]   [erg/cm2]   [erg/cm2]
15- 25  1.538e-08   1.880e-09
25- 50  8.472e-08   8.690e-09
50-150  3.531e-07   3.020e-08
15-150  4.532e-07   3.530e-08
Thermal bremsstrahlung (OTTB)

Spectral model: thermal bremsstrahlung
------------------------------------------------------------
Parameters  : value         Lower 90%    Upper 90%
kT [keV]    : 199.359       (      )
Norm        : 22.8095       (     )
------------------------------------------------------------
#Fit statistic : Chi-Squared =         124.29 using 59 PHA bins.
# Reduced chi-squared =         2.1805 for     57 degrees of freedom
# Null hypothesis probability =   6.547005e-07

Energy  Fluence     90% Error
[keV]   [erg/cm2]   [erg/cm2]
15- 25  5.680e-08   3.975e-09
25- 50  1.093e-07   9.045e-09
50-150  2.396e-07   5.955e-08
15-150  4.057e-07   5.825e-08
Double BB

Spectral model: bbodyrad<1> + bbodyrad<2>
------------------------------------------------------------
Parameters  : value         Lower 90%    Upper 90%
kT1 [keV]   : 7.37741        (-1.44618      1.75933)
R1^2/D10^2  : 3.38586        (-1.73855      4.04931)
kT2 [keV]   : 33.6201        (-4.57487      6.84441)
R2^2/D10^2  : 4.57568E-02    (-0.0199135   0.0272512)
------------------------------------------------------------
#Fit statistic : Chi-Squared =          54.23 using 59 PHA bins.
# Reduced chi-squared =         0.9860 for     55 degrees of freedom
# Null hypothesis probability =   5.039126e-01

Energy  Fluence     90% Error
[keV]   [erg/cm2]   [erg/cm2]
15- 25  3.868e-08   1.210e-08
25- 50  9.564e-08   2.198e-08
50-150  3.765e-07   8.890e-08
15-150  5.108e-07   8.730e-08
Pre-slew spectrum (Pre-slew PHA with pre-slew DRM)
Power-law model

Spectral model in power-law:
------------------------------------------------------------
Parameters  : value       lower 90%   higher 90%
Photon index: 1.11750     ( -0.0514033   0.0509945 )
Norm@50keV  : 1.29197E-02    ( -0.000378374   0.000377305 )
------------------------------------------------------------
#Fit statistic : Chi-Squared =          61.45 using 59 PHA bins.
# Reduced chi-squared =          1.078 for     57 degrees of freedom
# Null hypothesis probability =   3.196470e-01

Photon flux (15-150 keV)    in 38.26 sec: 1.50124 ( -0.0470437  0.0472011 ) ph/cm2/s
Energy fluence (15-150 keV)             : 5.13962e-06 ( -1.45976e-07  1.46034e-07 ) ergs/cm2
Cutoff power-law model

Spectral model in the cutoff power-law:
------------------------------------------------------------
Parameters  : value       lower 90%   higher 90%
Photon index: 0.748953     ( -0.220239   0.209759 )
Epeak [keV] : 212.094      ( -55.7589 184.77 )
Norm@50keV  : 1.81892E-02    ( -0.00314466   0.0039716 )
------------------------------------------------------------
#Fit statistic : Chi-Squared =          52.17 using 59 PHA bins.
# Reduced chi-squared =         0.9315 for     56 degrees of freedom
# Null hypothesis probability =   6.207718e-01

Photon flux (15-150 keV)    in 38.26 sec: 1.46637 ( -0.05033  0.05059 ) ph/cm2/s
Energy fluence (15-150 keV)             : 5.08185e-06 ( -1.51471e-07  1.51127e-07 ) ergs/cm2
Band function

Spectral model in the Band function:
------------------------------------------------------------
Parameters  : value       lower 90%   higher 90%
alpha       : -0.749058   ( -0.22646   0.194107 )
beta        : -10.0000    ( 10   3.55271e-15 )
Epeak [keV] : 212.115      ( -55.8291 184.651 )
Norm@50keV   : 1.81863E-02    ( -0.00314295   0.00397464 )
------------------------------------------------------------
#Fit statistic : Chi-Squared =          52.17 using 59 PHA bins.
# Reduced chi-squared =         0.9485 for     55 degrees of freedom
# Null hypothesis probability =   5.836019e-01

Photon flux (15-150 keV)    in 38.26 sec:  (    ) ph/cm2/s
Energy fluence (15-150 keV)             : 0 ( 0  0 ) ergs/cm2
S(25-50 keV) vs. S(50-100 keV) plot

S(25-50 keV)  = 1.03e-06
S(50-100 keV) = 1.89e-06
T90 vs. Hardness ratio plot

T90                                   = 12.4079999923706 sec.
Hardness ratio (energy fluence ratio) = 1.83495
Color vs. Color plot

Count Ratio  (25-50 keV) / (15-25 keV) = 1.90878
Count Ratio (50-100 keV) / (15-25 keV) = 2.1858
Mask shadow pattern
IMX = 8.481412304303927E-01, IMY = 4.639230038776114E-01
TIME vs. PHA plot around the trigger time

Blue+Cyan dotted lines: Time interval of the scaled map
From 0.000000 to 1.024000
TIME vs. DetID plot around the trigger time
Blue+Cyan dotted lines: Time interval of the scaled map
From 0.000000 to 1.024000
100 us light curve (15-350 keV)

Blue+Cyan dotted lines: Time interval of the scaled map
From 0.000000 to 1.024000
Spacecraft aspect plot

Bright source in the pre-burst/pre-slew/post-slew images
Pre-burst image of 15-350 keV band
Time interval of the image:
-299.088000 -24.932000

# RAcent  DECcent POSerr Theta    Phi  PeakCts   SNR AngSep     Name
#  [deg]    [deg]    ['] [deg]  [deg]                   [']
244.9802 -15.6392    0.1  27.5  177.5  25.1842  90.5    0.1	Sco X-1
254.4615  35.3184    3.2  27.9   38.1   1.1619   3.7    1.5	Her X-1
255.9042 -38.0112   12.1  51.7  173.2   0.7525   1.0   10.8	4U 1700-377
256.3464 -36.5752   66.0  50.5  172.1   0.1349   0.2   10.1	GX 349+2
263.1369 -24.7344    7.9  43.0  157.1   0.8986   1.5    7.0	GX 1+4
268.3958  -1.4438    7.2  31.9  121.8   0.7235   1.6    1.7	SW J1753.5-0127
270.4191 -25.1791    0.0  47.6  150.4  -1.3832  -1.5    9.5	GX 5-1
270.2909 -25.8999    5.1  48.1  151.2  -2.0530  -2.2    9.4	GRS 1758-258
273.9245 -14.1036    4.6  43.0  135.5   2.2969   2.5    6.2	GX 17+2
263.1154 -33.8635    6.0  50.6  164.1  -1.7314  -1.9    6.5	GX 354-0
279.6357  18.4385    2.5  39.9   84.9   5.0200   4.7 ------	UNKNOWN
276.7239  47.6749    2.1  48.3   43.8   6.2973   5.4 ------	UNKNOWN
221.8263  63.6156    2.6  53.8    0.9   3.7604   4.4 ------	UNKNOWN
212.4550 -36.6079    3.6  53.9 -143.5   4.9684   3.2 ------	UNKNOWN
211.9246 -36.5224    4.2  54.1 -143.0   4.2603   2.8 ------	UNKNOWN
Pre-slew background subtracted image of 15-350 keV band
Time interval of the image:
-24.932000 13.332000

# RAcent  DECcent POSerr Theta    Phi  PeakCts   SNR AngSep     Name
#  [deg]    [deg]    ['] [deg]  [deg]                   [']
244.9546 -15.6544    1.1  27.5  177.6  -0.8737 -10.9    1.7	Sco X-1
254.5245  35.4865    8.1  28.1   38.0   0.1344   1.4    9.2	Her X-1
255.9854 -37.8458   28.4  51.6  173.0  -0.0908  -0.4    0.1	4U 1700-377
256.4372 -36.4246    7.7  50.4  171.9   0.3009   1.5    0.1	GX 349+2
263.1358 -24.7962   42.2  43.1  157.2   0.0415   0.3    7.5	GX 1+4
268.4735  -1.5144   21.1  32.0  121.8   0.0673   0.5    7.3	SW J1753.5-0127
270.1491 -24.9791    0.0  47.3  150.5  -0.5339  -2.5    9.5	GX 5-1
270.4245 -25.6858   10.8  48.0  150.9   0.2441   1.1    7.4	GRS 1758-258
274.1416 -14.0478    7.9  43.1  135.3   0.3212   1.5    7.9	GX 17+2
263.0939 -33.7222    4.9  50.5  164.0  -0.5100  -2.3    8.5	GX 354-0
202.8656  42.0997    0.2  44.0  -28.7   6.9816  48.4 ------	UNKNOWN
Post-slew image of 15-350 keV band
Time interval of the image:
Plot creation:
Sun May 31 15:24:51 EDT 2015