Special notes of this burst
Image
Pre-slew 15.0-350.0 keV image (Event data)

#   RAcent    DECcent   POSerr    Theta     Phi              Peak Cts       SNR   Name
  122.8110   -18.3000   0.0163    49.2965     9.1424         1.3786934     11.828 TRIG_00159913

Foreground time interval of the image:
 -0.136  22.864 (delta_t =  23.000 [sec])
Background time interval of the image:
-299.136  -0.136 (delta_t = 299.000 [sec])
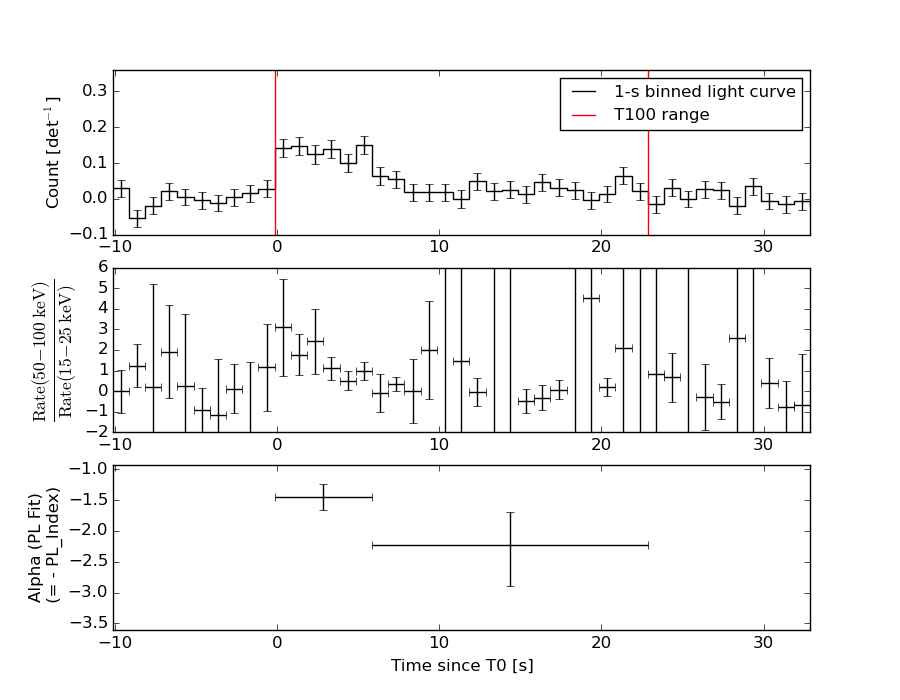
Lightcurves
Notes:
- 1) The mask-weighted light curves are using the flight position.
- 2) Multiple plots of different time binning/intervals are shown to cover all scenarios of short/long GRBs, rate/image triggers, and real/false positives.
- 3) For all the mask-weighted lightcurves, the y-axis units are counts/sec/det where a det is 0.4 x 0.4 = 0.16 sq cm.
- 4) The verticle lines correspond to following: green dotted lines are T50 interval, black dotted lines are T90 interval, blue solid line(s) is a spacecraft slew start time, and orange solid line(s) is a spacecraft slew end time.
- 5) Time of each bin is in the middle of the bin.
1 s binning
From T0-310 s to T0+310 s

From T100_start - 20 s to T100_end + 30 s
Full time interval

64 ms binning
Full time interval
From T100_start to T100_end
From T0-5 sec to T0+5 sec

16 ms binning
From T100_start-5 s to T100_start+5 s

Blue+Cyan dotted lines: Time interval of the scaled map
From 0.000000 to 4.096000
8 ms binning
From T100_start-3 s to T100_start+3 s
Blue+Cyan dotted lines: Time interval of the scaled map
From 0.000000 to 4.096000
2 ms binning
From T100_start-1 s to T100_start+1 s
Blue+Cyan dotted lines: Time interval of the scaled map
From 0.000000 to 4.096000
SN=5 or 10 sec. binning (whichever binning is satisfied first)
SN=5 or 10 sec. binning (T < 200 sec)
Quad-rate summed light curves (from T0-300s to T0+1000s)

Spectral Evolution
Spectra
Notes:
- 1) The fitting includes the systematic errors.
- 2) When the burst includes telescope slew time periods, the fitting uses an average response file made from multiple 5-s response files through out the slew time plus single time preiod for the non-slew times, and weighted by the total counts in the corresponding time period using addrmf. An average response file is needed becuase a spectral fit using the pre-slew DRM will introduce some errors in both a spectral shape and a normalization if the PHA file contains a lot of the slew/post-slew time interval.
- 3) For fits to more complicated models (e.g. a power-law over a cutoff power-law), the BAT team has decided to require a chi-square improvement of more than 6 for each extra dof.
Time averaged spectrum fit using the average DRM
Power-law model

Time interval is from   -0.136 sec. to   22.864 sec.

Spectral model in power-law:
------------------------------------------------------------
Parameters  : value       lower 90%   higher 90%
Photon index: 1.74139     ( -0.244267   0.253292 )
Norm@50keV  : 3.95786E-03    ( -0.000601214   0.000592003 )
------------------------------------------------------------
#Fit statistic : Chi-Squared =          61.25 using 59 PHA bins.
# Reduced chi-squared =          1.075 for     57 degrees of freedom
# Null hypothesis probability =   3.259861e-01

Photon flux (15-150 keV)    in 23 sec: 0.533479 ( -0.0782926  0.0785101 ) ph/cm2/s
Energy fluence (15-150 keV)             : 8.40404e-07 ( -1.30605e-07  1.31764e-07 ) ergs/cm2
Cutoff power-law model

Time interval is from   -0.136 sec. to   22.864 sec.
Spectral model in the cutoff power-law:
------------------------------------------------------------
Parameters  : value       lower 90%   higher 90%
Photon index: 1.47048     ( -1.15599   0.699778 )
Epeak [keV] : 95.5582      (   )
Norm@50keV  : 5.47603E-03    (     )
------------------------------------------------------------
#Fit statistic : Chi-Squared =          61.03 using 59 PHA bins.
# Reduced chi-squared =          1.090 for     56 degrees of freedom
# Null hypothesis probability =   2.998826e-01

Photon flux (15-150 keV)    in 23 sec: 0.528085 ( -0.080938  0.080697 ) ph/cm2/s
Energy fluence (15-150 keV)             : 8.27064e-07 ( -1.41441e-07  1.3975e-07 ) ergs/cm2
Band function

Time interval is from   -0.136 sec. to   22.864 sec.

Spectral model in the Band function:
------------------------------------------------------------
Parameters  : value       lower 90%   higher 90%
alpha       : 4.97725   ( -4.97725   -4.97725 )
beta        : -1.77858    ( -0.281155   0.258425 )
Epeak [keV] : 20.4406      ( -20.4406 8.29237 )
Norm@50keV   : 1789.25    ( -253.148   3.72504e+06 )
------------------------------------------------------------
#Fit statistic : Chi-Squared =          60.89 using 59 PHA bins.
# Reduced chi-squared =          1.107 for     55 degrees of freedom
# Null hypothesis probability =   2.722782e-01

Photon flux (15-150 keV)    in 23 sec:  (    ) ph/cm2/s
Energy fluence (15-150 keV)             : 0 ( 0  0 ) ergs/cm2
Single BB
Spectral model blackbody:
------------------------------------------------------------
Parameters  : value    Lower 90%  Upper 90%
kT [keV]    : 13.2875  (-2.20744  2.62597)
R^2/D10^2   : 8.92950E-02  (-0.043419   0.084986)
(R is the radius in km and D10 is the distance to the source in units of 10 kpc)
------------------------------------------------------------
#Fit statistic : Chi-Squared =          73.29 using 59 PHA bins.
# Reduced chi-squared =          1.286 for     57 degrees of freedom
# Null hypothesis probability =   7.188359e-02

Energy  Fluence     90% Error
[keV]   [erg/cm2]   [erg/cm2]
15- 25  7.686e-08   1.932e-08
25- 50  2.710e-07   6.133e-08
50-150  3.063e-07   9.046e-08
15-150  6.541e-07   1.266e-07
Thermal bremsstrahlung (OTTB)

Spectral model: thermal bremsstrahlung
------------------------------------------------------------
Parameters  : value         Lower 90%    Upper 90%
kT [keV]    : 99.9928       (-38.5652      -109.363)
Norm        : 2.38279       (-0.470608     0.459966)
------------------------------------------------------------
#Fit statistic : Chi-Squared =          61.48 using 59 PHA bins.
# Reduced chi-squared =          1.079 for     57 degrees of freedom
# Null hypothesis probability =   3.186647e-01

Energy  Fluence     90% Error
[keV]   [erg/cm2]   [erg/cm2]
15- 25  1.432e-07   2.861e-08
25- 50  2.477e-07   4.170e-08
50-150  4.014e-07   1.959e-07
15-150  7.923e-07   2.268e-07
Double BB

Spectral model: bbodyrad<1> + bbodyrad<2>
------------------------------------------------------------
Parameters  : value         Lower 90%    Upper 90%
kT1 [keV]   : 5.94109        (-2.68893      4.33558)
R1^2/D10^2  : 1.07625        (-0.868654      12.6106)
kT2 [keV]   : 21.2590        (-6.29881      57.0479)
R2^2/D10^2  : 1.23115E-02    (-0.0120545   0.0179066)
------------------------------------------------------------
#Fit statistic : Chi-Squared =          61.79 using 59 PHA bins.
# Reduced chi-squared =          1.123 for     55 degrees of freedom
# Null hypothesis probability =   2.465504e-01

Energy  Fluence     90% Error
[keV]   [erg/cm2]   [erg/cm2]
15- 25  1.385e-07   7.888e-08
25- 50  2.363e-07   1.176e-07
50-150  4.298e-07   2.449e-07
15-150  8.045e-07   4.252e-07
Peak spectrum fit
Power-law model
Time interval is from    4.864 sec. to    5.864 sec.

Spectral model in power-law:
------------------------------------------------------------
Parameters  : value       lower 90%   higher 90%
Photon index: 1.53702     ( -0.515542   0.509492 )
Norm@50keV  : 1.03460E-02    ( -0.00281931   0.00278498 )
------------------------------------------------------------
#Fit statistic : Chi-Squared =          53.74 using 59 PHA bins.
# Reduced chi-squared =         0.9427 for     57 degrees of freedom
# Null hypothesis probability =   5.983070e-01

Photon flux (15-150 keV)    in 1 sec: 1.30487 ( -0.368854  0.370756 ) ph/cm2/s
Energy fluence (15-150 keV)             : 9.75822e-08 ( -2.81251e-08  2.84497e-08 ) ergs/cm2
Cutoff power-law model

Time interval is from    4.864 sec. to    5.864 sec.
Spectral model in the cutoff power-law:
------------------------------------------------------------
Parameters  : value       lower 90%   higher 90%
Photon index: 1.55223     ( -0.534918   0.501922 )
Epeak [keV] : 9999.35      ( -9999.36 -9999.36 )
Norm@50keV  : 1.03533E-02    ( -0.00275985   0.0297401 )
------------------------------------------------------------
#Fit statistic : Chi-Squared =          53.74 using 59 PHA bins.
# Reduced chi-squared =         0.9597 for     56 degrees of freedom
# Null hypothesis probability =   5.607727e-01

Photon flux (15-150 keV)    in 1 sec: 1.31545 ( -0.379692  0.36069 ) ph/cm2/s
Energy fluence (15-150 keV)             : 9.74431e-08 ( -2.79289e-08  2.78399e-08 ) ergs/cm2
Band function
Time interval is from    4.864 sec. to    5.864 sec.

Spectral model in the Band function:
------------------------------------------------------------
Parameters  : value       lower 90%   higher 90%
alpha       : 4.88941   ( -4.88941   -4.88941 )
beta        : -1.67407    ( -0.809921   0.589672 )
Epeak [keV] : 26.2771      ( -26.2771 11.4424 )
Norm@50keV   : 707.571    ( -187.468   9.67883e+06 )
------------------------------------------------------------
#Fit statistic : Chi-Squared =          53.28 using 59 PHA bins.
# Reduced chi-squared =         0.9687 for     55 degrees of freedom
# Null hypothesis probability =   5.407574e-01

Photon flux (15-150 keV)    in 1 sec:  (    ) ph/cm2/s
Energy fluence (15-150 keV)             : 0 ( 0  0 ) ergs/cm2
Single BB
Spectral model blackbody:
------------------------------------------------------------
Parameters  : value    Lower 90%  Upper 90%
kT [keV]    : 14.0533  (  )
R^2/D10^2   : 0.172822  (-0.173925   1.51754)
(R is the radius in km and D10 is the distance to the source in units of 10 kpc)
------------------------------------------------------------
#Fit statistic : Chi-Squared =          61.60 using 59 PHA bins.
# Reduced chi-squared =          1.081 for     57 degrees of freedom
# Null hypothesis probability =   3.150032e-01

Energy  Fluence     90% Error
[keV]   [erg/cm2]   [erg/cm2]
15- 25  7.994e-09   5.225e-09
25- 50  2.795e-08   1.723e-08
50-150  3.097e-08   2.105e-08
15-150  6.691e-08   4.172e-08
Thermal bremsstrahlung (OTTB)

Spectral model: thermal bremsstrahlung
------------------------------------------------------------
Parameters  : value         Lower 90%    Upper 90%
kT [keV]    : 199.360       (-199.362      -199.362)
Norm        : 5.30308       (-1.4237     1.86839)
------------------------------------------------------------
#Fit statistic : Chi-Squared =          54.31 using 59 PHA bins.
# Reduced chi-squared =         0.9527 for     57 degrees of freedom
# Null hypothesis probability =   5.767690e-01

Energy  Fluence     90% Error
[keV]   [erg/cm2]   [erg/cm2]
15- 25  1.320e-08   7.770e-09
25- 50  2.540e-08   1.536e-08
50-150  5.571e-08   3.283e-08
15-150  9.432e-08   5.695e-08
Double BB
Spectral model: bbodyrad<1> + bbodyrad<2>
------------------------------------------------------------
Parameters  : value         Lower 90%    Upper 90%
kT1 [keV]   : 7.21178        (-2.57      4.52487)
R1^2/D10^2  : 1.70958        (-1.37532      7.86328)
kT2 [keV]   : 60.0200        (-38.7879      -61.5659)
R2^2/D10^2  : 1.57424E-03    (-0.00142497   0.0250174)
------------------------------------------------------------
#Fit statistic : Chi-Squared =          51.46 using 59 PHA bins.
# Reduced chi-squared =         0.9355 for     55 degrees of freedom
# Null hypothesis probability =   6.108626e-01

Energy  Fluence     90% Error
[keV]   [erg/cm2]   [erg/cm2]
15- 25  1.525e-08   9.680e-09
25- 50  2.536e-08   1.472e-08
50-150  6.163e-08   3.566e-08
15-150  1.022e-07   5.455e-08
Pre-slew spectrum (Pre-slew PHA with pre-slew DRM)
Power-law model
Spectral model in power-law:
------------------------------------------------------------
Parameters  : value       lower 90%   higher 90%
Photon index: 1.74139     ( -0.244267   0.253292 )
Norm@50keV  : 3.95786E-03    ( -0.000601214   0.000592003 )
------------------------------------------------------------
#Fit statistic : Chi-Squared =          61.25 using 59 PHA bins.
# Reduced chi-squared =          1.075 for     57 degrees of freedom
# Null hypothesis probability =   3.259861e-01

Photon flux (15-150 keV)    in 23 sec: 0.533479 ( -0.0782926  0.0785101 ) ph/cm2/s
Energy fluence (15-150 keV)             : 8.40404e-07 ( -1.30605e-07  1.31764e-07 ) ergs/cm2
Cutoff power-law model

Spectral model in the cutoff power-law:
------------------------------------------------------------
Parameters  : value       lower 90%   higher 90%
Photon index: 1.47048     ( -1.15599   0.699778 )
Epeak [keV] : 95.5582      ( -95.5265 -95.5689 )
Norm@50keV  : 5.47603E-03    ( -0.00547564   0.0158481 )
------------------------------------------------------------
#Fit statistic : Chi-Squared =          61.03 using 59 PHA bins.
# Reduced chi-squared =          1.090 for     56 degrees of freedom
# Null hypothesis probability =   2.998826e-01

Photon flux (15-150 keV)    in 23 sec: 0.528085 ( -0.080938  0.080697 ) ph/cm2/s
Energy fluence (15-150 keV)             : 8.27064e-07 ( -1.41441e-07  1.3975e-07 ) ergs/cm2
Band function

Spectral model in the Band function:
------------------------------------------------------------
Parameters  : value       lower 90%   higher 90%
alpha       : 4.97725   ( -4.97725   -4.97725 )
beta        : -1.77858    ( -0.281155   0.258425 )
Epeak [keV] : 20.4406      ( -20.4406 8.29237 )
Norm@50keV   : 1789.25    ( -253.148   3.72504e+06 )
------------------------------------------------------------
#Fit statistic : Chi-Squared =          60.89 using 59 PHA bins.
# Reduced chi-squared =          1.107 for     55 degrees of freedom
# Null hypothesis probability =   2.722782e-01

Photon flux (15-150 keV)    in 23 sec:  (    ) ph/cm2/s
Energy fluence (15-150 keV)             : 0 ( 0  0 ) ergs/cm2
S(25-50 keV) vs. S(50-100 keV) plot
S(25-50 keV)  = 2.31e-07
S(50-100 keV) = 2.77e-07
T90 vs. Hardness ratio plot

T90                                   = 21 sec.
Hardness ratio (energy fluence ratio) = 1.19913
Color vs. Color plot

Count Ratio  (25-50 keV) / (15-25 keV) = 1.38101
Count Ratio (50-100 keV) / (15-25 keV) = 0.973363
Mask shadow pattern
IMX = 1.147696424446239E+00, IMY = -1.847015406516966E-01
TIME vs. PHA plot around the trigger time
Blue+Cyan dotted lines: Time interval of the scaled map
From 0.000000 to 4.096000
TIME vs. DetID plot around the trigger time

Blue+Cyan dotted lines: Time interval of the scaled map
From 0.000000 to 4.096000
100 us light curve (15-350 keV)
Blue+Cyan dotted lines: Time interval of the scaled map
From 0.000000 to 4.096000
Spacecraft aspect plot
Bright source in the pre-burst/pre-slew/post-slew images
Pre-burst image of 15-350 keV band
Time interval of the image:
-299.136000 -0.136000

# RAcent  DECcent POSerr Theta    Phi  PeakCts   SNR AngSep     Name
#  [deg]    [deg]    ['] [deg]  [deg]                   [']
102.0885  23.9264    2.4  34.6   79.1   1.8934   4.8 ------	UNKNOWN
203.4970  73.7761    3.2  55.8 -175.6   2.6041   3.7 ------	UNKNOWN
213.4538  72.3449    2.6  58.3 -173.2   4.8480   4.3 ------	UNKNOWN
Pre-slew background subtracted image of 15-350 keV band
Time interval of the image:
-0.136000 22.864000

# RAcent  DECcent POSerr Theta    Phi  PeakCts   SNR AngSep     Name
#  [deg]    [deg]    ['] [deg]  [deg]                   [']
122.8110 -18.3000    1.0  49.3    9.1   1.3787  11.8 ------	UNKNOWN
Post-slew image of 15-350 keV band
Time interval of the image:
101.364620 302.882300

# RAcent  DECcent POSerr Theta    Phi  PeakCts   SNR AngSep     Name
#  [deg]    [deg]    ['] [deg]  [deg]                   [']
135.5612 -40.5966    1.6  24.8  -28.6   1.0322   7.3    2.9	Vela X-1
170.3267 -60.5528   71.2  53.9  -31.7   0.1093   0.2    4.2	Cen X-3
 83.3213 -50.1723    2.4  44.7   30.4   1.7771   4.9 ------	UNKNOWN
129.3115  32.8308    3.0  51.5 -178.0   1.3981   3.9 ------	UNKNOWN
Plot creation:
Sun May 31 15:22:52 EDT 2015