Special notes of this burst
Image
Pre-slew 15.0-350.0 keV image (Event data)
#   RAcent    DECcent   POSerr    Theta     Phi              Peak Cts       SNR   Name
  265.3009    34.9446   0.0213    20.8696   142.0257         0.0301620      9.022 TRIG_00162580

Foreground time interval of the image:
 -0.004   0.064 (delta_t =   0.068 [sec])
Background time interval of the image:
-299.360  -0.004 (delta_t = 299.356 [sec])
Lightcurves
Notes:
- 1) The mask-weighted light curves are using the flight position.
- 2) Multiple plots of different time binning/intervals are shown to cover all scenarios of short/long GRBs, rate/image triggers, and real/false positives.
- 3) For all the mask-weighted lightcurves, the y-axis units are counts/sec/det where a det is 0.4 x 0.4 = 0.16 sq cm.
- 4) The verticle lines correspond to following: green dotted lines are T50 interval, black dotted lines are T90 interval, blue solid line(s) is a spacecraft slew start time, and orange solid line(s) is a spacecraft slew end time.
- 5) Time of each bin is in the middle of the bin.
1 s binning
From T0-310 s to T0+310 s
From T100_start - 20 s to T100_end + 30 s
Full time interval
64 ms binning
Full time interval
From T100_start to T100_end
From T0-5 sec to T0+5 sec
16 ms binning
From T100_start-5 s to T100_start+5 s
Blue+Cyan dotted lines: Time interval of the scaled map
From 0.000000 to 0.032000
8 ms binning
From T100_start-3 s to T100_start+3 s
Blue+Cyan dotted lines: Time interval of the scaled map
From 0.000000 to 0.032000
2 ms binning
From T100_start-1 s to T100_start+1 s
Blue+Cyan dotted lines: Time interval of the scaled map
From 0.000000 to 0.032000
SN=5 or 10 sec. binning (whichever binning is satisfied first)
SN=5 or 10 sec. binning (T < 200 sec)
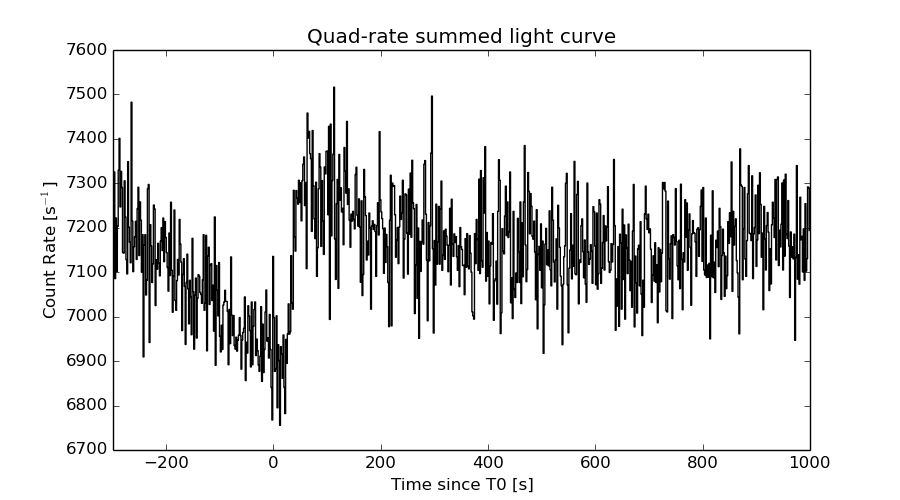
Quad-rate summed light curves (from T0-300s to T0+1000s)
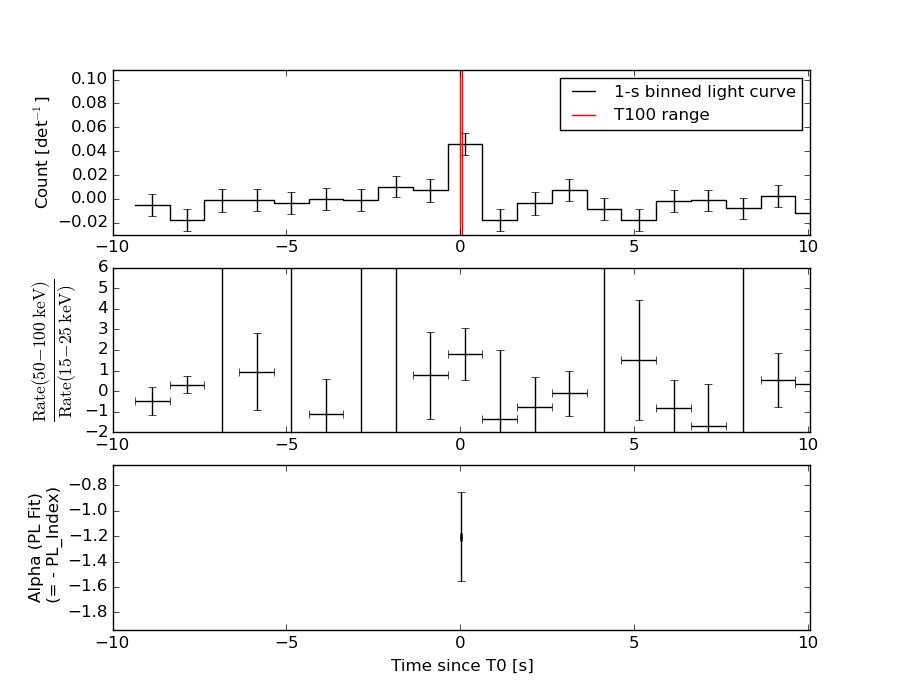
Spectral Evolution
Spectra
Notes:
- 1) The fitting includes the systematic errors.
- 2) When the burst includes telescope slew time periods, the fitting uses an average response file made from multiple 5-s response files through out the slew time plus single time preiod for the non-slew times, and weighted by the total counts in the corresponding time period using addrmf. An average response file is needed becuase a spectral fit using the pre-slew DRM will introduce some errors in both a spectral shape and a normalization if the PHA file contains a lot of the slew/post-slew time interval.
- 3) For fits to more complicated models (e.g. a power-law over a cutoff power-law), the BAT team has decided to require a chi-square improvement of more than 6 for each extra dof.
Time averaged spectrum fit using the average DRM
Power-law model
Time interval is from   -0.004 sec. to    0.064 sec.

Spectral model in power-law:
------------------------------------------------------------
Parameters  : value       lower 90%   higher 90%
Photon index: 1.20996     ( -0.354765   0.341635 )
Norm@50keV  : 2.43073E-02    ( -0.00502439   0.00502436 )
------------------------------------------------------------
#Fit statistic : Chi-Squared =          65.19 using 59 PHA bins.
# Reduced chi-squared =          1.144 for     57 degrees of freedom
# Null hypothesis probability =   2.132764e-01

Photon flux (15-150 keV)    in 0.068 sec: 2.85723 ( -0.605865  0.607282 ) ph/cm2/s
Energy fluence (15-150 keV)             : 1.67226e-08 ( -3.78247e-09  3.82522e-09 ) ergs/cm2
Cutoff power-law model
Time interval is from   -0.004 sec. to    0.064 sec.
Spectral model in the cutoff power-law:
------------------------------------------------------------
Parameters  : value       lower 90%   higher 90%
Photon index: 0.925260     (     )
Epeak [keV] : 196.286      (   )
Norm@50keV  : 3.37185E-02    (     )
------------------------------------------------------------
#Fit statistic : Chi-Squared =          65.06 using 59 PHA bins.
# Reduced chi-squared =          1.162 for     56 degrees of freedom
# Null hypothesis probability =   1.905073e-01

Photon flux (15-150 keV)    in 0.068 sec: 2.83791 ( -0.61386  0.61357 ) ph/cm2/s
Energy fluence (15-150 keV)             : 1.6451e-08 ( -4.1582e-09  4.00228e-09 ) ergs/cm2
Band function
Time interval is from   -0.004 sec. to    0.064 sec.

Spectral model in the Band function:
------------------------------------------------------------
Parameters  : value       lower 90%   higher 90%
alpha       : 0.247108   ( -0.0459161   -0.0459161 )
beta        : -1.46225    ( 1.4589   0.550446 )
Epeak [keV] : 60.3948      ( -60.4504 143.356 )
Norm@50keV   : 0.171305    ( -0.180246   544.387 )
------------------------------------------------------------
#Fit statistic : Chi-Squared =          64.45 using 59 PHA bins.
# Reduced chi-squared =          1.172 for     55 degrees of freedom
# Null hypothesis probability =   1.795596e-01

Photon flux (15-150 keV)    in 0.068 sec:  (    ) ph/cm2/s
Energy fluence (15-150 keV)             : 0 ( 0  0 ) ergs/cm2
Single BB
Spectral model blackbody:
------------------------------------------------------------
Parameters  : value    Lower 90%  Upper 90%
kT [keV]    : 16.9249  (-3.94178  6.15354)
R^2/D10^2   : 0.232055  (-0.150326   0.339118)
(R is the radius in km and D10 is the distance to the source in units of 10 kpc)
------------------------------------------------------------
#Fit statistic : Chi-Squared =          69.51 using 59 PHA bins.
# Reduced chi-squared =          1.220 for     57 degrees of freedom
# Null hypothesis probability =   1.235837e-01

Energy  Fluence     90% Error
[keV]   [erg/cm2]   [erg/cm2]
15- 25  9.217e-10   3.736e-10
25- 50  4.064e-09   1.598e-09
50-150  8.299e-09   3.331e-09
15-150  1.328e-08   4.918e-09
Thermal bremsstrahlung (OTTB)
Spectral model: thermal bremsstrahlung
------------------------------------------------------------
Parameters  : value         Lower 90%    Upper 90%
kT [keV]    : 200.000       (      )
Norm        : 11.8181       (-2.49264     2.49251)
------------------------------------------------------------
#Fit statistic : Chi-Squared =          67.65 using 59 PHA bins.
# Reduced chi-squared =          1.187 for     57 degrees of freedom
# Null hypothesis probability =   1.579889e-01

Energy  Fluence     90% Error
[keV]   [erg/cm2]   [erg/cm2]
15- 25  2.001e-09   1.186e-09
25- 50  3.849e-09   2.279e-09
50-150  8.442e-09   4.896e-09
15-150  1.429e-08   8.299e-09
Double BB
Spectral model: bbodyrad<1> + bbodyrad<2>
------------------------------------------------------------
Parameters  : value         Lower 90%    Upper 90%
kT1 [keV]   : 10.5436        (-5.40976      5.21788)
R1^2/D10^2  : 0.813105        (-0.511307      3.85522)
kT2 [keV]   : 50.8791        (-40.2435      -69.923)
R2^2/D10^2  : 5.03314E-03    (-0.00219361   0.0870182)
------------------------------------------------------------
#Fit statistic : Chi-Squared =          64.01 using 59 PHA bins.
# Reduced chi-squared =          1.164 for     55 degrees of freedom
# Null hypothesis probability =   1.897463e-01

Energy  Fluence     90% Error
[keV]   [erg/cm2]   [erg/cm2]
15- 25  1.367e-09   8.371e-10
25- 50  4.094e-09   2.323e-09
50-150  1.067e-08   5.851e-09
15-150  1.613e-08   8.010e-09
Peak spectrum fit
Power-law model
Time interval is from   -0.468 sec. to    0.532 sec.

Spectral model in power-law:
------------------------------------------------------------
Parameters  : value       lower 90%   higher 90%
Photon index: 0.928029     ( -0.780344   0.659869 )
Norm@50keV  : 2.70021E-03    ( -0.00106364   0.00100107 )
------------------------------------------------------------
#Fit statistic : Chi-Squared =          50.02 using 59 PHA bins.
# Reduced chi-squared =         0.8776 for     57 degrees of freedom
# Null hypothesis probability =   7.320126e-01

Photon flux (15-150 keV)    in 1 sec: 0.310044 ( -0.116522  0.118399 ) ph/cm2/s
Energy fluence (15-150 keV)             : 2.998e-08 ( -1.13215e-08  1.14971e-08 ) ergs/cm2
Cutoff power-law model

Time interval is from   -0.468 sec. to    0.532 sec.
Spectral model in the cutoff power-law:
------------------------------------------------------------
Parameters  : value       lower 90%   higher 90%
Photon index: 0.922785     ( -1.10877   0.664595 )
Epeak [keV] : 9999.35      ( -9999.36 -9999.36 )
Norm@50keV  : 2.71526E-03    ( -0.000968263   0.0436625 )
------------------------------------------------------------
#Fit statistic : Chi-Squared =          50.02 using 59 PHA bins.
# Reduced chi-squared =         0.8933 for     56 degrees of freedom
# Null hypothesis probability =   6.993209e-01

Photon flux (15-150 keV)    in 1 sec: 0.309978 ( -0.060692  0.117699 ) ph/cm2/s
Energy fluence (15-150 keV)             : 2.99858e-08 ( -2.99858e-08  1.14792e-08 ) ergs/cm2
Band function

Time interval is from   -0.468 sec. to    0.532 sec.

Spectral model in the Band function:
------------------------------------------------------------
Parameters  : value       lower 90%   higher 90%
alpha       : -0.863468   ( 0.862176   0.862176 )
beta        : -0.938599    ( -0.659692   0.779867 )
Epeak [keV] : 13.3739      ( -13.3625 -13.3625 )
Norm@50keV   : 4.07196E-03    ( -0.00240414   111613 )
------------------------------------------------------------
#Fit statistic : Chi-Squared =          50.03 using 59 PHA bins.
# Reduced chi-squared =         0.9096 for     55 degrees of freedom
# Null hypothesis probability =   6.646509e-01

Photon flux (15-150 keV)    in 1 sec:  (    ) ph/cm2/s
Energy fluence (15-150 keV)             : 0 ( 0  0 ) ergs/cm2
Single BB
Spectral model blackbody:
------------------------------------------------------------
Parameters  : value    Lower 90%  Upper 90%
kT [keV]    : 26.2124  (-11.7696  31.9763)
R^2/D10^2   : 6.44663E-03  (-0.00643473   0.0353078)
(R is the radius in km and D10 is the distance to the source in units of 10 kpc)
------------------------------------------------------------
#Fit statistic : Chi-Squared =          51.66 using 59 PHA bins.
# Reduced chi-squared =         0.9064 for     57 degrees of freedom
# Null hypothesis probability =   6.748269e-01

Energy  Fluence     90% Error
[keV]   [erg/cm2]   [erg/cm2]
15- 25  7.500e-10   5.035e-10
25- 50  4.356e-09   2.804e-09
50-150  2.201e-08   1.411e-08
15-150  2.712e-08   1.698e-08
Thermal bremsstrahlung (OTTB)
Spectral model: thermal bremsstrahlung
------------------------------------------------------------
Parameters  : value         Lower 90%    Upper 90%
kT [keV]    : 199.362       (-112.699      -199.363)
Norm        : 1.28529       (-0.488081     0.488102)
------------------------------------------------------------
#Fit statistic : Chi-Squared =          52.56 using 59 PHA bins.
# Reduced chi-squared =         0.9220 for     57 degrees of freedom
# Null hypothesis probability =   6.423440e-01

Energy  Fluence     90% Error
[keV]   [erg/cm2]   [erg/cm2]
15- 25  3.200e-09   2.081e-09
25- 50  6.157e-09   4.031e-09
50-150  1.350e-08   8.430e-09
15-150  2.286e-08   1.416e-08
Double BB
Spectral model: bbodyrad<1> + bbodyrad<2>
------------------------------------------------------------
Parameters  : value         Lower 90%    Upper 90%
kT1 [keV]   : 8.98418        (-8.96475      -8.96475)
R1^2/D10^2  : 0.111586        (-0.111669      -0.111669)
kT2 [keV]   : 46.0556        (-46.0123      -46.0123)
R2^2/D10^2  : 1.10991E-03    (-0.00111311   0.0149052)
------------------------------------------------------------
#Fit statistic : Chi-Squared =          49.65 using 59 PHA bins.
# Reduced chi-squared =         0.9027 for     55 degrees of freedom
# Null hypothesis probability =   6.785822e-01

Energy  Fluence     90% Error
[keV]   [erg/cm2]   [erg/cm2]
15- 25  2.026e-09   1.434e-09
25- 50  5.654e-09   3.770e-09
50-150  2.321e-08   1.346e-08
15-150  3.089e-08   1.742e-08
Pre-slew spectrum (Pre-slew PHA with pre-slew DRM)
Power-law model
Spectral model in power-law:
------------------------------------------------------------
Parameters  : value       lower 90%   higher 90%
Photon index: 1.20996     ( -0.354765   0.341635 )
Norm@50keV  : 2.43073E-02    ( -0.00502439   0.00502436 )
------------------------------------------------------------
#Fit statistic : Chi-Squared =          65.19 using 59 PHA bins.
# Reduced chi-squared =          1.144 for     57 degrees of freedom
# Null hypothesis probability =   2.132764e-01

Photon flux (15-150 keV)    in 0.068 sec: 2.85723 ( -0.605865  0.607282 ) ph/cm2/s
Energy fluence (15-150 keV)             : 1.67226e-08 ( -3.78247e-09  3.82522e-09 ) ergs/cm2
Cutoff power-law model

Spectral model in the cutoff power-law:
------------------------------------------------------------
Parameters  : value       lower 90%   higher 90%
Photon index: 0.925260     (     )
Epeak [keV] : 196.286      (   )
Norm@50keV  : 3.37185E-02    (     )
------------------------------------------------------------
#Fit statistic : Chi-Squared =          65.06 using 59 PHA bins.
# Reduced chi-squared =          1.162 for     56 degrees of freedom
# Null hypothesis probability =   1.905073e-01

Photon flux (15-150 keV)    in 0.068 sec: 2.83791 ( -0.61386  0.61357 ) ph/cm2/s
Energy fluence (15-150 keV)             : 1.6451e-08 ( -4.1582e-09  4.00228e-09 ) ergs/cm2
Band function

Spectral model in the Band function:
------------------------------------------------------------
Parameters  : value       lower 90%   higher 90%
alpha       : 0.247108   ( -0.0459161   -0.0459161 )
beta        : -1.46225    ( 1.4589   0.550446 )
Epeak [keV] : 60.3948      ( -60.4504 148.84 )
Norm@50keV   : 0.171305    ( -0.180246   544.387 )
------------------------------------------------------------
#Fit statistic : Chi-Squared =          64.45 using 59 PHA bins.
# Reduced chi-squared =          1.172 for     55 degrees of freedom
# Null hypothesis probability =   1.795596e-01

Photon flux (15-150 keV)    in 0.068 sec:  (    ) ph/cm2/s
Energy fluence (15-150 keV)             : 0 ( 0  0 ) ergs/cm2
S(25-50 keV) vs. S(50-100 keV) plot
S(25-50 keV)  = 3.53e-09
S(50-100 keV) = 6.11e-09
T90 vs. Hardness ratio plot
T90                                   = 0.0559999942779541 sec.
Hardness ratio (energy fluence ratio) = 1.73088
Color vs. Color plot
Count Ratio  (25-50 keV) / (15-25 keV) = 1.68011
Count Ratio (50-100 keV) / (15-25 keV) = 1.70575
Mask shadow pattern
IMX = -3.005377951979895E-01, IMY = -2.345888052357080E-01
TIME vs. PHA plot around the trigger time
Blue+Cyan dotted lines: Time interval of the scaled map
From 0.000000 to 0.032000
TIME vs. DetID plot around the trigger time
Blue+Cyan dotted lines: Time interval of the scaled map
From 0.000000 to 0.032000
100 us light curve (15-350 keV)
Blue+Cyan dotted lines: Time interval of the scaled map
From 0.000000 to 0.032000
Spacecraft aspect plot
Bright source in the pre-burst/pre-slew/post-slew images
Pre-burst image of 15-350 keV band
Time interval of the image:
-299.360000 -0.004000

# RAcent  DECcent POSerr Theta    Phi  PeakCts   SNR AngSep     Name
#  [deg]    [deg]    ['] [deg]  [deg]                   [']
254.3828  35.3252    3.5  11.9  143.6   0.5479   3.2    3.8	Her X-1
268.3661  -1.4529   65.7  45.3 -163.2   0.0589   0.2    0.1	SW J1753.5-0127
273.8279 -14.0504    8.1  58.8 -160.3  -2.2660  -1.5   10.4	GX 17+2
288.7060  10.9026    6.7  50.5  165.4   1.0353   1.7    6.0	GRS 1915+105
291.4924  48.4926    2.3  40.0  113.2   2.9833   5.0 ------	UNKNOWN
275.4886   7.1684    3.3  43.0 -179.0   0.9642   3.5 ------	UNKNOWN
170.0080  41.1489    2.3  53.8   -2.0   2.8132   4.9 ------	UNKNOWN
169.6743  30.8525    2.8  57.7  -13.5   3.9534   4.2 ------	UNKNOWN
278.3402 -11.2219    2.9  58.9 -166.4   4.9512   3.9 ------	UNKNOWN
Pre-slew background subtracted image of 15-350 keV band
Time interval of the image:
-0.004000 0.064000

# RAcent  DECcent POSerr Theta    Phi  PeakCts   SNR AngSep     Name
#  [deg]    [deg]    ['] [deg]  [deg]                   [']
254.2270  35.3190  220.0  11.8  143.7  -0.0002  -0.1   11.4	Her X-1
268.2954  -1.4989   80.1  45.3 -163.1  -0.0008  -0.1    5.2	SW J1753.5-0127
274.0869 -13.9735    3.9  58.8 -160.6  -0.0472  -2.9    6.0	GX 17+2
288.8114  11.0283    6.8  50.5  165.2   0.0163   1.7    5.0	GRS 1915+105
294.7839  35.9737    2.6  44.2  131.2   0.0633   4.5 ------	UNKNOWN
265.3008  34.9446    1.3  20.9  142.0   0.0302   9.0 ------	UNKNOWN
Post-slew image of 15-350 keV band
Time interval of the image:
51.340600 302.670500

# RAcent  DECcent POSerr Theta    Phi  PeakCts   SNR AngSep     Name
#  [deg]    [deg]    ['] [deg]  [deg]                   [']
254.5274  35.3195    4.7   8.8  -42.1   0.4473   2.5    3.7	Her X-1
268.2828  -1.4155    3.4  36.4 -142.9   0.8368   3.3    5.6	SW J1753.5-0127
274.2169 -14.0513    3.7  49.7 -149.3   1.4434   3.1   12.3	GX 17+2
288.8293  11.0624    4.2  32.1  174.5   0.6698   2.8    7.2	GRS 1915+105
299.6019  35.2112    0.3  28.0  121.5  10.6112  38.8    0.8	Cyg X-1
308.1328  40.9915    4.0  34.0  108.9   1.1806   2.9    2.5	Cyg X-3
283.6475   2.8256    2.1  36.4 -169.9   1.2408   5.6 ------	UNKNOWN
272.3040  14.5154    2.6  21.4 -156.8   0.8507   4.4 ------	UNKNOWN
290.7837 -18.8494    3.1  59.0 -166.2   4.2859   3.7 ------	UNKNOWN
238.2056  21.7420    3.3  27.1  -69.7   0.7372   3.5 ------	UNKNOWN
271.7598 -19.9469    4.8  55.2 -145.3   3.4386   2.5 ------	UNKNOWN
257.2296 -11.6180    2.8  47.2 -127.1   3.1377   4.1 ------	UNKNOWN
232.7469   6.7798    3.0  41.0  -83.5   3.2356   3.9 ------	UNKNOWN
Plot creation:
Sun May 31 15:16:28 EDT 2015