Special notes of this burst
Image
Pre-slew 15.0-350.0 keV image (Event data)
#   RAcent    DECcent   POSerr    Theta     Phi              Peak Cts       SNR   Name
  348.1352    18.3602   0.0057    27.1618   136.1118         6.1435707     33.502 TRIG_00163438

Foreground time interval of the image:
-11.312  84.688 (delta_t =  96.000 [sec])
Background time interval of the image:
-127.411 -11.312 (delta_t = 116.099 [sec])
Lightcurves
Notes:
- 1) The mask-weighted light curves are using the flight position.
- 2) Multiple plots of different time binning/intervals are shown to cover all scenarios of short/long GRBs, rate/image triggers, and real/false positives.
- 3) For all the mask-weighted lightcurves, the y-axis units are counts/sec/det where a det is 0.4 x 0.4 = 0.16 sq cm.
- 4) The verticle lines correspond to following: green dotted lines are T50 interval, black dotted lines are T90 interval, blue solid line(s) is a spacecraft slew start time, and orange solid line(s) is a spacecraft slew end time.
- 5) Time of each bin is in the middle of the bin.
1 s binning
From T0-310 s to T0+310 s
From T100_start - 20 s to T100_end + 30 s

Full time interval

64 ms binning
Full time interval

From T100_start to T100_end

From T0-5 sec to T0+5 sec

16 ms binning
From T100_start-5 s to T100_start+5 s

Blue+Cyan dotted lines: Time interval of the scaled map
From 0.000000 to 1.024000
8 ms binning
From T100_start-3 s to T100_start+3 s
Blue+Cyan dotted lines: Time interval of the scaled map
From 0.000000 to 1.024000
2 ms binning
From T100_start-1 s to T100_start+1 s

Blue+Cyan dotted lines: Time interval of the scaled map
From 0.000000 to 1.024000
SN=5 or 10 sec. binning (whichever binning is satisfied first)

SN=5 or 10 sec. binning (T < 200 sec)
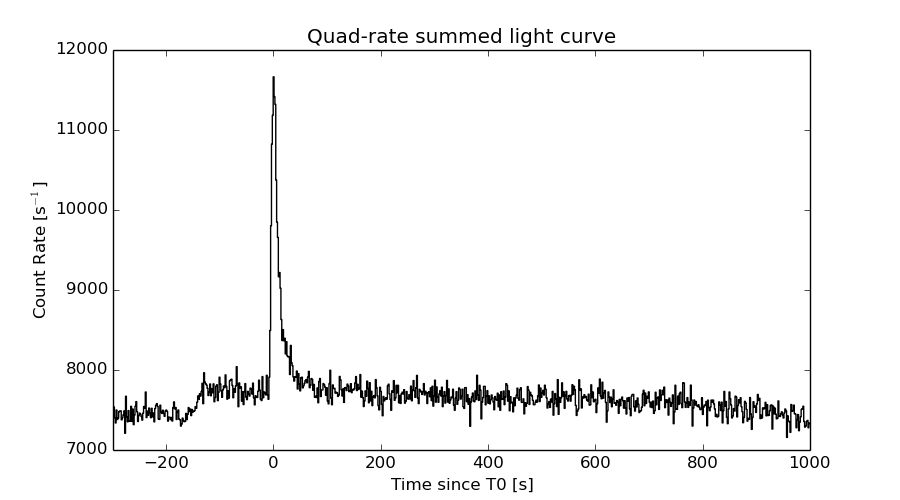
Quad-rate summed light curves (from T0-300s to T0+1000s)
Spectral Evolution

Spectra
Notes:
- 1) The fitting includes the systematic errors.
- 2) When the burst includes telescope slew time periods, the fitting uses an average response file made from multiple 5-s response files through out the slew time plus single time preiod for the non-slew times, and weighted by the total counts in the corresponding time period using addrmf. An average response file is needed becuase a spectral fit using the pre-slew DRM will introduce some errors in both a spectral shape and a normalization if the PHA file contains a lot of the slew/post-slew time interval.
- 3) For fits to more complicated models (e.g. a power-law over a cutoff power-law), the BAT team has decided to require a chi-square improvement of more than 6 for each extra dof.
Time averaged spectrum fit using the average DRM
Power-law model
Time interval is from  -11.312 sec. to   84.688 sec.

Spectral model in power-law:
------------------------------------------------------------
Parameters  : value       lower 90%   higher 90%
Photon index: 1.32175     ( -0.0621193   0.0618706 )
Norm@50keV  : 4.52067E-03    ( -0.000150573   0.000150551 )
------------------------------------------------------------
#Fit statistic : Chi-Squared =          63.17 using 59 PHA bins.
# Reduced chi-squared =          1.108 for     57 degrees of freedom
# Null hypothesis probability =   2.674292e-01

Photon flux (15-150 keV)    in 96 sec: 0.541548 ( -0.0194457  0.0194931 ) ph/cm2/s
Energy fluence (15-150 keV)             : 4.26625e-06 ( -1.52103e-07  1.52415e-07 ) ergs/cm2
Cutoff power-law model
Time interval is from  -11.312 sec. to   84.688 sec.
Spectral model in the cutoff power-law:
------------------------------------------------------------
Parameters  : value       lower 90%   higher 90%
Photon index: 1.13651     ( -0.2486   0.208858 )
Epeak [keV] : 258.317      ( -116.332 -258.32 )
Norm@50keV  : 5.49301E-03    ( -0.00103936   0.001587 )
------------------------------------------------------------
#Fit statistic : Chi-Squared =          61.39 using 59 PHA bins.
# Reduced chi-squared =          1.096 for     56 degrees of freedom
# Null hypothesis probability =   2.891054e-01

Photon flux (15-150 keV)    in 96 sec: 0.535194 ( -0.020931  0.020973 ) ph/cm2/s
Energy fluence (15-150 keV)             : 4.21768e-06 ( -1.66272e-07  1.65427e-07 ) ergs/cm2
Band function

Time interval is from  -11.312 sec. to   84.688 sec.

Spectral model in the Band function:
------------------------------------------------------------
Parameters  : value       lower 90%   higher 90%
alpha       : -0.640250   ( -0.604586   4.86261 )
beta        : -1.39658    ( 1.39736   0.10125 )
Epeak [keV] : 76.1953      ( -42.5109 583.379 )
Norm@50keV   : 1.12160E-02    ( -0.00610792   0.373614 )
------------------------------------------------------------
#Fit statistic : Chi-Squared =          60.16 using 59 PHA bins.
# Reduced chi-squared =          1.094 for     55 degrees of freedom
# Null hypothesis probability =   2.944511e-01

Photon flux (15-150 keV)    in 96 sec:  (    ) ph/cm2/s
Energy fluence (15-150 keV)             : 0 ( 0  0 ) ergs/cm2
Single BB
Spectral model blackbody:
------------------------------------------------------------
Parameters  : value    Lower 90%  Upper 90%
kT [keV]    : 18.3681  (  )
R^2/D10^2   : 3.11350E-02  (   )
(R is the radius in km and D10 is the distance to the source in units of 10 kpc)
------------------------------------------------------------
#Fit statistic : Chi-Squared =         235.20 using 59 PHA bins.
# Reduced chi-squared =         4.1262 for     57 degrees of freedom
# Null hypothesis probability =   1.658084e-23

Energy  Fluence     90% Error
[keV]   [erg/cm2]   [erg/cm2]
15- 25  2.006e-07   1.373e-08
25- 50  9.416e-07   4.704e-08
50-150  2.318e-06   1.392e-07
15-150  3.460e-06   1.378e-07
Thermal bremsstrahlung (OTTB)
Spectral model: thermal bremsstrahlung
------------------------------------------------------------
Parameters  : value         Lower 90%    Upper 90%
kT [keV]    : 200.000       (      )
Norm        : 2.27813       (-0.0765019     0.0764692)
------------------------------------------------------------
#Fit statistic : Chi-Squared =         106.35 using 59 PHA bins.
# Reduced chi-squared =         1.8657 for     57 degrees of freedom
# Null hypothesis probability =   8.049444e-05

Energy  Fluence     90% Error
[keV]   [erg/cm2]   [erg/cm2]
15- 25  5.448e-07   2.011e-08
25- 50  1.048e-06   3.840e-08
50-150  2.298e-06   8.592e-08
15-150  3.891e-06   1.445e-07
Double BB

Spectral model: bbodyrad<1> + bbodyrad<2>
------------------------------------------------------------
Parameters  : value         Lower 90%    Upper 90%
kT1 [keV]   : 8.24841        (-0.992617      1.07746)
R1^2/D10^2  : 0.287782        (-0.0912457      0.148897)
kT2 [keV]   : 32.2191        (-3.97551      5.83835)
R2^2/D10^2  : 3.90893E-03    (-0.00163648   0.00223847)
------------------------------------------------------------
#Fit statistic : Chi-Squared =          60.78 using 59 PHA bins.
# Reduced chi-squared =          1.105 for     55 degrees of freedom
# Null hypothesis probability =   2.756693e-01

Energy  Fluence     90% Error
[keV]   [erg/cm2]   [erg/cm2]
15- 25  4.056e-07   5.842e-08
25- 50  1.010e-06   7.762e-08
50-150  2.813e-06   3.710e-07
15-150  4.229e-06   3.994e-07
Peak spectrum fit
Power-law model

Time interval is from   -3.812 sec. to   -2.812 sec.

Spectral model in power-law:
------------------------------------------------------------
Parameters  : value       lower 90%   higher 90%
Photon index: 1.14198     ( -0.182163   0.179392 )
Norm@50keV  : 1.57301E-02    ( -0.00159313   0.00159237 )
------------------------------------------------------------
#Fit statistic : Chi-Squared =          74.79 using 59 PHA bins.
# Reduced chi-squared =          1.312 for     57 degrees of freedom
# Null hypothesis probability =   5.702406e-02

Photon flux (15-150 keV)    in 1 sec: 1.83275 ( -0.190856  0.19121 ) ph/cm2/s
Energy fluence (15-150 keV)             : 1.62326e-07 ( -1.82767e-08  1.83826e-08 ) ergs/cm2
Cutoff power-law model
Time interval is from   -3.812 sec. to   -2.812 sec.
Spectral model in the cutoff power-law:
------------------------------------------------------------
Parameters  : value       lower 90%   higher 90%
Photon index: 1.13684     ( -0.589487   0.180948 )
Epeak [keV] : 9998.34      ( -9998.68 -9998.68 )
Norm@50keV  : 1.58115E-02    ( -0.00521367   0.0104273 )
------------------------------------------------------------
#Fit statistic : Chi-Squared =          74.80 using 59 PHA bins.
# Reduced chi-squared =          1.336 for     56 degrees of freedom
# Null hypothesis probability =   4.738624e-02

Photon flux (15-150 keV)    in 1 sec: 1.83332 ( -0.19216  0.19003 ) ph/cm2/s
Energy fluence (15-150 keV)             : 1.62214e-07 ( -1.8349e-08  1.8418e-08 ) ergs/cm2
Band function

Time interval is from   -3.812 sec. to   -2.812 sec.

Spectral model in the Band function:
------------------------------------------------------------
Parameters  : value       lower 90%   higher 90%
alpha       : -0.891132   ( 0.91444   0.91444 )
beta        : -1.14166    ( 1.14197   0.182276 )
Epeak [keV] : 64.1719      ( -53.6308 -53.6308 )
Norm@50keV   : 2.75570E-02    ( -0.0135751   74.3245 )
------------------------------------------------------------
#Fit statistic : Chi-Squared =          74.80 using 59 PHA bins.
# Reduced chi-squared =          1.360 for     55 degrees of freedom
# Null hypothesis probability =   3.911476e-02

Photon flux (15-150 keV)    in 1 sec:  (    ) ph/cm2/s
Energy fluence (15-150 keV)             : 0 ( 0  0 ) ergs/cm2
Single BB
Spectral model blackbody:
------------------------------------------------------------
Parameters  : value    Lower 90%  Upper 90%
kT [keV]    : 21.2968  (-3.17514  3.83625)
R^2/D10^2   : 6.89736E-02  (-0.0279337   0.0467433)
(R is the radius in km and D10 is the distance to the source in units of 10 kpc)
------------------------------------------------------------
#Fit statistic : Chi-Squared =         101.79 using 59 PHA bins.
# Reduced chi-squared =         1.7858 for     57 degrees of freedom
# Null hypothesis probability =   2.459604e-04

Energy  Fluence     90% Error
[keV]   [erg/cm2]   [erg/cm2]
15- 25  5.874e-09   1.298e-09
25- 50  3.046e-08   4.820e-09
50-150  1.031e-07   1.974e-08
15-150  1.394e-07   1.945e-08
Thermal bremsstrahlung (OTTB)
Spectral model: thermal bremsstrahlung
------------------------------------------------------------
Parameters  : value         Lower 90%    Upper 90%
kT [keV]    : 200.000       (      )
Norm        : 7.52182       (-0.783468     0.783426)
------------------------------------------------------------
#Fit statistic : Chi-Squared =          89.74 using 59 PHA bins.
# Reduced chi-squared =          1.574 for     57 degrees of freedom
# Null hypothesis probability =   3.672195e-03

Energy  Fluence     90% Error
[keV]   [erg/cm2]   [erg/cm2]
15- 25  1.873e-08   5.387e-09
25- 50  3.602e-08   1.981e-08
50-150  7.900e-08   4.267e-08
15-150  1.337e-07   7.310e-08
Double BB

Spectral model: bbodyrad<1> + bbodyrad<2>
------------------------------------------------------------
Parameters  : value         Lower 90%    Upper 90%
kT1 [keV]   : 7.26593        (-1.90072      2.39677)
R1^2/D10^2  : 1.43073        (-0.874075      2.78858)
kT2 [keV]   : 35.1593        (-8.13269      17.3676)
R2^2/D10^2  : 1.25159E-02    (-0.0084819   0.0127567)
------------------------------------------------------------
#Fit statistic : Chi-Squared =          72.63 using 59 PHA bins.
# Reduced chi-squared =          1.321 for     55 degrees of freedom
# Null hypothesis probability =   5.581463e-02

Energy  Fluence     90% Error
[keV]   [erg/cm2]   [erg/cm2]
15- 25  1.478e-08   7.457e-09
25- 50  3.282e-08   1.088e-08
50-150  1.189e-07   6.071e-08
15-150  1.665e-07   6.757e-08
Pre-slew spectrum (Pre-slew PHA with pre-slew DRM)
Power-law model

Spectral model in power-law:
------------------------------------------------------------
Parameters  : value       lower 90%   higher 90%
Photon index: 1.32175     ( -0.0621193   0.0618706 )
Norm@50keV  : 4.52067E-03    ( -0.000150573   0.000150551 )
------------------------------------------------------------
#Fit statistic : Chi-Squared =          63.17 using 59 PHA bins.
# Reduced chi-squared =          1.108 for     57 degrees of freedom
# Null hypothesis probability =   2.674292e-01

Photon flux (15-150 keV)    in 96 sec: 0.541548 ( -0.0194457  0.0194931 ) ph/cm2/s
Energy fluence (15-150 keV)             : 4.26625e-06 ( -1.52103e-07  1.52415e-07 ) ergs/cm2
Cutoff power-law model

Spectral model in the cutoff power-law:
------------------------------------------------------------
Parameters  : value       lower 90%   higher 90%
Photon index: 1.13651     ( -0.2486   0.208858 )
Epeak [keV] : 258.317      ( -116.332 -258.32 )
Norm@50keV  : 5.49301E-03    ( -0.00103936   0.001587 )
------------------------------------------------------------
#Fit statistic : Chi-Squared =          61.39 using 59 PHA bins.
# Reduced chi-squared =          1.096 for     56 degrees of freedom
# Null hypothesis probability =   2.891054e-01

Photon flux (15-150 keV)    in 96 sec: 0.535194 ( -0.020931  0.020973 ) ph/cm2/s
Energy fluence (15-150 keV)             : 4.21768e-06 ( -1.66272e-07  1.65427e-07 ) ergs/cm2
Band function

Spectral model in the Band function:
------------------------------------------------------------
Parameters  : value       lower 90%   higher 90%
alpha       : -0.640250   ( -0.604586   4.86261 )
beta        : -1.39658    ( 1.39736   0.10125 )
Epeak [keV] : 76.1953      ( -42.5107 582.502 )
Norm@50keV   : 1.12160E-02    ( -0.00610792   0.373614 )
------------------------------------------------------------
#Fit statistic : Chi-Squared =          60.16 using 59 PHA bins.
# Reduced chi-squared =          1.094 for     55 degrees of freedom
# Null hypothesis probability =   2.944511e-01

Photon flux (15-150 keV)    in 96 sec:  (    ) ph/cm2/s
Energy fluence (15-150 keV)             : 0 ( 0  0 ) ergs/cm2
S(25-50 keV) vs. S(50-100 keV) plot

S(25-50 keV)  = 9.61e-07
S(50-100 keV) = 1.54e-06
T90 vs. Hardness ratio plot

T90                                   = 64 sec.
Hardness ratio (energy fluence ratio) = 1.6025
Color vs. Color plot
Count Ratio  (25-50 keV) / (15-25 keV) = 1.63236
Count Ratio (50-100 keV) / (15-25 keV) = 1.38649
Mask shadow pattern
IMX = -3.697797283952148E-01, IMY = -3.556999581218952E-01
TIME vs. PHA plot around the trigger time
Blue+Cyan dotted lines: Time interval of the scaled map
From 0.000000 to 1.024000
TIME vs. DetID plot around the trigger time

Blue+Cyan dotted lines: Time interval of the scaled map
From 0.000000 to 1.024000
100 us light curve (15-350 keV)

Blue+Cyan dotted lines: Time interval of the scaled map
From 0.000000 to 1.024000
Spacecraft aspect plot
Bright source in the pre-burst/pre-slew/post-slew images
Pre-burst image of 15-350 keV band
Time interval of the image:
-127.411410 -11.312000

# RAcent  DECcent POSerr Theta    Phi  PeakCts   SNR AngSep     Name
#  [deg]    [deg]    ['] [deg]  [deg]                   [']
299.5802  35.2051    0.3  24.7  -97.6   5.4537  37.8    0.5	Cyg X-1
308.1000  40.9891    1.3  16.8  -86.6   1.0714   8.7    2.2	Cyg X-3
325.9850  38.4443   19.8   4.1 -128.5   0.0681   0.6   11.5	Cyg X-2
  6.4125  16.2797    3.0  39.6  113.1   1.4862   3.8 ------	UNKNOWN
327.9672  -3.6329    2.3  44.5  178.9   0.9996   4.9 ------	UNKNOWN
Pre-slew background subtracted image of 15-350 keV band
Time interval of the image:
-11.312000 84.688000

# RAcent  DECcent POSerr Theta    Phi  PeakCts   SNR AngSep     Name
#  [deg]    [deg]    ['] [deg]  [deg]                   [']
299.7276  35.3342    9.1  24.6  -97.4   0.2239   1.3   10.4	Cyg X-1
308.2728  41.1210    0.0  16.6  -86.2  -0.2036  -1.4   12.5	Cyg X-3
326.1578  38.3277   27.4   4.1 -130.9   0.0534   0.4    0.7	Cyg X-2
348.1352  18.3602    0.3  27.2  136.1   6.1437  33.5 ------	UNKNOWN
285.1380  46.2776    2.3  32.8  -69.5   1.0295   5.1 ------	UNKNOWN
232.2807  67.8587    2.7  55.6  -31.3   2.7198   4.2 ------	UNKNOWN
Post-slew image of 15-350 keV band
Time interval of the image:
Plot creation:
Sun May 31 15:10:47 EDT 2015