Click here for the BAT GCN circular template
Image
Pre-slew 15.0-350.0 keV image (Event data)
#   RAcent    DECcent   POSerr    Theta     Phi              Peak Cts       SNR   Name
  187.2454   -26.3915   0.0107    42.2245   -48.7396         4.3982655     17.981 TRIG_00163765

Foreground time interval of the image:
-30.748  67.332 (delta_t =  98.080 [sec])
Background time interval of the image:
-299.560 -30.748 (delta_t = 268.812 [sec])
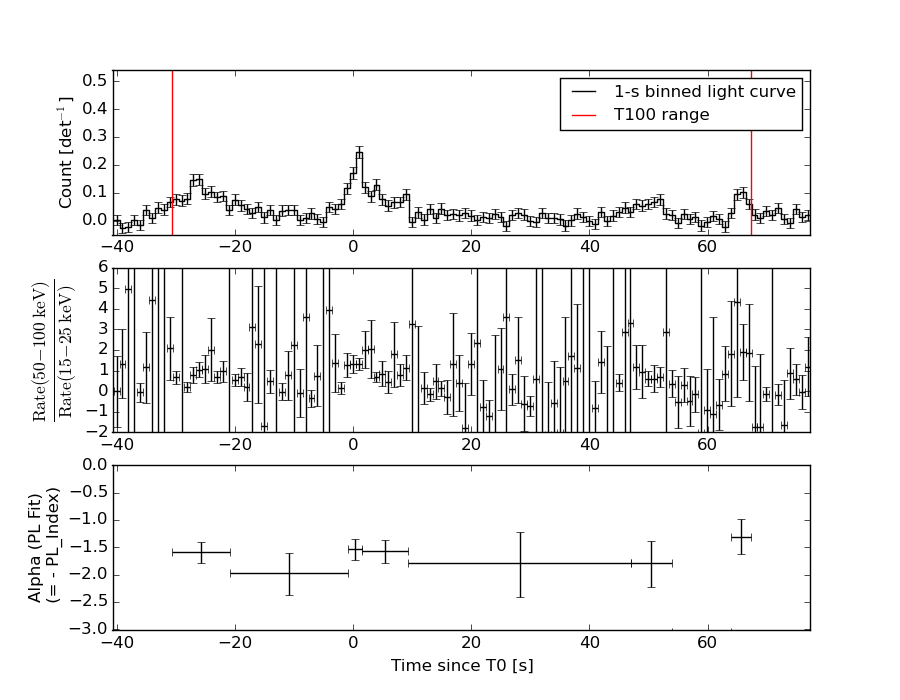
Lightcurves
Notes:
- 1) The mask-weighted light curves are using the flight position.
- 2) Multiple plots of different time binning/intervals are shown to cover all scenarios of short/long GRBs, rate/image triggers, and real/false positives.
- 3) For all the mask-weighted lightcurves, the y-axis units are counts/sec/det where a det is 0.4 x 0.4 = 0.16 sq cm.
- 4) The verticle lines correspond to following: green dotted lines are T50 interval, black dotted lines are T90 interval, blue solid line(s) is a spacecraft slew start time, and orange solid line(s) is a spacecraft slew end time.
- 5) Time of each bin is in the middle of the bin.
1 s binning
From T0-310 s to T0+310 s
From T100_start - 20 s to T100_end + 30 s
Full time interval
64 ms binning
Full time interval
From T100_start to T100_end
From T0-5 sec to T0+5 sec
16 ms binning
From T100_start-5 s to T100_start+5 s
Blue+Cyan dotted lines: Time interval of the scaled map
From 0.000000 to 1.024000
8 ms binning
From T100_start-3 s to T100_start+3 s
Blue+Cyan dotted lines: Time interval of the scaled map
From 0.000000 to 1.024000
2 ms binning
From T100_start-1 s to T100_start+1 s
Blue+Cyan dotted lines: Time interval of the scaled map
From 0.000000 to 1.024000
SN=5 or 10 sec. binning (whichever binning is satisfied first)
SN=5 or 10 sec. binning (T < 200 sec)
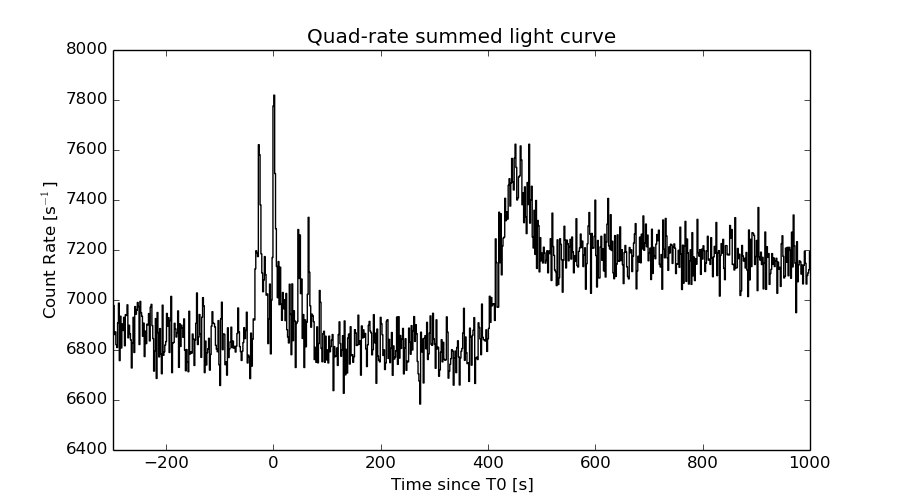
Quad-rate summed light curves (from T0-300s to T0+1000s)
Spectral Evolution
Spectra
Notes:
- 1) The fitting includes the systematic errors.
- 2) When the burst includes telescope slew time periods, the fitting uses an average response file made from multiple 5-s response files through out the slew time plus single time preiod for the non-slew times, and weighted by the total counts in the corresponding time period using addrmf. An average response file is needed becuase a spectral fit using the pre-slew DRM will introduce some errors in both a spectral shape and a normalization if the PHA file contains a lot of the slew/post-slew time interval.
- 3) For fits to more complicated models (e.g. a power-law over a cutoff power-law), the BAT team has decided to require a chi-square improvement of more than 6 for each extra dof.
Time averaged spectrum fit using the average DRM
Power-law model
Time interval is from  -30.748 sec. to   67.332 sec.

Spectral model in power-law:
------------------------------------------------------------
Parameters  : value       lower 90%   higher 90%
Photon index: 1.68636     ( -0.13404   0.13626 )
Norm@50keV  : 2.84210E-03    ( -0.000225721   0.000224089 )
------------------------------------------------------------
#Fit statistic : Chi-Squared =          61.52 using 59 PHA bins.
# Reduced chi-squared =          1.079 for     57 degrees of freedom
# Null hypothesis probability =   3.173936e-01

Photon flux (15-150 keV)    in 98.08 sec: 0.375683 ( -0.0293234  0.0293788 ) ph/cm2/s
Energy fluence (15-150 keV)             : 2.58381e-06 ( -2.14787e-07  2.1604e-07 ) ergs/cm2
Cutoff power-law model

Time interval is from  -30.748 sec. to   67.332 sec.
Spectral model in the cutoff power-law:
------------------------------------------------------------
Parameters  : value       lower 90%   higher 90%
Photon index: 1.48920     ( -0.5306   0.25772 )
Epeak [keV] : 130.049      ( -62.922 -130.049 )
Norm@50keV  : 3.57617E-03    ( -0.00105568   0.00293322 )
------------------------------------------------------------
#Fit statistic : Chi-Squared =          61.05 using 59 PHA bins.
# Reduced chi-squared =          1.090 for     56 degrees of freedom
# Null hypothesis probability =   2.994780e-01

Photon flux (15-150 keV)    in 98.08 sec: 0.372114 ( -0.03057  0.030561 ) ph/cm2/s
Energy fluence (15-150 keV)             : 2.5521e-06 ( -2.30311e-07  2.23564e-07 ) ergs/cm2
Band function
Time interval is from  -30.748 sec. to   67.332 sec.

Spectral model in the Band function:
------------------------------------------------------------
Parameters  : value       lower 90%   higher 90%
alpha       : -1.47062   ( -0.288995   0.513 )
beta        : -9.37166    ( 9.37167   19.3717 )
Epeak [keV] : 127.477      ( -53.5951 -127.327 )
Norm@50keV   : 3.62772E-03    ( -0.000985357   0.00231513 )
------------------------------------------------------------
#Fit statistic : Chi-Squared =          61.06 using 59 PHA bins.
# Reduced chi-squared =          1.110 for     55 degrees of freedom
# Null hypothesis probability =   2.674433e-01

Photon flux (15-150 keV)    in 98.08 sec: 0.369814 (    ) ph/cm2/s
Energy fluence (15-150 keV)             : 0 ( 0  0 ) ergs/cm2
Single BB
Spectral model blackbody:
------------------------------------------------------------
Parameters  : value    Lower 90%  Upper 90%
kT [keV]    : 14.5012  (-1.41395  1.54939)
R^2/D10^2   : 4.53521E-02  (-0.0139697   0.0203896)
(R is the radius in km and D10 is the distance to the source in units of 10 kpc)
------------------------------------------------------------
#Fit statistic : Chi-Squared =         111.38 using 59 PHA bins.
# Reduced chi-squared =         1.9540 for     57 degrees of freedom
# Null hypothesis probability =   2.222700e-05

Energy  Fluence     90% Error
[keV]   [erg/cm2]   [erg/cm2]
15- 25  1.968e-07   3.075e-08
25- 50  7.575e-07   8.361e-08
50-150  1.067e-06   1.686e-07
15-150  2.022e-06   1.795e-07
Thermal bremsstrahlung (OTTB)
Spectral model: thermal bremsstrahlung
------------------------------------------------------------
Parameters  : value         Lower 90%    Upper 90%
kT [keV]    : 152.315       (-45.8797      -150.102)
Norm        : 1.53234       (-0.132608     0.167871)
------------------------------------------------------------
#Fit statistic : Chi-Squared =          61.64 using 59 PHA bins.
# Reduced chi-squared =          1.081 for     57 degrees of freedom
# Null hypothesis probability =   3.138538e-01

Energy  Fluence     90% Error
[keV]   [erg/cm2]   [erg/cm2]
15- 25  3.855e-07   3.972e-08
25- 50  7.161e-07   1.337e-07
50-150  1.422e-06   6.080e-07
15-150  2.524e-06   7.106e-07
Double BB
Spectral model: bbodyrad<1> + bbodyrad<2>
------------------------------------------------------------
Parameters  : value         Lower 90%    Upper 90%
kT1 [keV]   : 5.38124        (-1.05534      1.2639)
R1^2/D10^2  : 1.12216        (-0.628519      1.69544)
kT2 [keV]   : 22.0122        (-3.19137      4.59688)
R2^2/D10^2  : 8.37646E-03    (-0.00423936   0.006794)
------------------------------------------------------------
#Fit statistic : Chi-Squared =          57.66 using 59 PHA bins.
# Reduced chi-squared =          1.048 for     55 degrees of freedom
# Null hypothesis probability =   3.770939e-01

Energy  Fluence     90% Error
[keV]   [erg/cm2]   [erg/cm2]
15- 25  4.296e-07   1.426e-07
25- 50  6.671e-07   1.697e-07
50-150  1.426e-06   3.557e-07
15-150  2.523e-06   5.409e-07
Peak spectrum fit
Power-law model

Time interval is from    0.272 sec. to    1.272 sec.

Spectral model in power-law:
------------------------------------------------------------
Parameters  : value       lower 90%   higher 90%
Photon index: 1.49070     ( -0.23948   0.243031 )
Norm@50keV  : 1.76625E-02    ( -0.00250934   0.00249335 )
------------------------------------------------------------
#Fit statistic : Chi-Squared =          46.09 using 59 PHA bins.
# Reduced chi-squared =         0.8085 for     57 degrees of freedom
# Null hypothesis probability =   8.490208e-01

Photon flux (15-150 keV)    in 1 sec: 2.19950 ( -0.314368  0.314974 ) ph/cm2/s
Energy fluence (15-150 keV)             : 1.67813e-07 ( -2.58255e-08  2.59995e-08 ) ergs/cm2
Cutoff power-law model

Time interval is from    0.272 sec. to    1.272 sec.
Spectral model in the cutoff power-law:
------------------------------------------------------------
Parameters  : value       lower 90%   higher 90%
Photon index: 1.49249     ( -0.766193   0.241206 )
Epeak [keV] : 9999.35      ( -9999.36 -9999.36 )
Norm@50keV  : 1.76792E-02    ( -0.0148529   0.0240613 )
------------------------------------------------------------
#Fit statistic : Chi-Squared =          46.09 using 59 PHA bins.
# Reduced chi-squared =         0.8231 for     56 degrees of freedom
# Null hypothesis probability =   8.248326e-01

Photon flux (15-150 keV)    in 1 sec: 2.19949 ( -0.31459  0.31201 ) ph/cm2/s
Energy fluence (15-150 keV)             : 1.67564e-07 ( -2.5503e-08  2.6111e-08 ) ergs/cm2
Band function
Time interval is from    0.272 sec. to    1.272 sec.

Spectral model in the Band function:
------------------------------------------------------------
Parameters  : value       lower 90%   higher 90%
alpha       : -1.01648   ( 1.0071   1.0071 )
beta        : -1.52464    ( 1.52791   0.272114 )
Epeak [keV] : 63.6708      ( -61.9456 -61.9456 )
Norm@50keV   : 3.66701E-02    ( -0.0235064   0 )
------------------------------------------------------------
#Fit statistic : Chi-Squared =          45.98 using 59 PHA bins.
# Reduced chi-squared =         0.8360 for     55 degrees of freedom
# Null hypothesis probability =   8.016572e-01

Photon flux (15-150 keV)    in 1 sec:  (    ) ph/cm2/s
Energy fluence (15-150 keV)             : 0 ( 0  0 ) ergs/cm2
Single BB
Spectral model blackbody:
------------------------------------------------------------
Parameters  : value    Lower 90%  Upper 90%
kT [keV]    : 15.2340  (-2.92013  3.65814)
R^2/D10^2   : 0.234692  (-0.233499   0.259914)
(R is the radius in km and D10 is the distance to the source in units of 10 kpc)
------------------------------------------------------------
#Fit statistic : Chi-Squared =          64.95 using 59 PHA bins.
# Reduced chi-squared =          1.139 for     57 degrees of freedom
# Null hypothesis probability =   2.194507e-01

Energy  Fluence     90% Error
[keV]   [erg/cm2]   [erg/cm2]
15- 25  1.137e-08   3.304e-09
25- 50  4.583e-08   1.039e-08
50-150  7.288e-08   2.004e-08
15-150  1.301e-07   2.822e-08
Thermal bremsstrahlung (OTTB)
Spectral model: thermal bremsstrahlung
------------------------------------------------------------
Parameters  : value         Lower 90%    Upper 90%
kT [keV]    : 199.363       (-77.3067      -199.363)
Norm        : 9.03844       (-1.25787     1.25782)
------------------------------------------------------------
#Fit statistic : Chi-Squared =          47.04 using 59 PHA bins.
# Reduced chi-squared =         0.8252 for     57 degrees of freedom
# Null hypothesis probability =   8.238996e-01

Energy  Fluence     90% Error
[keV]   [erg/cm2]   [erg/cm2]
15- 25  2.251e-08   1.270e-08
25- 50  4.329e-08   2.449e-08
50-150  9.495e-08   5.315e-08
15-150  1.608e-07   9.145e-08
Double BB
Spectral model: bbodyrad<1> + bbodyrad<2>
------------------------------------------------------------
Parameters  : value         Lower 90%    Upper 90%
kT1 [keV]   : 7.49834        (-2.41897      3.37118)
R1^2/D10^2  : 2.07038        (-1.44556      6.13431)
kT2 [keV]   : 35.7154        (-13.7298      -35.7122)
R2^2/D10^2  : 1.02633E-02    (-0.010019   0.0436358)
------------------------------------------------------------
#Fit statistic : Chi-Squared =          45.85 using 59 PHA bins.
# Reduced chi-squared =         0.8336 for     55 degrees of freedom
# Null hypothesis probability =   8.055435e-01

Energy  Fluence     90% Error
[keV]   [erg/cm2]   [erg/cm2]
15- 25  2.180e-08   1.197e-08
25- 50  4.318e-08   2.203e-08
50-150  1.058e-07   5.719e-08
15-150  1.708e-07   8.725e-08
Pre-slew spectrum (Pre-slew PHA with pre-slew DRM)
Power-law model

Spectral model in power-law:
------------------------------------------------------------
Parameters  : value       lower 90%   higher 90%
Photon index: 1.68636     ( -0.13404   0.13626 )
Norm@50keV  : 2.84210E-03    ( -0.000225721   0.000224089 )
------------------------------------------------------------
#Fit statistic : Chi-Squared =          61.52 using 59 PHA bins.
# Reduced chi-squared =          1.079 for     57 degrees of freedom
# Null hypothesis probability =   3.173936e-01

Photon flux (15-150 keV)    in 98.08 sec: 0.375683 ( -0.0293234  0.0293788 ) ph/cm2/s
Energy fluence (15-150 keV)             : 2.58381e-06 ( -2.14787e-07  2.1604e-07 ) ergs/cm2
Cutoff power-law model
Spectral model in the cutoff power-law:
------------------------------------------------------------
Parameters  : value       lower 90%   higher 90%
Photon index: 1.48920     ( -0.5306   0.25772 )
Epeak [keV] : 130.049      ( -62.922 -130.049 )
Norm@50keV  : 3.57617E-03    ( -0.00105568   0.00293322 )
------------------------------------------------------------
#Fit statistic : Chi-Squared =          61.05 using 59 PHA bins.
# Reduced chi-squared =          1.090 for     56 degrees of freedom
# Null hypothesis probability =   2.994780e-01

Photon flux (15-150 keV)    in 98.08 sec: 0.372114 ( -0.03057  0.030561 ) ph/cm2/s
Energy fluence (15-150 keV)             : 2.5521e-06 ( -2.30311e-07  2.21455e-07 ) ergs/cm2
Band function

Spectral model in the Band function:
------------------------------------------------------------
Parameters  : value       lower 90%   higher 90%
alpha       : -1.47062   ( -0.288995   0.513 )
beta        : -9.37166    ( 9.37167   19.3717 )
Epeak [keV] : 127.477      ( -53.5951 -127.327 )
Norm@50keV   : 3.62772E-03    ( -0.000985357   0.00231535 )
------------------------------------------------------------
#Fit statistic : Chi-Squared =          61.06 using 59 PHA bins.
# Reduced chi-squared =          1.110 for     55 degrees of freedom
# Null hypothesis probability =   2.674433e-01

Photon flux (15-150 keV)    in 98.08 sec: 0.369814 (    ) ph/cm2/s
Energy fluence (15-150 keV)             : 0 ( 0  0 ) ergs/cm2
S(25-50 keV) vs. S(50-100 keV) plot
S(25-50 keV)  = 6.95e-07
S(50-100 keV) = 8.64e-07
T90 vs. Hardness ratio plot
T90                                   = 93.2960000038147 sec.
Hardness ratio (energy fluence ratio) = 1.24317
Color vs. Color plot
Count Ratio  (25-50 keV) / (15-25 keV) = 1.2348
Count Ratio (50-100 keV) / (15-25 keV) = 0.975835
Mask shadow pattern
IMX = 5.984960676384176E-01, IMY = 6.822030126724233E-01
TIME vs. PHA plot around the trigger time
Blue+Cyan dotted lines: Time interval of the scaled map
From 0.000000 to 1.024000
TIME vs. DetID plot around the trigger time
Blue+Cyan dotted lines: Time interval of the scaled map
From 0.000000 to 1.024000
100 us light curve (15-350 keV)
Blue+Cyan dotted lines: Time interval of the scaled map
From 0.000000 to 1.024000
Spacecraft aspect plot

Bright source in the pre-burst/pre-slew/post-slew images
Pre-burst image of 15-350 keV band
Time interval of the image:
-299.560000 -30.748000

# RAcent  DECcent POSerr Theta    Phi  PeakCts   SNR AngSep     Name
#  [deg]    [deg]    ['] [deg]  [deg]                   [']
210.9442  61.9657    2.9  49.5  148.6   2.8386   3.9 ------	UNKNOWN
238.1786  46.4328    2.7  53.0  176.5   2.2318   4.3 ------	UNKNOWN
243.1856  43.7814    2.6  55.8 -179.3   3.3905   4.5 ------	UNKNOWN
217.9668  23.4449    2.6  31.2 -156.0   0.7980   4.4 ------	UNKNOWN
211.8578   2.5366    2.6  29.0 -112.1   1.0120   4.4 ------	UNKNOWN
159.2936 -35.5459    2.5  57.1  -21.2   3.3407   4.6 ------	UNKNOWN
161.1313 -38.3826    2.9  58.9  -24.3   4.6001   4.0 ------	UNKNOWN
Pre-slew background subtracted image of 15-350 keV band
Time interval of the image:
-30.748000 67.332000

# RAcent  DECcent POSerr Theta    Phi  PeakCts   SNR AngSep     Name
#  [deg]    [deg]    ['] [deg]  [deg]                   [']
152.2483 -18.9546    2.5  47.9   -2.0   0.9584   4.6 ------	UNKNOWN
208.5478  15.1787    1.9  22.0 -138.2   0.6363   6.1 ------	UNKNOWN
187.2454 -26.3915    0.6  42.2  -48.7   4.3985  18.0 ------	UNKNOWN
235.4889   7.9571    2.5  49.2 -133.6   2.2982   4.7 ------	UNKNOWN
Post-slew image of 15-350 keV band
Time interval of the image:
Plot creation:
Sun May 31 15:09:16 EDT 2015