Special notes of this burst
Image
Pre-slew 15.0-350.0 keV image (Event data)

#   RAcent    DECcent   POSerr    Theta     Phi              Peak Cts       SNR   Name
  228.4007    30.8644   0.0058    29.1923  -141.9249         3.4115537     33.112 TRIG_00164268

Foreground time interval of the image:
-29.656  35.765 (delta_t =  65.421 [sec])
Background time interval of the image:
-299.936 -29.656 (delta_t = 270.280 [sec])
Lightcurves
Notes:
- 1) The mask-weighted light curves are using the flight position.
- 2) Multiple plots of different time binning/intervals are shown to cover all scenarios of short/long GRBs, rate/image triggers, and real/false positives.
- 3) For all the mask-weighted lightcurves, the y-axis units are counts/sec/det where a det is 0.4 x 0.4 = 0.16 sq cm.
- 4) The verticle lines correspond to following: green dotted lines are T50 interval, black dotted lines are T90 interval, blue solid line(s) is a spacecraft slew start time, and orange solid line(s) is a spacecraft slew end time.
- 5) Time of each bin is in the middle of the bin.
1 s binning
From T0-310 s to T0+310 s

From T100_start - 20 s to T100_end + 30 s

Full time interval

64 ms binning
Full time interval
From T100_start to T100_end

From T0-5 sec to T0+5 sec
16 ms binning
From T100_start-5 s to T100_start+5 s

Blue+Cyan dotted lines: Time interval of the scaled map
From 0.000000 to 4.096000
8 ms binning
From T100_start-3 s to T100_start+3 s
Blue+Cyan dotted lines: Time interval of the scaled map
From 0.000000 to 4.096000
2 ms binning
From T100_start-1 s to T100_start+1 s

Blue+Cyan dotted lines: Time interval of the scaled map
From 0.000000 to 4.096000
SN=5 or 10 sec. binning (whichever binning is satisfied first)

SN=5 or 10 sec. binning (T < 200 sec)

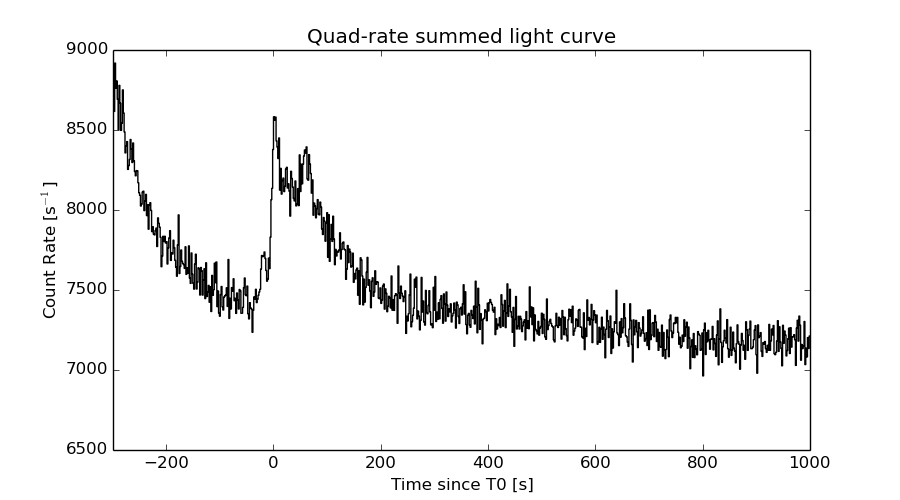
Quad-rate summed light curves (from T0-300s to T0+1000s)
Spectral Evolution

Spectra
Notes:
- 1) The fitting includes the systematic errors.
- 2) When the burst includes telescope slew time periods, the fitting uses an average response file made from multiple 5-s response files through out the slew time plus single time preiod for the non-slew times, and weighted by the total counts in the corresponding time period using addrmf. An average response file is needed becuase a spectral fit using the pre-slew DRM will introduce some errors in both a spectral shape and a normalization if the PHA file contains a lot of the slew/post-slew time interval.
- 3) For fits to more complicated models (e.g. a power-law over a cutoff power-law), the BAT team has decided to require a chi-square improvement of more than 6 for each extra dof.
Time averaged spectrum fit using the average DRM
Power-law model

Time interval is from  -29.656 sec. to  156.396 sec.

Spectral model in power-law:
------------------------------------------------------------
Parameters  : value       lower 90%   higher 90%
Photon index: 1.81721     ( -0.0656423   0.0662228 )
Norm@50keV  : 2.57955E-03    ( -9.01797e-05   8.98487e-05 )
------------------------------------------------------------
#Fit statistic : Chi-Squared =          52.23 using 59 PHA bins.
# Reduced chi-squared =         0.9164 for     57 degrees of freedom
# Null hypothesis probability =   6.541935e-01

Photon flux (15-150 keV)    in 186.1 sec: 0.357856 ( -0.0127216  0.0127662 ) ph/cm2/s
Energy fluence (15-150 keV)             : 4.41701e-06 ( -1.56802e-07  1.57368e-07 ) ergs/cm2
Cutoff power-law model

Time interval is from  -29.656 sec. to  156.396 sec.
Spectral model in the cutoff power-law:
------------------------------------------------------------
Parameters  : value       lower 90%   higher 90%
Photon index: 1.52916     ( -0.278118   0.260995 )
Epeak [keV] : 80.3762      ( -18.321 224.93 )
Norm@50keV  : 3.59485E-03    ( -0.000912218   0.00132575 )
------------------------------------------------------------
#Fit statistic : Chi-Squared =          48.67 using 59 PHA bins.
# Reduced chi-squared =         0.8691 for     56 degrees of freedom
# Null hypothesis probability =   7.459396e-01

Photon flux (15-150 keV)    in 186.1 sec: 0.349716 ( -0.014521  0.014593 ) ph/cm2/s
Energy fluence (15-150 keV)             : 4.30005e-06 ( -1.89282e-07  1.89059e-07 ) ergs/cm2
Band function

Time interval is from  -29.656 sec. to  156.396 sec.

Spectral model in the Band function:
------------------------------------------------------------
Parameters  : value       lower 90%   higher 90%
alpha       : -1.52915   ( -0.224902   0.258274 )
beta        : -10.0000    ( 10   7.10543e-15 )
Epeak [keV] : 80.3616      ( -15.8483 222.867 )
Norm@50keV   : 3.59422E-03    ( -0.000912079   0.00132576 )
------------------------------------------------------------
#Fit statistic : Chi-Squared =          48.67 using 59 PHA bins.
# Reduced chi-squared =         0.8849 for     55 degrees of freedom
# Null hypothesis probability =   7.137188e-01

Photon flux (15-150 keV)    in 186.1 sec: 0.350454 (    ) ph/cm2/s
Energy fluence (15-150 keV)             : 0 ( 0  0 ) ergs/cm2
Single BB

Spectral model blackbody:
------------------------------------------------------------
Parameters  : value    Lower 90%  Upper 90%
kT [keV]    : 12.9884  (  )
R^2/D10^2   : 6.01519E-02  (   )
(R is the radius in km and D10 is the distance to the source in units of 10 kpc)
------------------------------------------------------------
#Fit statistic : Chi-Squared =         226.85 using 59 PHA bins.
# Reduced chi-squared =         3.9799 for     57 degrees of freedom
# Null hypothesis probability =   4.020183e-22

Energy  Fluence     90% Error
[keV]   [erg/cm2]   [erg/cm2]
15- 25  4.005e-07   2.429e-08
25- 50  1.378e-06   5.555e-08
50-150  1.469e-06   1.128e-07
15-150  3.248e-06   1.210e-07
Thermal bremsstrahlung (OTTB)

Spectral model: thermal bremsstrahlung
------------------------------------------------------------
Parameters  : value         Lower 90%    Upper 90%
kT [keV]    : 110.930       (-17.0166      15.6708)
Norm        : 1.49602       (-0.06751     0.0950192)
------------------------------------------------------------
#Fit statistic : Chi-Squared =          50.97 using 59 PHA bins.
# Reduced chi-squared =         0.8942 for     57 degrees of freedom
# Null hypothesis probability =   6.995542e-01

Energy  Fluence     90% Error
[keV]   [erg/cm2]   [erg/cm2]
15- 25  7.269e-07   5.062e-08
25- 50  1.282e-06   6.160e-08
50-150  2.199e-06   5.284e-07
15-150  4.208e-06   5.732e-07
Double BB

Spectral model: bbodyrad<1> + bbodyrad<2>
------------------------------------------------------------
Parameters  : value         Lower 90%    Upper 90%
kT1 [keV]   : 5.90001        (-0.821781      0.960074)
R1^2/D10^2  : 0.737938        (-0.307584      0.597773)
kT2 [keV]   : 20.6053        (-2.18179      3.10392)
R2^2/D10^2  : 8.67655E-03    (-0.00369726   0.00494873)
------------------------------------------------------------
#Fit statistic : Chi-Squared =          58.74 using 59 PHA bins.
# Reduced chi-squared =          1.068 for     55 degrees of freedom
# Null hypothesis probability =   3.402293e-01

Energy  Fluence     90% Error
[keV]   [erg/cm2]   [erg/cm2]
15- 25  7.504e-07   9.956e-08
25- 50  1.259e-06   9.770e-08
50-150  2.146e-06   2.038e-07
15-150  4.155e-06   3.154e-07
Peak spectrum fit
Power-law model

Time interval is from    2.624 sec. to    3.624 sec.

Spectral model in power-law:
------------------------------------------------------------
Parameters  : value       lower 90%   higher 90%
Photon index: 2.00733     ( -0.288819   0.315697 )
Norm@50keV  : 6.06592E-03    ( -0.00135753   0.00132629 )
------------------------------------------------------------
#Fit statistic : Chi-Squared =          50.93 using 59 PHA bins.
# Reduced chi-squared =         0.8935 for     57 degrees of freedom
# Null hypothesis probability =   7.008692e-01

Photon flux (15-150 keV)    in 1 sec: 0.912966 ( -0.156052  0.156055 ) ph/cm2/s
Energy fluence (15-150 keV)             : 5.5956e-08 ( -1.15368e-08  1.2025e-08 ) ergs/cm2
Cutoff power-law model

Time interval is from    2.624 sec. to    3.624 sec.
Spectral model in the cutoff power-law:
------------------------------------------------------------
Parameters  : value       lower 90%   higher 90%
Photon index: 0.326552     ( -2.62041   1.43381 )
Epeak [keV] : 38.0715      ( -13.1916 18.6167 )
Norm@50keV  : 6.42824E-02    ( -0.0649152   3.32188 )
------------------------------------------------------------
#Fit statistic : Chi-Squared =          46.62 using 59 PHA bins.
# Reduced chi-squared =         0.8324 for     56 degrees of freedom
# Null hypothesis probability =   8.099463e-01

Photon flux (15-150 keV)    in 1 sec: 0.878559 ( -0.156563  0.157421 ) ph/cm2/s
Energy fluence (15-150 keV)             : 4.81511e-08 ( -1.13698e-08  1.31449e-08 ) ergs/cm2
Band function

Time interval is from    2.624 sec. to    3.624 sec.

Spectral model in the Band function:
------------------------------------------------------------
Parameters  : value       lower 90%   higher 90%
alpha       : 1.58811   ( -2.97076   -1.60181 )
beta        : -2.79118    ( 2.80457   0.734102 )
Epeak [keV] : 32.0449      ( -8.4704 17.3486 )
Norm@50keV   : 1.45770    ( -1.56732   183.356 )
------------------------------------------------------------
#Fit statistic : Chi-Squared =          45.53 using 59 PHA bins.
# Reduced chi-squared =         0.8278 for     55 degrees of freedom
# Null hypothesis probability =   8.148873e-01

Photon flux (15-150 keV)    in 1 sec: 0.883115 ( 6.11688  -0.160246 ) ph/cm2/s
Energy fluence (15-150 keV)             : 4.80666e-08 ( -4.80596e-08  -1.14307e-08 ) ergs/cm2
Single BB

Spectral model blackbody:
------------------------------------------------------------
Parameters  : value    Lower 90%  Upper 90%
kT [keV]    : 9.06765  (-1.49531  1.89277)
R^2/D10^2   : 0.649315  (-0.338382   0.656025)
(R is the radius in km and D10 is the distance to the source in units of 10 kpc)
------------------------------------------------------------
#Fit statistic : Chi-Squared =          48.53 using 59 PHA bins.
# Reduced chi-squared =         0.8513 for     57 degrees of freedom
# Null hypothesis probability =   7.803695e-01

Energy  Fluence     90% Error
[keV]   [erg/cm2]   [erg/cm2]
15- 25  1.043e-08   3.116e-09
25- 50  2.244e-08   5.710e-09
50-150  8.758e-09   4.201e-09
15-150  4.163e-08   1.149e-08
Thermal bremsstrahlung (OTTB)

Spectral model: thermal bremsstrahlung
------------------------------------------------------------
Parameters  : value         Lower 90%    Upper 90%
kT [keV]    : 59.0904       (-21.844      44.9961)
Norm        : 4.91259       (-1.18526     1.56563)
------------------------------------------------------------
#Fit statistic : Chi-Squared =          47.74 using 59 PHA bins.
# Reduced chi-squared =         0.8375 for     57 degrees of freedom
# Null hypothesis probability =   8.040544e-01

Energy  Fluence     90% Error
[keV]   [erg/cm2]   [erg/cm2]
15- 25  1.232e-08   2.781e-09
25- 50  1.866e-08   4.045e-09
50-150  2.096e-08   1.097e-08
15-150  5.193e-08   1.580e-08
Double BB

Spectral model: bbodyrad<1> + bbodyrad<2>
------------------------------------------------------------
Parameters  : value         Lower 90%    Upper 90%
kT1 [keV]   : 6.90124        (-4.08914      2.52806)
R1^2/D10^2  : 1.35374        (-0.797793      8.26433)
kT2 [keV]   : 18.0724        (-15.9422      -19.0911)
R2^2/D10^2  : 2.10291E-02    (-0.0167831   0.530392)
------------------------------------------------------------
#Fit statistic : Chi-Squared =          45.54 using 59 PHA bins.
# Reduced chi-squared =         0.8281 for     55 degrees of freedom
# Null hypothesis probability =   8.145203e-01

Energy  Fluence     90% Error
[keV]   [erg/cm2]   [erg/cm2]
15- 25  1.158e-08   7.190e-09
25- 50  1.996e-08   1.187e-08
50-150  1.726e-08   1.174e-08
15-150  4.880e-08   2.709e-08
Pre-slew spectrum (Pre-slew PHA with pre-slew DRM)
Power-law model

Spectral model in power-law:
------------------------------------------------------------
Parameters  : value       lower 90%   higher 90%
Photon index: 1.83965     ( -0.0849474   0.0861366 )
Norm@50keV  : 3.39985E-03    ( -0.000166749   0.000165631 )
------------------------------------------------------------
#Fit statistic : Chi-Squared =          48.90 using 59 PHA bins.
# Reduced chi-squared =         0.8579 for     57 degrees of freedom
# Null hypothesis probability =   7.686493e-01

Photon flux (15-150 keV)    in 65.42 sec: 0.475888 ( -0.0220116  0.022058 ) ph/cm2/s
Energy fluence (15-150 keV)             : 2.04542e-06 ( -1.01029e-07  1.01635e-07 ) ergs/cm2
Cutoff power-law model

Spectral model in the cutoff power-law:
------------------------------------------------------------
Parameters  : value       lower 90%   higher 90%
Photon index: 1.42281     ( -0.375009   0.344032 )
Epeak [keV] : 64.6763      ( -12.664 76.3219 )
Norm@50keV  : 5.63004E-03    ( -0.00187781   0.00317561 )
------------------------------------------------------------
#Fit statistic : Chi-Squared =          44.56 using 59 PHA bins.
# Reduced chi-squared =         0.7956 for     56 degrees of freedom
# Null hypothesis probability =   8.645922e-01

Photon flux (15-150 keV)    in 65.42 sec: 0.463409 ( -0.024125  0.024159 ) ph/cm2/s
Energy fluence (15-150 keV)             : 1.96537e-06 ( -1.19934e-07  1.20504e-07 ) ergs/cm2
Band function

Spectral model in the Band function:
------------------------------------------------------------
Parameters  : value       lower 90%   higher 90%
alpha       : -1.31407   ( -0.429651   3.48603 )
beta        : -2.13143    ( 2.1412   0.292543 )
Epeak [keV] : 57.1120      ( -32.1698 63.4759 )
Norm@50keV   : 6.57523E-03    ( -0.0028374   3.38597 )
------------------------------------------------------------
#Fit statistic : Chi-Squared =          44.16 using 59 PHA bins.
# Reduced chi-squared =         0.8030 for     55 degrees of freedom
# Null hypothesis probability =   8.520707e-01

Photon flux (15-150 keV)    in 65.42 sec: 0.462305 ( 6.5377  -0.024196 ) ph/cm2/s
Energy fluence (15-150 keV)             : 1.96904e-06 ( -1.96858e-06  -1.18364e-07 ) ergs/cm2
S(25-50 keV) vs. S(50-100 keV) plot

S(25-50 keV)  = 1.25e-06
S(50-100 keV) = 1.42e-06
T90 vs. Hardness ratio plot
T90                                   = 140.632000029087 sec.
Hardness ratio (energy fluence ratio) = 1.136
Color vs. Color plot

Count Ratio  (25-50 keV) / (15-25 keV) = 1.09543
Count Ratio (50-100 keV) / (15-25 keV) = 0.683101
Mask shadow pattern

IMX = -4.398140455239909E-01, IMY = 3.445492376837285E-01
TIME vs. PHA plot around the trigger time
Blue+Cyan dotted lines: Time interval of the scaled map
From 0.000000 to 4.096000
TIME vs. DetID plot around the trigger time
Blue+Cyan dotted lines: Time interval of the scaled map
From 0.000000 to 4.096000
100 us light curve (15-350 keV)

Blue+Cyan dotted lines: Time interval of the scaled map
From 0.000000 to 4.096000
Spacecraft aspect plot
Bright source in the pre-burst/pre-slew/post-slew images
Pre-burst image of 15-350 keV band
Time interval of the image:
-299.936000 -29.656000

# RAcent  DECcent POSerr Theta    Phi  PeakCts   SNR AngSep     Name
#  [deg]    [deg]    ['] [deg]  [deg]                   [']
254.5086  35.4043    6.7  50.5 -152.3  -0.8646  -1.7    4.5	Her X-1
169.6188 -22.1344    3.1  55.7   -9.3   2.4631   3.7 ------	UNKNOWN
Pre-slew background subtracted image of 15-350 keV band
Time interval of the image:
-29.656000 35.764600

# RAcent  DECcent POSerr Theta    Phi  PeakCts   SNR AngSep     Name
#  [deg]    [deg]    ['] [deg]  [deg]                   [']
254.4769  35.3833   10.3  50.5 -152.3   0.2500   1.1    2.6	Her X-1
228.4007  30.8644    0.3  29.2 -141.9   3.4116  33.1 ------	UNKNOWN
196.5931 -24.7475    2.4  52.7  -39.9   2.0013   4.8 ------	UNKNOWN
Post-slew image of 15-350 keV band
Time interval of the image:
95.964600 302.144400

# RAcent  DECcent POSerr Theta    Phi  PeakCts   SNR AngSep     Name
#  [deg]    [deg]    ['] [deg]  [deg]                   [']
254.4461  35.2026   14.9  22.2  167.3   0.1182   0.8    8.4	Her X-1
268.3722  -1.4527  129.6  49.9 -141.6   0.0500   0.1    0.3	SW J1753.5-0127
228.4136  30.8595    0.8   0.0 -135.2   2.0353  14.1 ------	UNKNOWN
205.7297  10.7416    2.4  29.1  -33.4   0.8583   4.9 ------	UNKNOWN
Plot creation:
Sun May 31 15:07:39 EDT 2015