Special notes of this burst
Image
Pre-slew 15.0-350.0 keV image (Event data)

#   RAcent    DECcent   POSerr    Theta     Phi              Peak Cts       SNR   Name
   85.2100   -19.2841   0.0230    29.6625   166.3031         0.2972575      8.382 TRIG_00164279

Foreground time interval of the image:
  1.388  10.996 (delta_t =   9.608 [sec])
Background time interval of the image:
-141.371   1.388 (delta_t = 142.759 [sec])
Lightcurves
Notes:
- 1) The mask-weighted light curves are using the flight position.
- 2) Multiple plots of different time binning/intervals are shown to cover all scenarios of short/long GRBs, rate/image triggers, and real/false positives.
- 3) For all the mask-weighted lightcurves, the y-axis units are counts/sec/det where a det is 0.4 x 0.4 = 0.16 sq cm.
- 4) The verticle lines correspond to following: green dotted lines are T50 interval, black dotted lines are T90 interval, blue solid line(s) is a spacecraft slew start time, and orange solid line(s) is a spacecraft slew end time.
- 5) Time of each bin is in the middle of the bin.
1 s binning
From T0-310 s to T0+310 s

From T100_start - 20 s to T100_end + 30 s
Full time interval

64 ms binning
Full time interval

From T100_start to T100_end

From T0-5 sec to T0+5 sec

16 ms binning
From T100_start-5 s to T100_start+5 s
Blue+Cyan dotted lines: Time interval of the scaled map
From 0.000000 to 5.504000
8 ms binning
From T100_start-3 s to T100_start+3 s
Blue+Cyan dotted lines: Time interval of the scaled map
From 0.000000 to 5.504000
2 ms binning
From T100_start-1 s to T100_start+1 s
Blue+Cyan dotted lines: Time interval of the scaled map
From 0.000000 to 5.504000
SN=5 or 10 sec. binning (whichever binning is satisfied first)

SN=5 or 10 sec. binning (T < 200 sec)

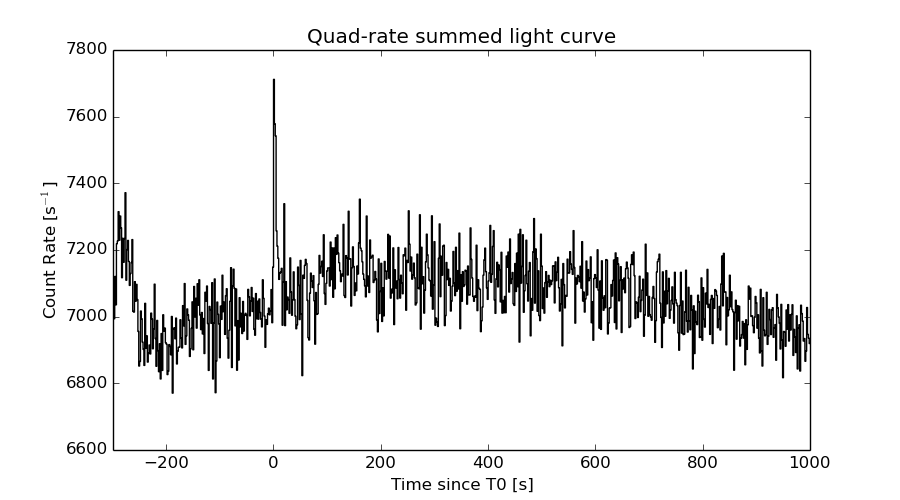
Quad-rate summed light curves (from T0-300s to T0+1000s)
Spectral Evolution

Spectra
Notes:
- 1) The fitting includes the systematic errors.
- 2) When the burst includes telescope slew time periods, the fitting uses an average response file made from multiple 5-s response files through out the slew time plus single time preiod for the non-slew times, and weighted by the total counts in the corresponding time period using addrmf. An average response file is needed becuase a spectral fit using the pre-slew DRM will introduce some errors in both a spectral shape and a normalization if the PHA file contains a lot of the slew/post-slew time interval.
- 3) For fits to more complicated models (e.g. a power-law over a cutoff power-law), the BAT team has decided to require a chi-square improvement of more than 6 for each extra dof.
Time averaged spectrum fit using the average DRM
Power-law model

Time interval is from    1.388 sec. to   10.996 sec.

Spectral model in power-law:
------------------------------------------------------------
Parameters  : value       lower 90%   higher 90%
Photon index: 1.54418     ( -0.298578   0.308104 )
Norm@50keV  : 1.93043E-03    ( -0.000373888   0.000368562 )
------------------------------------------------------------
#Fit statistic : Chi-Squared =          79.51 using 59 PHA bins.
# Reduced chi-squared =          1.395 for     57 degrees of freedom
# Null hypothesis probability =   2.609332e-02

Photon flux (15-150 keV)    in 9.608 sec: 0.243971 ( -0.0446218  0.0446717 ) ph/cm2/s
Energy fluence (15-150 keV)             : 1.74755e-07 ( -3.62261e-08  3.70878e-08 ) ergs/cm2
Cutoff power-law model

Time interval is from    1.388 sec. to   10.996 sec.
Spectral model in the cutoff power-law:
------------------------------------------------------------
Parameters  : value       lower 90%   higher 90%
Photon index: 0.533521     ( -1.47654   1.10881 )
Epeak [keV] : 70.7541      ( -21.4078 -70.8532 )
Norm@50keV  : 6.41701E-03    ( -0.00639309   0.028483 )
------------------------------------------------------------
#Fit statistic : Chi-Squared =          77.15 using 59 PHA bins.
# Reduced chi-squared =          1.378 for     56 degrees of freedom
# Null hypothesis probability =   3.201021e-02

Photon flux (15-150 keV)    in 9.608 sec: 0.235591 ( -0.045491  0.045562 ) ph/cm2/s
Energy fluence (15-150 keV)             : 1.63589e-07 ( -3.70091e-08  3.89374e-08 ) ergs/cm2
Band function

Time interval is from    1.388 sec. to   10.996 sec.

Spectral model in the Band function:
------------------------------------------------------------
Parameters  : value       lower 90%   higher 90%
alpha       : -0.535772   ( -1.0833   1.52844 )
beta        : -10.0000    ( 10   7.10543e-15 )
Epeak [keV] : 70.8322      ( -21.6859 405.856 )
Norm@50keV   : 6.39872E-03    ( -0.00639863   0.0284294 )
------------------------------------------------------------
#Fit statistic : Chi-Squared =          77.15 using 59 PHA bins.
# Reduced chi-squared =          1.403 for     55 degrees of freedom
# Null hypothesis probability =   2.605637e-02

Photon flux (15-150 keV)    in 9.608 sec: 0.238425 ( 6.76157  -0.047264 ) ph/cm2/s
Energy fluence (15-150 keV)             : 1.74386e-07 ( -1.74319e-07  -5.13567e-08 ) ergs/cm2
Single BB

Spectral model blackbody:
------------------------------------------------------------
Parameters  : value    Lower 90%  Upper 90%
kT [keV]    : 14.8541  (-3.05332  3.78117)
R^2/D10^2   : 2.93601E-02  (-0.0161043   0.0364259)
(R is the radius in km and D10 is the distance to the source in units of 10 kpc)
------------------------------------------------------------
#Fit statistic : Chi-Squared =          81.63 using 59 PHA bins.
# Reduced chi-squared =          1.432 for     57 degrees of freedom
# Null hypothesis probability =   1.787821e-02

Energy  Fluence     90% Error
[keV]   [erg/cm2]   [erg/cm2]
15- 25  1.305e-08   4.716e-09
25- 50  5.139e-08   1.555e-08
50-150  7.683e-08   2.999e-08
15-150  1.413e-07   4.100e-08
Thermal bremsstrahlung (OTTB)

Spectral model: thermal bremsstrahlung
------------------------------------------------------------
Parameters  : value         Lower 90%    Upper 90%
kT [keV]    : 186.196       (-100.917      -184.34)
Norm        : 1.00535       (-0.184073     0.221152)
------------------------------------------------------------
#Fit statistic : Chi-Squared =          78.23 using 59 PHA bins.
# Reduced chi-squared =          1.372 for     57 degrees of freedom
# Null hypothesis probability =   3.252377e-02

Energy  Fluence     90% Error
[keV]   [erg/cm2]   [erg/cm2]
15- 25  2.426e-08   1.400e-08
25- 50  4.629e-08   2.583e-08
50-150  9.919e-08   5.616e-08
15-150  1.697e-07   9.449e-08
Double BB

Spectral model: bbodyrad<1> + bbodyrad<2>
------------------------------------------------------------
Parameters  : value         Lower 90%    Upper 90%
kT1 [keV]   : 5.75068        (-2.54141      4.24456)
R1^2/D10^2  : 0.428448        (-0.365166      3.99406)
kT2 [keV]   : 20.3074        (-5.4469      11.4095)
R2^2/D10^2  : 8.12972E-03    (-0.00669756   0.0184231)
------------------------------------------------------------
#Fit statistic : Chi-Squared =          75.74 using 59 PHA bins.
# Reduced chi-squared =          1.377 for     55 degrees of freedom
# Null hypothesis probability =   3.330815e-02

Energy  Fluence     90% Error
[keV]   [erg/cm2]   [erg/cm2]
15- 25  2.315e-08   1.338e-08
25- 50  4.646e-08   2.424e-08
50-150  9.630e-08   5.938e-08
15-150  1.659e-07   8.931e-08
Peak spectrum fit
Power-law model

Time interval is from    1.440 sec. to    2.440 sec.

Spectral model in power-law:
------------------------------------------------------------
Parameters  : value       lower 90%   higher 90%
Photon index: 1.50821     ( -0.432223   0.455726 )
Norm@50keV  : 4.02066E-03    ( -0.00117095   0.00115388 )
------------------------------------------------------------
#Fit statistic : Chi-Squared =          87.71 using 59 PHA bins.
# Reduced chi-squared =          1.539 for     57 degrees of freedom
# Null hypothesis probability =   5.562921e-03

Photon flux (15-150 keV)    in 1 sec: 0.503044 ( -0.140241  0.140575 ) ph/cm2/s
Energy fluence (15-150 keV)             : 3.80947e-08 ( -1.1751e-08  1.21421e-08 ) ergs/cm2
Cutoff power-law model

Time interval is from    1.440 sec. to    2.440 sec.
Spectral model in the cutoff power-law:
------------------------------------------------------------
Parameters  : value       lower 90%   higher 90%
Photon index: -1.33850     ( 1.39187   2.55782 )
Epeak [keV] : 59.9449      ( -13.4611 63.4237 )
Norm@50keV  : 9.50769E-02    ( -0.106074   985.823 )
------------------------------------------------------------
#Fit statistic : Chi-Squared =          83.70 using 59 PHA bins.
# Reduced chi-squared =          1.495 for     56 degrees of freedom
# Null hypothesis probability =   9.639391e-03

Photon flux (15-150 keV)    in 1 sec: 0.449387 ( -0.218136  0.152634 ) ph/cm2/s
Energy fluence (15-150 keV)             : 3.35725e-08 ( -1.27431e-08  1.23265e-08 ) ergs/cm2
Band function

Time interval is from    1.440 sec. to    2.440 sec.

Spectral model in the Band function:
------------------------------------------------------------
Parameters  : value       lower 90%   higher 90%
alpha       : 1.19010   ( -1.86662   -0.606145 )
beta        : -10.0000    ( 10   3.55271e-15 )
Epeak [keV] : 60.5798      ( -14.1452 63.4375 )
Norm@50keV   : 8.18889E-02    ( -0.0818942   4.47226 )
------------------------------------------------------------
#Fit statistic : Chi-Squared =          83.71 using 59 PHA bins.
# Reduced chi-squared =          1.522 for     55 degrees of freedom
# Null hypothesis probability =   7.565896e-03

Photon flux (15-150 keV)    in 1 sec:  (    ) ph/cm2/s
Energy fluence (15-150 keV)             : 0 ( 0  0 ) ergs/cm2
Single BB

Spectral model blackbody:
------------------------------------------------------------
Parameters  : value    Lower 90%  Upper 90%
kT [keV]    : 15.3559  (-3.3554  4.52538)
R^2/D10^2   : 5.83972E-02  (-0.035401   0.0799596)
(R is the radius in km and D10 is the distance to the source in units of 10 kpc)
------------------------------------------------------------
#Fit statistic : Chi-Squared =          83.51 using 59 PHA bins.
# Reduced chi-squared =          1.465 for     57 degrees of freedom
# Null hypothesis probability =   1.262797e-02

Energy  Fluence     90% Error
[keV]   [erg/cm2]   [erg/cm2]
15- 25  2.871e-09   1.544e-09
25- 50  1.165e-08   7.005e-09
50-150  1.889e-08   1.203e-08
15-150  3.342e-08   1.752e-08
Thermal bremsstrahlung (OTTB)

Spectral model: thermal bremsstrahlung
------------------------------------------------------------
Parameters  : value         Lower 90%    Upper 90%
kT [keV]    : 182.460       (-116.671      -183.476)
Norm        : 2.09976       (-0.578238     0.711683)
------------------------------------------------------------
#Fit statistic : Chi-Squared =          86.71 using 59 PHA bins.
# Reduced chi-squared =          1.521 for     57 degrees of freedom
# Null hypothesis probability =   6.796114e-03

Energy  Fluence     90% Error
[keV]   [erg/cm2]   [erg/cm2]
15- 25  5.287e-09   3.142e-09
25- 50  1.006e-08   5.930e-09
50-150  2.141e-08   1.287e-08
15-150  3.676e-08   2.235e-08
Double BB

Spectral model: bbodyrad<1> + bbodyrad<2>
------------------------------------------------------------
Parameters  : value         Lower 90%    Upper 90%
kT1 [keV]   : 3.49264        (-3.46434      196.422)
R1^2/D10^2  : 3.85964        (-4.12639      -4.12639)
kT2 [keV]   : 16.4586        (-3.88905      4.66891)
R2^2/D10^2  : 4.34835E-02    (-0.0448781   0.0762369)
------------------------------------------------------------
#Fit statistic : Chi-Squared =          82.74 using 59 PHA bins.
# Reduced chi-squared =          1.504 for     55 degrees of freedom
# Null hypothesis probability =   9.156042e-03

Energy  Fluence     90% Error
[keV]   [erg/cm2]   [erg/cm2]
15- 25  4.168e-09   1.983e-09
25- 50  1.085e-08   6.475e-09
50-150  1.995e-08   1.272e-08
15-150  3.496e-08   2.065e-08
Pre-slew spectrum (Pre-slew PHA with pre-slew DRM)
Power-law model

Spectral model in power-law:
------------------------------------------------------------
Parameters  : value       lower 90%   higher 90%
Photon index: 1.54418     ( -0.298578   0.308104 )
Norm@50keV  : 1.93043E-03    ( -0.000373888   0.000368562 )
------------------------------------------------------------
#Fit statistic : Chi-Squared =          79.51 using 59 PHA bins.
# Reduced chi-squared =          1.395 for     57 degrees of freedom
# Null hypothesis probability =   2.609332e-02

Photon flux (15-150 keV)    in 9.608 sec: 0.243971 ( -0.0446218  0.0446717 ) ph/cm2/s
Energy fluence (15-150 keV)             : 1.74755e-07 ( -3.62261e-08  3.70878e-08 ) ergs/cm2
Cutoff power-law model

Spectral model in the cutoff power-law:
------------------------------------------------------------
Parameters  : value       lower 90%   higher 90%
Photon index: 0.533521     ( -1.47654   1.10881 )
Epeak [keV] : 70.7541      ( -21.4078 -70.8532 )
Norm@50keV  : 6.41701E-03    ( -0.00639309   0.028483 )
------------------------------------------------------------
#Fit statistic : Chi-Squared =          77.15 using 59 PHA bins.
# Reduced chi-squared =          1.378 for     56 degrees of freedom
# Null hypothesis probability =   3.201021e-02

Photon flux (15-150 keV)    in 9.608 sec: 0.235591 ( -0.045491  0.045562 ) ph/cm2/s
Energy fluence (15-150 keV)             : 1.63589e-07 ( -3.70091e-08  3.89374e-08 ) ergs/cm2
Band function

Spectral model in the Band function:
------------------------------------------------------------
Parameters  : value       lower 90%   higher 90%
alpha       : -0.537586   ( -1.04003   1.56211 )
beta        : -10.0000    ( 10   2.4869e-14 )
Epeak [keV] : 70.8880      ( -21.7413 409.395 )
Norm@50keV   : 6.38401E-03    ( -0.00638392   0.0284441 )
------------------------------------------------------------
#Fit statistic : Chi-Squared =          77.15 using 59 PHA bins.
# Reduced chi-squared =          1.403 for     55 degrees of freedom
# Null hypothesis probability =   2.605636e-02

Photon flux (15-150 keV)    in 9.608 sec: 0.238425 ( 6.76157  -0.047264 ) ph/cm2/s
Energy fluence (15-150 keV)             : 1.74386e-07 ( -1.74319e-07  -5.13567e-08 ) ergs/cm2
S(25-50 keV) vs. S(50-100 keV) plot

S(25-50 keV)  = 4.41e-08
S(50-100 keV) = 6.06e-08
T90 vs. Hardness ratio plot

T90                                   = 9.02000001072884 sec.
Hardness ratio (energy fluence ratio) = 1.37415
Color vs. Color plot

Count Ratio  (25-50 keV) / (15-25 keV) = 1.57539
Count Ratio (50-100 keV) / (15-25 keV) = 1.35406
Mask shadow pattern

IMX = -5.533267425423501E-01, IMY = -1.348543697746188E-01
TIME vs. PHA plot around the trigger time

Blue+Cyan dotted lines: Time interval of the scaled map
From 0.000000 to 5.504000
TIME vs. DetID plot around the trigger time

Blue+Cyan dotted lines: Time interval of the scaled map
From 0.000000 to 5.504000
100 us light curve (15-350 keV)

Blue+Cyan dotted lines: Time interval of the scaled map
From 0.000000 to 5.504000
Spacecraft aspect plot

Bright source in the pre-burst/pre-slew/post-slew images
Pre-burst image of 15-350 keV band
Time interval of the image:
-141.371400 1.388000

# RAcent  DECcent POSerr Theta    Phi  PeakCts   SNR AngSep     Name
#  [deg]    [deg]    ['] [deg]  [deg]                   [']
 47.9142 -16.0995    3.1  10.4   48.5   0.4014   3.7 ------	UNKNOWN
 95.6872 -36.1230    2.7  37.5 -161.5   0.6706   4.3 ------	UNKNOWN
 70.2105 -66.0657    2.1  42.4 -108.9   2.7037   5.6 ------	UNKNOWN
Pre-slew background subtracted image of 15-350 keV band
Time interval of the image:
1.388000 10.996000

# RAcent  DECcent POSerr Theta    Phi  PeakCts   SNR AngSep     Name
#  [deg]    [deg]    ['] [deg]  [deg]                   [']
 85.2100 -19.2841    1.4  29.7  166.3   0.2973   8.4 ------	UNKNOWN
  7.0571 -34.8003    3.1  41.2  -34.1   0.1699   3.8 ------	UNKNOWN
 91.5165 -52.8693    2.4  39.7 -134.4   0.2396   4.9 ------	UNKNOWN
Post-slew image of 15-350 keV band
Time interval of the image:
117.828600 302.807600

# RAcent  DECcent POSerr Theta    Phi  PeakCts   SNR AngSep     Name
#  [deg]    [deg]    ['] [deg]  [deg]                   [']
 83.6330  22.0084    0.7  41.3  129.2   8.0452  16.2    0.4	Crab
 98.7521  25.3763    3.0  46.5  148.4   1.9132   3.9 ------	UNKNOWN
131.7441 -24.9435    2.5  43.3 -122.3   2.2039   4.6 ------	UNKNOWN
132.9312 -25.9287    2.5  44.3 -120.8   2.7357   4.6 ------	UNKNOWN
Plot creation:
Sun May 31 15:05:36 EDT 2015