Click here for the BAT GCN circular template
Image
Pre-slew 15.0-350.0 keV image (Event data)
#   RAcent    DECcent   POSerr    Theta     Phi              Peak Cts       SNR   Name
  252.0934   -59.2312   0.0148    21.6389   -85.3326         1.1939158     13.065 TRIG_00172516

Foreground time interval of the image:
 -6.699  66.588 (delta_t =  73.287 [sec])
Background time interval of the image:
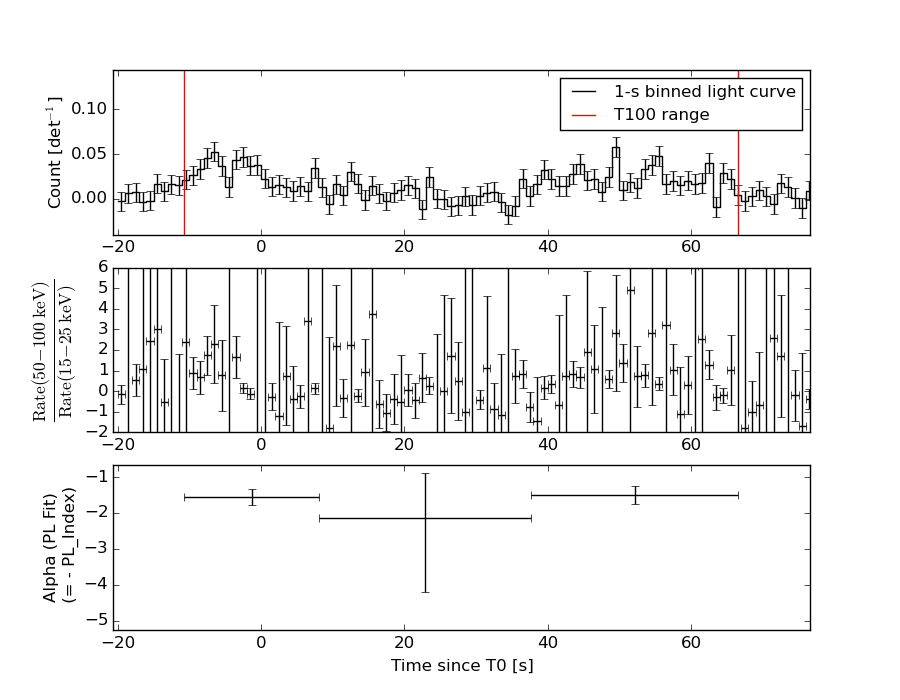
Lightcurves
Notes:
- 1) The mask-weighted light curves are using the flight position.
- 2) Multiple plots of different time binning/intervals are shown to cover all scenarios of short/long GRBs, rate/image triggers, and real/false positives.
- 3) For all the mask-weighted lightcurves, the y-axis units are counts/sec/det where a det is 0.4 x 0.4 = 0.16 sq cm.
- 4) The verticle lines correspond to following: green dotted lines are T50 interval, black dotted lines are T90 interval, blue solid line(s) is a spacecraft slew start time, and orange solid line(s) is a spacecraft slew end time.
- 5) Time of each bin is in the middle of the bin.
1 s binning
From T0-310 s to T0+310 s

From T100_start - 20 s to T100_end + 30 s
Full time interval
64 ms binning
Full time interval
From T100_start to T100_end
From T0-5 sec to T0+5 sec
16 ms binning
From T100_start-5 s to T100_start+5 s
Blue+Cyan dotted lines: Time interval of the scaled map
From 0.000000 to 64.000000
8 ms binning
From T100_start-3 s to T100_start+3 s
Blue+Cyan dotted lines: Time interval of the scaled map
From 0.000000 to 64.000000
2 ms binning
From T100_start-1 s to T100_start+1 s
Blue+Cyan dotted lines: Time interval of the scaled map
From 0.000000 to 64.000000
SN=5 or 10 sec. binning (whichever binning is satisfied first)
SN=5 or 10 sec. binning (T < 200 sec)
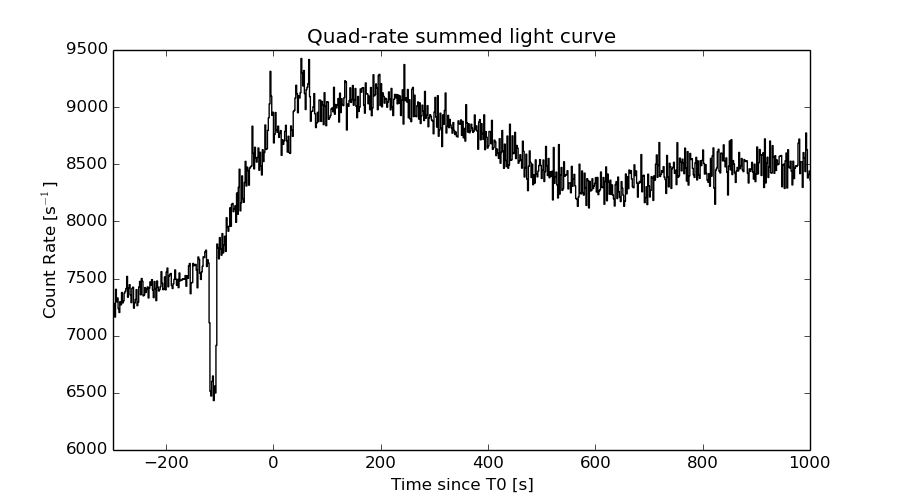
Quad-rate summed light curves (from T0-300s to T0+1000s)
Spectral Evolution
Spectra
Notes:
- 1) The fitting includes the systematic errors.
- 2) When the burst includes telescope slew time periods, the fitting uses an average response file made from multiple 5-s response files through out the slew time plus single time preiod for the non-slew times, and weighted by the total counts in the corresponding time period using addrmf. An average response file is needed becuase a spectral fit using the pre-slew DRM will introduce some errors in both a spectral shape and a normalization if the PHA file contains a lot of the slew/post-slew time interval.
- 3) For fits to more complicated models (e.g. a power-law over a cutoff power-law), the BAT team has decided to require a chi-square improvement of more than 6 for each extra dof.
Time averaged spectrum fit using the average DRM
Power-law model
Time interval is from  -10.724 sec. to   66.588 sec.

Spectral model in power-law:
------------------------------------------------------------
Parameters  : value       lower 90%   higher 90%
Photon index: 1.60101     ( -0.190176   0.193252 )
Norm@50keV  : 1.10267E-03    ( -0.000133737   0.000132449 )
------------------------------------------------------------
#Fit statistic : Chi-Squared =          54.03 using 59 PHA bins.
# Reduced chi-squared =         0.9478 for     57 degrees of freedom
# Null hypothesis probability =   5.873565e-01

Photon flux (15-150 keV)    in 77.31 sec: 0.141742 ( -0.0162764  0.016292 ) ph/cm2/s
Energy fluence (15-150 keV)             : 7.97151e-07 ( -1.03036e-07  1.04525e-07 ) ergs/cm2
Cutoff power-law model
Time interval is from  -10.724 sec. to   66.588 sec.
Spectral model in the cutoff power-law:
------------------------------------------------------------
Parameters  : value       lower 90%   higher 90%
Photon index: 0.744084     ( -0.995229   0.797408 )
Epeak [keV] : 66.6296      ( -16.8711 207.46 )
Norm@50keV  : 3.23078E-03    ( -0.00201396   0.00802187 )
------------------------------------------------------------
#Fit statistic : Chi-Squared =          50.62 using 59 PHA bins.
# Reduced chi-squared =         0.9040 for     56 degrees of freedom
# Null hypothesis probability =   6.778655e-01

Photon flux (15-150 keV)    in 77.31 sec: 0.137303 ( -0.016811  0.016812 ) ph/cm2/s
Energy fluence (15-150 keV)             : 7.35881e-07 ( -1.15127e-07  1.18842e-07 ) ergs/cm2
Band function
Time interval is from  -10.724 sec. to   66.588 sec.

Spectral model in the Band function:
------------------------------------------------------------
Parameters  : value       lower 90%   higher 90%
alpha       : 3.07255   ( -5.50022   -4.38768 )
beta        : -1.93786    ( -0.3279   0.280111 )
Epeak [keV] : 32.5410      ( -4.99947 5.6479 )
Norm@50keV   : 1.60906    ( -1.60833   15.744 )
------------------------------------------------------------
#Fit statistic : Chi-Squared =          48.31 using 59 PHA bins.
# Reduced chi-squared =         0.8783 for     55 degrees of freedom
# Null hypothesis probability =   7.262762e-01

Photon flux (15-150 keV)    in 77.31 sec: 0.137578 ( 6.86242  -0.016802 ) ph/cm2/s
Energy fluence (15-150 keV)             : 7.56993e-07 ( -7.56452e-07  -1.09924e-07 ) ergs/cm2
Single BB
Spectral model blackbody:
------------------------------------------------------------
Parameters  : value    Lower 90%  Upper 90%
kT [keV]    : 12.6687  (-1.65906  1.96631)
R^2/D10^2   : 2.92379E-02  (-0.0119372   0.0195089)
(R is the radius in km and D10 is the distance to the source in units of 10 kpc)
------------------------------------------------------------
#Fit statistic : Chi-Squared =          61.47 using 59 PHA bins.
# Reduced chi-squared =          1.079 for     57 degrees of freedom
# Null hypothesis probability =   3.189238e-01

Energy  Fluence     90% Error
[keV]   [erg/cm2]   [erg/cm2]
15- 25  7.694e-08   1.554e-08
25- 50  2.576e-07   3.850e-08
50-150  2.574e-07   6.479e-08
15-150  5.919e-07   9.223e-08
Thermal bremsstrahlung (OTTB)
Spectral model: thermal bremsstrahlung
------------------------------------------------------------
Parameters  : value         Lower 90%    Upper 90%
kT [keV]    : 159.411       (-65.3877      -158.017)
Norm        : 0.587320       (-0.0709301     0.0901122)
------------------------------------------------------------
#Fit statistic : Chi-Squared =          51.69 using 59 PHA bins.
# Reduced chi-squared =         0.9068 for     57 degrees of freedom
# Null hypothesis probability =   6.739508e-01

Energy  Fluence     90% Error
[keV]   [erg/cm2]   [erg/cm2]
15- 25  1.160e-07   6.389e-08
25- 50  2.168e-07   1.166e-07
50-150  4.387e-07   2.504e-07
15-150  7.715e-07   4.279e-07
Double BB
Spectral model: bbodyrad<1> + bbodyrad<2>
------------------------------------------------------------
Parameters  : value         Lower 90%    Upper 90%
kT1 [keV]   : 7.44859        (-2.54173      2.86021)
R1^2/D10^2  : 0.121820        (-0.0602276      0.18403)
kT2 [keV]   : 22.4582        (-9.00352      45.6343)
R2^2/D10^2  : 2.36888E-03    (-0.00134824   0.00618615)
------------------------------------------------------------
#Fit statistic : Chi-Squared =          49.08 using 59 PHA bins.
# Reduced chi-squared =         0.8924 for     55 degrees of freedom
# Null hypothesis probability =   6.990171e-01

Energy  Fluence     90% Error
[keV]   [erg/cm2]   [erg/cm2]
15- 25  1.061e-07   6.165e-08
25- 50  2.279e-07   1.214e-07
50-150  3.699e-07   2.114e-07
15-150  7.039e-07   3.705e-07
Peak spectrum fit
Power-law model
Time interval is from   48.884 sec. to   49.884 sec.

Spectral model in power-law:
------------------------------------------------------------
Parameters  : value       lower 90%   higher 90%
Photon index: 0.924911     ( -0.496107   0.435058 )
Norm@50keV  : 4.47845E-03    ( -0.00121695   0.00116829 )
------------------------------------------------------------
#Fit statistic : Chi-Squared =          52.79 using 59 PHA bins.
# Reduced chi-squared =         0.9262 for     57 degrees of freedom
# Null hypothesis probability =   6.335233e-01

Photon flux (15-150 keV)    in 1 sec: 0.514188 ( -0.136242  0.138393 ) ph/cm2/s
Energy fluence (15-150 keV)             : 4.9782e-08 ( -1.26547e-08  1.27337e-08 ) ergs/cm2
Cutoff power-law model
Time interval is from   48.884 sec. to   49.884 sec.
Spectral model in the cutoff power-law:
------------------------------------------------------------
Parameters  : value       lower 90%   higher 90%
Photon index: 2.46910     (     )
Epeak [keV] : 142.480      (   )
Norm@50keV  : 2.49589E-04    (     )
------------------------------------------------------------
#Fit statistic : Chi-Squared =          52.55 using 59 PHA bins.
# Reduced chi-squared =         0.9384 for     56 degrees of freedom
# Null hypothesis probability =   6.061976e-01

Photon flux (15-150 keV)    in 1 sec: 0.508000 ( -0.141028  0.142002 ) ph/cm2/s
Energy fluence (15-150 keV)             : 4.92428e-08 ( -1.31821e-08  1.31007e-08 ) ergs/cm2
Band function
Time interval is from   48.884 sec. to   49.884 sec.

Spectral model in the Band function:
------------------------------------------------------------
Parameters  : value       lower 90%   higher 90%
alpha       : 4.99999   ( -4.99999   -4.99999 )
beta        : -1.15307    ( -0.953171   0.629998 )
Epeak [keV] : 41.9600      ( -41.96 22.2677 )
Norm@50keV   : 15.3201    ( -3.74059   1.28583e+06 )
------------------------------------------------------------
#Fit statistic : Chi-Squared =          52.55 using 59 PHA bins.
# Reduced chi-squared =         0.9555 for     55 degrees of freedom
# Null hypothesis probability =   5.686542e-01

Photon flux (15-150 keV)    in 1 sec:  (    ) ph/cm2/s
Energy fluence (15-150 keV)             : 0 ( 0  0 ) ergs/cm2
Single BB
Spectral model blackbody:
------------------------------------------------------------
Parameters  : value    Lower 90%  Upper 90%
kT [keV]    : 23.8814  (-6.80924  12.5687)
R^2/D10^2   : 1.44282E-02  (-0.010386   0.0281507)
(R is the radius in km and D10 is the distance to the source in units of 10 kpc)
------------------------------------------------------------
#Fit statistic : Chi-Squared =          54.71 using 59 PHA bins.
# Reduced chi-squared =         0.9598 for     57 degrees of freedom
# Null hypothesis probability =   5.615159e-01

Energy  Fluence     90% Error
[keV]   [erg/cm2]   [erg/cm2]
15- 25  1.464e-09   9.184e-10
25- 50  8.107e-09   4.131e-09
50-150  3.446e-08   1.971e-08
15-150  4.403e-08   2.642e-08
Thermal bremsstrahlung (OTTB)
Spectral model: thermal bremsstrahlung
------------------------------------------------------------
Parameters  : value         Lower 90%    Upper 90%
kT [keV]    : 200.000       (      )
Norm        : 2.18104       (-0.5717     0.571603)
------------------------------------------------------------
#Fit statistic : Chi-Squared =          58.48 using 59 PHA bins.
# Reduced chi-squared =          1.026 for     57 degrees of freedom
# Null hypothesis probability =   4.209775e-01

Energy  Fluence     90% Error
[keV]   [erg/cm2]   [erg/cm2]
15- 25  5.436e-09   3.335e-09
25- 50  1.046e-08   6.365e-09
50-150  2.293e-08   1.366e-08
15-150  3.882e-08   2.317e-08
Double BB
------------------------------------------------------------
Parameters  : value         Lower 90%    Upper 90%
kT1 [keV]   : 200.000        (      )
R1^2/D10^2  : 8.82147E-05        (-8.82147e-05      -8.82147e-05)
kT2 [keV]   : 14.5670        (-3.32135      13.2833)
R2^2/D10^2  : 5.12409E-02    (-0.0207401   0.0462712)
------------------------------------------------------------
#Fit statistic : Chi-Squared =          54.70 using 59 PHA bins.
#Fit statistic : Chi-Squared =          52.45 using 59 PHA bins.
# Reduced chi-squared =         0.9946 for     55 degrees of freedom
# Reduced chi-squared =         0.9537 for     55 degrees of freedom
# Null hypothesis probability =   4.858796e-01
# Null hypothesis probability =   5.725965e-01

Energy  Fluence     90% Error
[keV]   [erg/cm2]   [erg/cm2]
15- 25  1.441e-09   6.515e+03
25- 50  8.024e-09   6.120e+04
50-150  3.475e-08   1.249e+06
15-150  4.421e-08   1.630e+06
Pre-slew spectrum (Pre-slew PHA with pre-slew DRM)
Power-law model
Spectral model in power-law:
------------------------------------------------------------
Parameters  : value       lower 90%   higher 90%
Photon index: 1.61825     ( -0.205612   0.209634 )
Norm@50keV  : 1.03114E-03    ( -0.000137437   0.000135946 )
------------------------------------------------------------
#Fit statistic : Chi-Squared =          58.52 using 59 PHA bins.
# Reduced chi-squared =          1.027 for     57 degrees of freedom
# Null hypothesis probability =   4.192310e-01

Photon flux (15-150 keV)    in 73.29 sec: 0.133266 ( -0.016672  0.0166872 ) ph/cm2/s
Energy fluence (15-150 keV)             : 7.05251e-07 ( -9.95908e-08  1.01224e-07 ) ergs/cm2
Cutoff power-law model
Spectral model in the cutoff power-law:
------------------------------------------------------------
Parameters  : value       lower 90%   higher 90%
Photon index: 0.596928     ( -1.1664   0.900949 )
Epeak [keV] : 61.4129      ( -14.6743 110.31 )
Norm@50keV  : 3.76682E-03    ( -0.00376705   0.0128984 )
------------------------------------------------------------
#Fit statistic : Chi-Squared =          54.69 using 59 PHA bins.
# Reduced chi-squared =         0.9767 for     56 degrees of freedom
# Null hypothesis probability =   5.244378e-01

Photon flux (15-150 keV)    in 73.29 sec: 0.128496 ( -0.017198  0.017211 ) ph/cm2/s
Energy fluence (15-150 keV)             : 6.40386e-07 ( -1.10307e-07  1.15593e-07 ) ergs/cm2
Band function
Spectral model in the Band function:
------------------------------------------------------------
Parameters  : value       lower 90%   higher 90%
alpha       : 4.45240   ( -4.48368   -4.4524 )
beta        : -1.98657    ( -0.372701   0.310557 )
Epeak [keV] : 30.8616      ( -4.9408 5.16098 )
Norm@50keV   : 15.5536    ( -1.89379   160.576 )
------------------------------------------------------------
#Fit statistic : Chi-Squared =          52.49 using 59 PHA bins.
# Reduced chi-squared =         0.9543 for     55 degrees of freedom
# Null hypothesis probability =   5.712518e-01

Photon flux (15-150 keV)    in 73.29 sec: 0.129210 ( 6.87079  -0.017039 ) ph/cm2/s
Energy fluence (15-150 keV)             : 6.66955e-07 ( -6.66442e-07  -1.05113e-07 ) ergs/cm2
S(25-50 keV) vs. S(50-100 keV) plot
S(25-50 keV)  = 2.07e-07
S(50-100 keV) = 2.73e-07
T90 vs. Hardness ratio plot
T90                                   = 71.055999994278 sec.
Hardness ratio (energy fluence ratio) = 1.31884
Color vs. Color plot
Count Ratio  (25-50 keV) / (15-25 keV) = 1.62442
Count Ratio (50-100 keV) / (15-25 keV) = 0.949305
Mask shadow pattern
IMX = 3.228097461367669E-02, IMY = 3.953973773191242E-01
TIME vs. PHA plot around the trigger time
Blue+Cyan dotted lines: Time interval of the scaled map
From 0.000000 to 64.000000
TIME vs. DetID plot around the trigger time
Blue+Cyan dotted lines: Time interval of the scaled map
From 0.000000 to 64.000000
100 us light curve (15-350 keV)
Blue+Cyan dotted lines: Time interval of the scaled map
From 0.000000 to 64.000000
Spacecraft aspect plot
Bright source in the pre-burst/pre-slew/post-slew images
Pre-burst image of 15-350 keV band
Time interval of the image:
Pre-slew background subtracted image of 15-350 keV band
Time interval of the image:
-6.699410 66.588000

# RAcent  DECcent POSerr Theta    Phi  PeakCts   SNR AngSep     Name
#  [deg]    [deg]    ['] [deg]  [deg]                   [']
170.1744 -60.6334    1.7  19.3  135.0   0.5821   7.0    4.2	Cen X-3
186.7983 -62.7850    3.8  13.5  155.6   0.2406   3.0    4.0	GX 301-2
264.8471 -44.6307    0.0  38.2  -84.3   0.1317   0.5   11.7	4U 1735-44
184.7788 -18.1353    2.4  57.2  175.7   2.3948   4.7 ------	UNKNOWN
244.8611 -78.3747    2.8   9.6  -21.8   0.3278   4.1 ------	UNKNOWN
252.0934 -59.2312    0.9  21.6  -85.3   1.1940  13.1 ------	UNKNOWN
200.8032 -14.8401    2.6  59.1 -166.0   2.3636   4.5 ------	UNKNOWN
Post-slew image of 15-350 keV band
Time interval of the image:
-299.000000 303.111500

# RAcent  DECcent POSerr Theta    Phi  PeakCts   SNR AngSep     Name
#  [deg]    [deg]    ['] [deg]  [deg]                   [']
170.1877 -60.6206    1.4  19.3  135.0   2.4836   8.2    3.8	Cen X-3
186.6569 -62.7711    2.2  13.6  155.4   1.4954   5.2    0.1	GX 301-2
264.9542 -44.3407    0.0  38.4  -84.3   0.2494   0.2   11.2	4U 1735-44
187.2481 -22.1066    2.5  53.0  177.8   4.3337   4.6 ------	UNKNOWN
269.0361 -66.4643    2.5  20.6  -56.0   1.3764   4.5 ------	UNKNOWN
200.6542 -14.8597    3.7  59.1 -166.1   6.6154   3.1 ------	UNKNOWN
337.7216 -42.2908    3.1  58.9  -19.1   8.3092   3.7 ------	UNKNOWN
241.5919 -33.0349    3.2  43.8 -116.0   4.7808   3.6 ------	UNKNOWN
Plot creation:
Sun May 31 14:56:19 EDT 2015