Click here for the BAT GCN circular template
Image
Pre-slew 15.0-350.0 keV image (Event data)
#   RAcent    DECcent   POSerr    Theta     Phi              Peak Cts       SNR   Name
  328.8412    -1.8361   0.0256    18.7200  -131.2042         0.3377734      7.475 TRIG_00175603

Foreground time interval of the image:
 -0.896  22.104 (delta_t =  23.000 [sec])
Background time interval of the image:
-299.896  -0.896 (delta_t = 299.000 [sec])
Lightcurves
Notes:
- 1) The mask-weighted light curves are using the flight position.
- 2) Multiple plots of different time binning/intervals are shown to cover all scenarios of short/long GRBs, rate/image triggers, and real/false positives.
- 3) For all the mask-weighted lightcurves, the y-axis units are counts/sec/det where a det is 0.4 x 0.4 = 0.16 sq cm.
- 4) The verticle lines correspond to following: green dotted lines are T50 interval, black dotted lines are T90 interval, blue solid line(s) is a spacecraft slew start time, and orange solid line(s) is a spacecraft slew end time.
- 5) Time of each bin is in the middle of the bin.
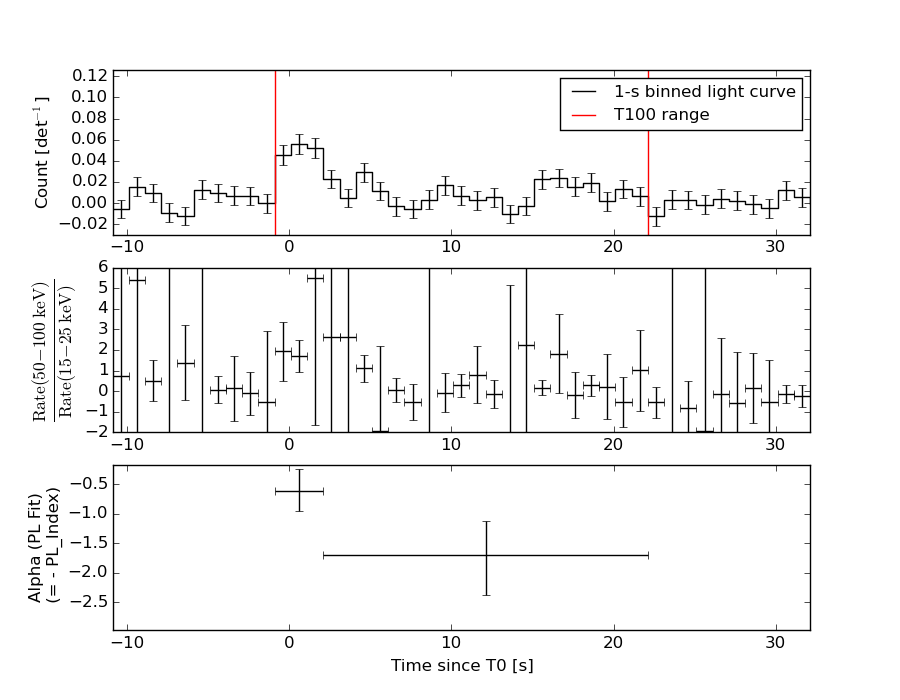
1 s binning
From T0-310 s to T0+310 s
From T100_start - 20 s to T100_end + 30 s
Full time interval
64 ms binning
Full time interval
From T100_start to T100_end
From T0-5 sec to T0+5 sec
16 ms binning
From T100_start-5 s to T100_start+5 s
Blue+Cyan dotted lines: Time interval of the scaled map
From 0.000000 to 2.048000
8 ms binning
From T100_start-3 s to T100_start+3 s
Blue+Cyan dotted lines: Time interval of the scaled map
From 0.000000 to 2.048000
2 ms binning
From T100_start-1 s to T100_start+1 s
Blue+Cyan dotted lines: Time interval of the scaled map
From 0.000000 to 2.048000
SN=5 or 10 sec. binning (whichever binning is satisfied first)
SN=5 or 10 sec. binning (T < 200 sec)
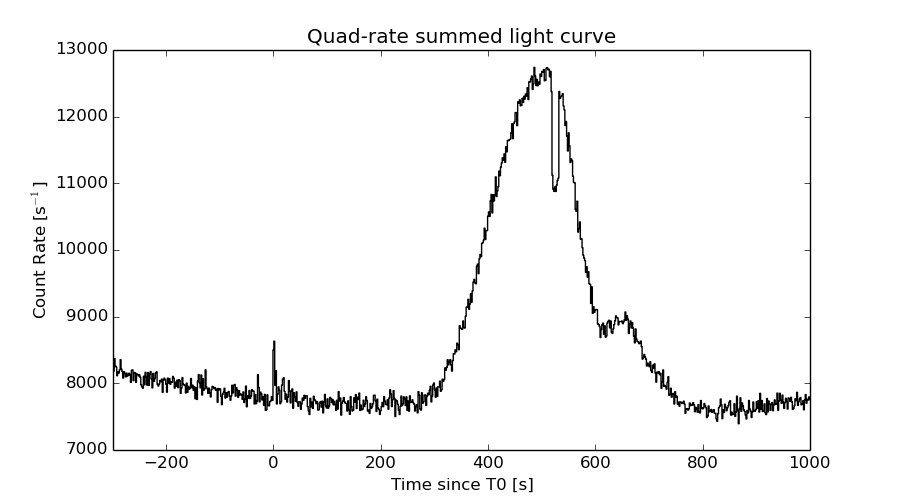
Quad-rate summed light curves (from T0-300s to T0+1000s)
Spectral Evolution
Spectra
Notes:
- 1) The fitting includes the systematic errors.
- 2) When the burst includes telescope slew time periods, the fitting uses an average response file made from multiple 5-s response files through out the slew time plus single time preiod for the non-slew times, and weighted by the total counts in the corresponding time period using addrmf. An average response file is needed becuase a spectral fit using the pre-slew DRM will introduce some errors in both a spectral shape and a normalization if the PHA file contains a lot of the slew/post-slew time interval.
- 3) For fits to more complicated models (e.g. a power-law over a cutoff power-law), the BAT team has decided to require a chi-square improvement of more than 6 for each extra dof.
Time averaged spectrum fit using the average DRM
Power-law model

Time interval is from   -0.896 sec. to   22.104 sec.

Spectral model in power-law:
------------------------------------------------------------
Parameters  : value       lower 90%   higher 90%
Photon index: 1.24394     ( -0.387174   0.376932 )
Norm@50keV  : 1.01434E-03    ( -0.000194738   0.000194725 )
------------------------------------------------------------
#Fit statistic : Chi-Squared =          55.51 using 59 PHA bins.
# Reduced chi-squared =         0.9739 for     57 degrees of freedom
# Null hypothesis probability =   5.311241e-01

Photon flux (15-150 keV)    in 23 sec: 0.119852 ( -0.023963  0.0240364 ) ph/cm2/s
Energy fluence (15-150 keV)             : 2.33853e-07 ( -5.04268e-08  5.10405e-08 ) ergs/cm2
Cutoff power-law model

Time interval is from   -0.896 sec. to   22.104 sec.
Spectral model in the cutoff power-law:
------------------------------------------------------------
Parameters  : value       lower 90%   higher 90%
Photon index: 2.50245     (     )
Epeak [keV] : 163.606      (   )
Norm@50keV  : 2.34284E-04    (     )
------------------------------------------------------------
#Fit statistic : Chi-Squared =          54.65 using 59 PHA bins.
# Reduced chi-squared =         0.9759 for     56 degrees of freedom
# Null hypothesis probability =   5.261341e-01

Photon flux (15-150 keV)    in 23 sec: 0.120391 ( -0.0245978  0.023565 ) ph/cm2/s
Energy fluence (15-150 keV)             : 2.33827e-07 ( -5.01057e-08  4.96455e-08 ) ergs/cm2
Band function

Time interval is from   -0.896 sec. to   22.104 sec.

Spectral model in the Band function:
------------------------------------------------------------
Parameters  : value       lower 90%   higher 90%
alpha       : -1.00576   ( 1.00636   1.00636 )
beta        : -1.24388    ( 1.2439   0.387132 )
Epeak [keV] : 47.2691      ( -46.6192 -46.6192 )
Norm@50keV   : 1.83318E-03    ( -0.00101507   0.16252 )
------------------------------------------------------------
#Fit statistic : Chi-Squared =          55.51 using 59 PHA bins.
# Reduced chi-squared =          1.009 for     55 degrees of freedom
# Null hypothesis probability =   4.553682e-01

Photon flux (15-150 keV)    in 23 sec:  (    ) ph/cm2/s
Energy fluence (15-150 keV)             : 0 ( 0  0 ) ergs/cm2
Single BB
Spectral model blackbody:
------------------------------------------------------------
Parameters  : value    Lower 90%  Upper 90%
kT [keV]    : 20.5385  (-5.13854  7.98003)
R^2/D10^2   : 4.82474E-03  (-0.00311108   0.00764317)
(R is the radius in km and D10 is the distance to the source in units of 10 kpc)
------------------------------------------------------------
#Fit statistic : Chi-Squared =          64.90 using 59 PHA bins.
# Reduced chi-squared =          1.139 for     57 degrees of freedom
# Null hypothesis probability =   2.206478e-01

Energy  Fluence     90% Error
[keV]   [erg/cm2]   [erg/cm2]
15- 25  8.927e-09   4.347e-09
25- 50  4.525e-08   1.814e-08
50-150  1.420e-07   5.981e-08
15-150  1.961e-07   7.399e-08
Thermal bremsstrahlung (OTTB)
Spectral model: thermal bremsstrahlung
------------------------------------------------------------
Parameters  : value         Lower 90%    Upper 90%
kT [keV]    : 200.000       (      )
Norm        : 0.495461       (-0.0971084     0.0970998)
------------------------------------------------------------
#Fit statistic : Chi-Squared =          58.43 using 59 PHA bins.
# Reduced chi-squared =          1.025 for     57 degrees of freedom
# Null hypothesis probability =   4.224488e-01

Energy  Fluence     90% Error
[keV]   [erg/cm2]   [erg/cm2]
15- 25  2.838e-08   1.667e-08
25- 50  5.459e-08   3.198e-08
50-150  1.197e-07   6.815e-08
15-150  2.027e-07   1.179e-07
Double BB
Spectral model: bbodyrad<1> + bbodyrad<2>
------------------------------------------------------------
Parameters  : value         Lower 90%    Upper 90%
kT1 [keV]   : 3.65388        (-2.97269      2.35148)
R1^2/D10^2  : 1.82332        (-1.70079      -1.7751)
kT2 [keV]   : 26.9377        (-8.19164      17.9262)
R2^2/D10^2  : 1.89542E-03    (-0.00163   0.0061627)
------------------------------------------------------------
#Fit statistic : Chi-Squared =          54.74 using 59 PHA bins.
# Reduced chi-squared =         0.9952 for     55 degrees of freedom
# Null hypothesis probability =   4.846996e-01

Energy  Fluence     90% Error
[keV]   [erg/cm2]   [erg/cm2]
15- 25  2.945e-08   1.651e-08
25- 50  3.772e-08   1.900e-08
50-150  1.647e-07   9.580e-08
15-150  2.318e-07   1.127e-07
Peak spectrum fit
Power-law model
Time interval is from    0.104 sec. to    1.104 sec.

Spectral model in power-law:
------------------------------------------------------------
Parameters  : value       lower 90%   higher 90%
Photon index: 0.627030     ( -0.695139   0.554258 )
Norm@50keV  : 3.32321E-03    ( -0.00121276   0.00106957 )
------------------------------------------------------------
#Fit statistic : Chi-Squared =          44.61 using 59 PHA bins.
# Reduced chi-squared =         0.7826 for     57 degrees of freedom
# Null hypothesis probability =   8.836512e-01

Photon flux (15-150 keV)    in 1 sec: 0.386783 ( -0.115038  0.117417 ) ph/cm2/s
Energy fluence (15-150 keV)             : 4.19543e-08 ( -1.16528e-08  1.16932e-08 ) ergs/cm2
Cutoff power-law model
Time interval is from    0.104 sec. to    1.104 sec.
Spectral model in the cutoff power-law:
------------------------------------------------------------
Parameters  : value       lower 90%   higher 90%
Photon index: 0.629739     ( -1.02071   0.547826 )
Epeak [keV] : 9999.36      ( -9999.36 -9999.36 )
Norm@50keV  : 3.36265E-03    ( -0.00122178   0.010633 )
------------------------------------------------------------
#Fit statistic : Chi-Squared =          44.62 using 59 PHA bins.
# Reduced chi-squared =         0.7968 for     56 degrees of freedom
# Null hypothesis probability =   8.630146e-01

Photon flux (15-150 keV)    in 1 sec: 0.389399 (    ) ph/cm2/s
Energy fluence (15-150 keV)             : 4.19346e-08 ( -1.16261e-08  1.15516e-08 ) ergs/cm2
Band function

Time interval is from    0.104 sec. to    1.104 sec.

Spectral model in the Band function:
------------------------------------------------------------
Parameters  : value       lower 90%   higher 90%
alpha       : -0.789169   ( 0.788984   0.788984 )
beta        : -0.626965    ( -0.553384   0.695229 )
Epeak [keV] : 15.0897      ( -15.0904 -15.0904 )
Norm@50keV   : 4.92863E-03    ( -0.00269451   0 )
------------------------------------------------------------
#Fit statistic : Chi-Squared =          44.61 using 59 PHA bins.
# Reduced chi-squared =         0.8111 for     55 degrees of freedom
# Null hypothesis probability =   8.404512e-01

Photon flux (15-150 keV)    in 1 sec:  (    ) ph/cm2/s
Energy fluence (15-150 keV)             : 0 ( 0  0 ) ergs/cm2
Single BB
Spectral model blackbody:
------------------------------------------------------------
Parameters  : value    Lower 90%  Upper 90%
kT [keV]    : 35.9122  (-13.646  46.9137)
R^2/D10^2   : 3.58046E-03  (-0.00357715   0.0104226)
(R is the radius in km and D10 is the distance to the source in units of 10 kpc)
------------------------------------------------------------
#Fit statistic : Chi-Squared =          47.04 using 59 PHA bins.
# Reduced chi-squared =         0.8253 for     57 degrees of freedom
# Null hypothesis probability =   8.237104e-01

Energy  Fluence     90% Error
[keV]   [erg/cm2]   [erg/cm2]
15- 25  6.426e-10   4.091e-10
25- 50  4.238e-09   2.516e-09
50-150  3.521e-08   2.032e-08
15-150  4.009e-08   2.324e-08
Thermal bremsstrahlung (OTTB)
Spectral model: thermal bremsstrahlung
------------------------------------------------------------
Parameters  : value         Lower 90%    Upper 90%
kT [keV]    : 200.000       (      )
Norm        : 1.60958       (-0.486659     0.486607)
------------------------------------------------------------
#Fit statistic : Chi-Squared =          52.73 using 59 PHA bins.
# Reduced chi-squared =         0.9250 for     57 degrees of freedom
# Null hypothesis probability =   6.360616e-01

Energy  Fluence     90% Error
[keV]   [erg/cm2]   [erg/cm2]
15- 25  4.011e-09   2.503e-09
25- 50  7.716e-09   4.747e-09
50-150  1.692e-08   1.022e-08
15-150  2.865e-08   1.730e-08
Double BB
Spectral model: bbodyrad<1> + bbodyrad<2>
------------------------------------------------------------
Parameters  : value         Lower 90%    Upper 90%
kT1 [keV]   : 5.26544        (-4.06235      27.1316)
R1^2/D10^2  : 0.827525        (-0.823656      2282.59)
kT2 [keV]   : 46.9576        (-21.1387      -46.9979)
R2^2/D10^2  : 1.73197E-03    (-0.00170749   0.00317138)
------------------------------------------------------------
#Fit statistic : Chi-Squared =          44.08 using 59 PHA bins.
# Reduced chi-squared =         0.8014 for     55 degrees of freedom
# Null hypothesis probability =   8.542257e-01

Energy  Fluence     90% Error
[keV]   [erg/cm2]   [erg/cm2]
15- 25  2.902e-09   1.901e-09
25- 50  4.941e-09   2.595e-09
50-150  3.583e-08   2.093e-08
15-150  4.368e-08   2.320e-08
Pre-slew spectrum (Pre-slew PHA with pre-slew DRM)
Power-law model

Spectral model in power-law:
------------------------------------------------------------
Parameters  : value       lower 90%   higher 90%
Photon index: 1.24394     ( -0.387174   0.376932 )
Norm@50keV  : 1.01434E-03    ( -0.000194738   0.000194725 )
------------------------------------------------------------
#Fit statistic : Chi-Squared =          55.51 using 59 PHA bins.
# Reduced chi-squared =         0.9739 for     57 degrees of freedom
# Null hypothesis probability =   5.311241e-01

Photon flux (15-150 keV)    in 23 sec: 0.119852 ( -0.023963  0.0240364 ) ph/cm2/s
Energy fluence (15-150 keV)             : 2.33853e-07 ( -5.04268e-08  5.10405e-08 ) ergs/cm2
Cutoff power-law model

Spectral model in the cutoff power-law:
------------------------------------------------------------
Parameters  : value       lower 90%   higher 90%
Photon index: 2.50245     (     )
Epeak [keV] : 163.606      (   )
Norm@50keV  : 2.34284E-04    (     )
------------------------------------------------------------
#Fit statistic : Chi-Squared =          54.65 using 59 PHA bins.
# Reduced chi-squared =         0.9759 for     56 degrees of freedom
# Null hypothesis probability =   5.261341e-01

Photon flux (15-150 keV)    in 23 sec: 0.120391 ( -0.0245978  0.023565 ) ph/cm2/s
Energy fluence (15-150 keV)             : 2.33827e-07 ( -5.01057e-08  4.96455e-08 ) ergs/cm2
Band function

Spectral model in the Band function:
------------------------------------------------------------
Parameters  : value       lower 90%   higher 90%
alpha       : -1.00576   ( 1.00636   1.00636 )
beta        : -1.24388    ( 1.2439   0.387132 )
Epeak [keV] : 47.2691      ( -46.6192 -46.6192 )
Norm@50keV   : 1.83318E-03    ( -0.00101507   0.16252 )
------------------------------------------------------------
#Fit statistic : Chi-Squared =          55.51 using 59 PHA bins.
# Reduced chi-squared =          1.009 for     55 degrees of freedom
# Null hypothesis probability =   4.553682e-01

Photon flux (15-150 keV)    in 23 sec:  (    ) ph/cm2/s
Energy fluence (15-150 keV)             : 0 ( 0  0 ) ergs/cm2
S(25-50 keV) vs. S(50-100 keV) plot
S(25-50 keV)  = 5.04e-08
S(50-100 keV) = 8.51e-08
T90 vs. Hardness ratio plot
T90                                   = 19 sec.
Hardness ratio (energy fluence ratio) = 1.68849
Color vs. Color plot
Count Ratio  (25-50 keV) / (15-25 keV) = 1.09461
Count Ratio (50-100 keV) / (15-25 keV) = 1.29868
Mask shadow pattern
IMX = -2.232284873169235E-01, IMY = 2.549541479013678E-01
TIME vs. PHA plot around the trigger time
Blue+Cyan dotted lines: Time interval of the scaled map
From 0.000000 to 2.048000
TIME vs. DetID plot around the trigger time
Blue+Cyan dotted lines: Time interval of the scaled map
From 0.000000 to 2.048000
100 us light curve (15-350 keV)
Blue+Cyan dotted lines: Time interval of the scaled map
From 0.000000 to 2.048000
Spacecraft aspect plot
Bright source in the pre-burst/pre-slew/post-slew images
Pre-burst image of 15-350 keV band
Time interval of the image:
-299.896000 -0.896000

# RAcent  DECcent POSerr Theta    Phi  PeakCts   SNR AngSep     Name
#  [deg]    [deg]    ['] [deg]  [deg]                   [']
288.7957  10.9740    1.1  39.1  -44.0   3.7490  10.7    1.7	GRS 1915+105
299.5835  35.2031    0.2  31.7    0.2  13.3176  56.1    0.3	Cyg X-1
308.1185  40.9485    1.4  29.9   17.2   1.8069   8.3    0.4	Cyg X-3
326.1898  38.3277    4.5  21.6   44.0   0.5383   2.5    0.9	Cyg X-2
  1.7150  18.5198    2.2  31.5  131.3   1.6682   5.4 ------	UNKNOWN
345.4014  19.3923    2.9  16.1  127.8   0.8153   4.0 ------	UNKNOWN
288.2746  39.9964    2.4  41.8    1.2   1.5316   4.8 ------	UNKNOWN
359.3392 -13.0381    2.7  42.6 -177.9   1.3754   4.2 ------	UNKNOWN
333.7745  -0.9167    2.4  18.5 -147.0   0.9223   4.8 ------	UNKNOWN
344.6352 -18.6544    2.6  38.9 -155.2   1.3991   4.4 ------	UNKNOWN
  4.2901 -31.1482    3.0  59.0 -166.2   6.8941   3.8 ------	UNKNOWN
Pre-slew background subtracted image of 15-350 keV band
Time interval of the image:
-0.896000 22.104000

# RAcent  DECcent POSerr Theta    Phi  PeakCts   SNR AngSep     Name
#  [deg]    [deg]    ['] [deg]  [deg]                   [']
288.8473  10.7383   17.1  39.1  -44.4   0.0503   0.7   12.8	GRS 1915+105
299.4214  35.1297    6.0  31.8    0.0   0.0963   1.9    9.3	Cyg X-1
308.2726  40.9512   18.1  29.8   17.3  -0.0336  -0.6    7.4	Cyg X-3
325.9448  38.3394    5.6  21.6   43.5  -0.0979  -2.0   10.7	Cyg X-2
355.3316 -20.9543    2.5  46.0 -166.3   0.3642   4.6 ------	UNKNOWN
328.8412  -1.8360    1.5  18.7 -131.2   0.3379   7.5 ------	UNKNOWN
325.5025 -21.9398    2.3  38.9 -126.0   0.3949   5.1 ------	UNKNOWN
Post-slew image of 15-350 keV band
Time interval of the image:
Plot creation:
Sun May 31 14:48:56 EDT 2015