Special notes of this burst
Image
Pre-slew 15.0-350.0 keV image (Event data)
#   RAcent    DECcent   POSerr    Theta     Phi              Peak Cts       SNR   Name
  147.0191    31.9314   0.0095    16.3729   -14.4375         0.7151399     20.073 TRIG_00176453

Foreground time interval of the image:
 -4.024  11.197 (delta_t =  15.221 [sec])
Background time interval of the image:
-299.704  -4.024 (delta_t = 295.680 [sec])
Lightcurves
Notes:
- 1) The mask-weighted light curves are using the flight position.
- 2) Multiple plots of different time binning/intervals are shown to cover all scenarios of short/long GRBs, rate/image triggers, and real/false positives.
- 3) For all the mask-weighted lightcurves, the y-axis units are counts/sec/det where a det is 0.4 x 0.4 = 0.16 sq cm.
- 4) The verticle lines correspond to following: green dotted lines are T50 interval, black dotted lines are T90 interval, blue solid line(s) is a spacecraft slew start time, and orange solid line(s) is a spacecraft slew end time.
- 5) Time of each bin is in the middle of the bin.
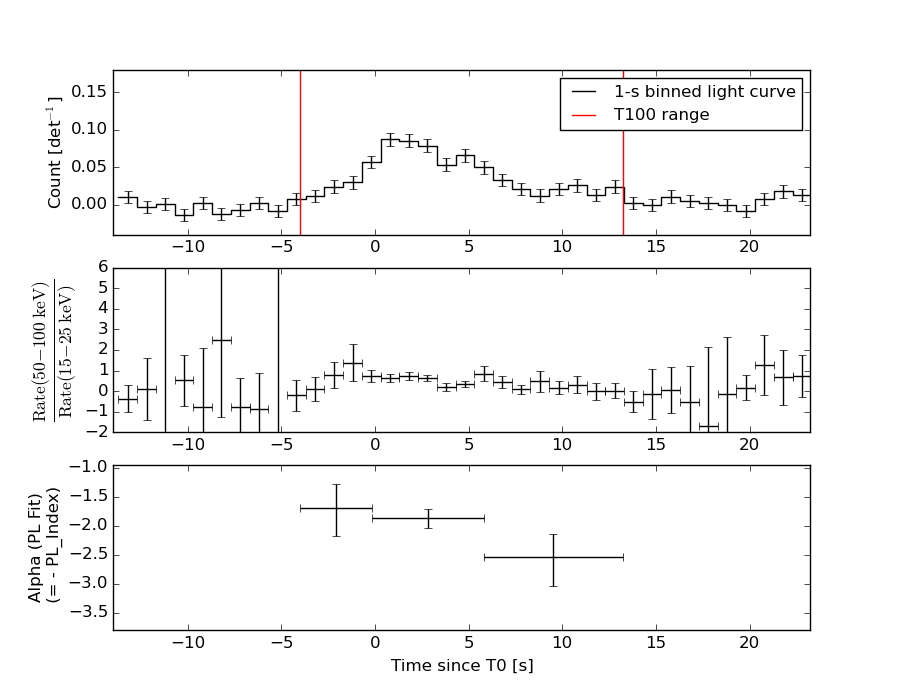
1 s binning
From T0-310 s to T0+310 s

From T100_start - 20 s to T100_end + 30 s
Full time interval
64 ms binning
Full time interval
From T100_start to T100_end
From T0-5 sec to T0+5 sec
16 ms binning
From T100_start-5 s to T100_start+5 s
Blue+Cyan dotted lines: Time interval of the scaled map
From 0.000000 to 1.024000
8 ms binning
From T100_start-3 s to T100_start+3 s
Blue+Cyan dotted lines: Time interval of the scaled map
From 0.000000 to 1.024000
2 ms binning
From T100_start-1 s to T100_start+1 s

Blue+Cyan dotted lines: Time interval of the scaled map
From 0.000000 to 1.024000
SN=5 or 10 sec. binning (whichever binning is satisfied first)
SN=5 or 10 sec. binning (T < 200 sec)
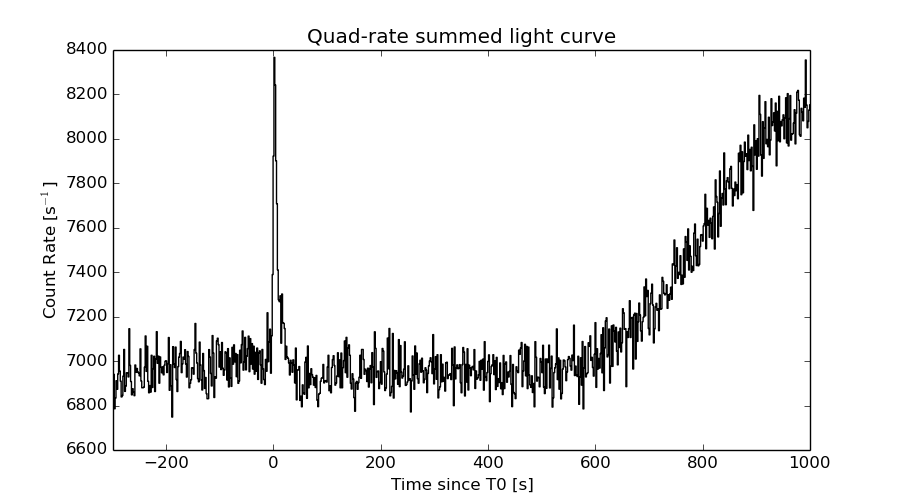
Quad-rate summed light curves (from T0-300s to T0+1000s)
Spectral Evolution
Spectra
Notes:
- 1) The fitting includes the systematic errors.
- 2) When the burst includes telescope slew time periods, the fitting uses an average response file made from multiple 5-s response files through out the slew time plus single time preiod for the non-slew times, and weighted by the total counts in the corresponding time period using addrmf. An average response file is needed becuase a spectral fit using the pre-slew DRM will introduce some errors in both a spectral shape and a normalization if the PHA file contains a lot of the slew/post-slew time interval.
- 3) For fits to more complicated models (e.g. a power-law over a cutoff power-law), the BAT team has decided to require a chi-square improvement of more than 6 for each extra dof.
Time averaged spectrum fit using the average DRM
Power-law model

Time interval is from   -4.024 sec. to   13.228 sec.

Spectral model in power-law:
------------------------------------------------------------
Parameters  : value       lower 90%   higher 90%
Photon index: 1.99738     ( -0.161021   0.168319 )
Norm@50keV  : 2.33748E-03    ( -0.000246744   0.000241177 )
------------------------------------------------------------
#Fit statistic : Chi-Squared =          49.82 using 59 PHA bins.
# Reduced chi-squared =         0.8740 for     57 degrees of freedom
# Null hypothesis probability =   7.388576e-01

Photon flux (15-150 keV)    in 17.25 sec: 0.350200 ( -0.0284988  0.0285154 ) ph/cm2/s
Energy fluence (15-150 keV)             : 3.71786e-07 ( -3.65262e-08  3.71857e-08 ) ergs/cm2
Cutoff power-law model

Time interval is from   -4.024 sec. to   13.228 sec.
Spectral model in the cutoff power-law:
------------------------------------------------------------
Parameters  : value       lower 90%   higher 90%
Photon index: 2.00634     ( -0.627952   0.103813 )
Epeak [keV] : 30.3610      (   )
Norm@50keV  : 2.31054E-03    (     )
------------------------------------------------------------
#Fit statistic : Chi-Squared =          49.82 using 59 PHA bins.
# Reduced chi-squared =         0.8896 for     56 degrees of freedom
# Null hypothesis probability =   7.065648e-01

Photon flux (15-150 keV)    in 17.25 sec: 0.350108 ( -0.028527  0.02846 ) ph/cm2/s
Energy fluence (15-150 keV)             : 3.71691e-07 ( -4.26851e-08  3.68443e-08 ) ergs/cm2
Band function
Time interval is from   -4.024 sec. to   13.228 sec.

Spectral model in the Band function:
------------------------------------------------------------
Parameters  : value       lower 90%   higher 90%
alpha       : -1.59802   ( 1.59803   1.59803 )
beta        : -1.99751    ( 1.99751   0.16119 )
Epeak [keV] : 15.4775      ( -15.4753 -15.4753 )
Norm@50keV   : 5.58168E-03    ( -0.0034196   13.4615 )
------------------------------------------------------------
#Fit statistic : Chi-Squared =          49.82 using 59 PHA bins.
# Reduced chi-squared =         0.9058 for     55 degrees of freedom
# Null hypothesis probability =   6.722793e-01

Photon flux (15-150 keV)    in 17.25 sec:  (    ) ph/cm2/s
Energy fluence (15-150 keV)             : 0 ( 0  0 ) ergs/cm2
Single BB
Spectral model blackbody:
------------------------------------------------------------
Parameters  : value    Lower 90%  Upper 90%
kT [keV]    : 9.99500  (-1.06841  1.19809)
R^2/D10^2   : 0.156418  (-0.054703   0.0849621)
(R is the radius in km and D10 is the distance to the source in units of 10 kpc)
------------------------------------------------------------
#Fit statistic : Chi-Squared =          93.24 using 59 PHA bins.
# Reduced chi-squared =          1.636 for     57 degrees of freedom
# Null hypothesis probability =   1.742931e-03

Energy  Fluence     90% Error
[keV]   [erg/cm2]   [erg/cm2]
15- 25  5.489e-08   7.918e-09
25- 50  1.364e-07   1.428e-08
50-150  7.107e-08   1.654e-08
15-150  2.623e-07   2.769e-08
Thermal bremsstrahlung (OTTB)
Spectral model: thermal bremsstrahlung
------------------------------------------------------------
Parameters  : value         Lower 90%    Upper 90%
kT [keV]    : 70.1185       (-17.2968      26.6596)
Norm        : 1.69785       (-0.223701     0.271438)
------------------------------------------------------------
#Fit statistic : Chi-Squared =          53.10 using 59 PHA bins.
# Reduced chi-squared =         0.9317 for     57 degrees of freedom
# Null hypothesis probability =   6.219546e-01

Energy  Fluence     90% Error
[keV]   [erg/cm2]   [erg/cm2]
15- 25  7.515e-08   8.099e-09
25- 50  1.196e-07   1.126e-08
50-150  1.538e-07   3.295e-08
15-150  3.486e-07   4.036e-08
Double BB
Spectral model: bbodyrad<1> + bbodyrad<2>
------------------------------------------------------------
Parameters  : value         Lower 90%    Upper 90%
kT1 [keV]   : 4.79791        (-1.10952      1.3837)
R1^2/D10^2  : 1.96911        (-1.2219      4.2528)
kT2 [keV]   : 18.4024        (-3.85669      6.87708)
R2^2/D10^2  : 1.19826E-02    (-0.0083861   0.0110171)
------------------------------------------------------------
#Fit statistic : Chi-Squared =          51.56 using 59 PHA bins.
# Reduced chi-squared =         0.9375 for     55 degrees of freedom
# Null hypothesis probability =   6.067139e-01

Energy  Fluence     90% Error
[keV]   [erg/cm2]   [erg/cm2]
15- 25  8.375e-08   2.989e-08
25- 50  1.065e-07   3.088e-08
50-150  1.630e-07   7.741e-08
15-150  3.533e-07   1.095e-07
Peak spectrum fit
Power-law model
Time interval is from    0.604 sec. to    1.604 sec.

Spectral model in power-law:
------------------------------------------------------------
Parameters  : value       lower 90%   higher 90%
Photon index: 1.67550     ( -0.253541   0.265274 )
Norm@50keV  : 5.68579E-03    ( -0.000986892   0.000965753 )
------------------------------------------------------------
#Fit statistic : Chi-Squared =          52.62 using 59 PHA bins.
# Reduced chi-squared =         0.9231 for     57 degrees of freedom
# Null hypothesis probability =   6.400871e-01

Photon flux (15-150 keV)    in 1 sec: 0.748786 ( -0.115031  0.115054 ) ph/cm2/s
Energy fluence (15-150 keV)             : 5.27525e-08 ( -9.5228e-09  9.73622e-09 ) ergs/cm2
Cutoff power-law model
Time interval is from    0.604 sec. to    1.604 sec.
Spectral model in the cutoff power-law:
------------------------------------------------------------
Parameters  : value       lower 90%   higher 90%
Photon index: 0.545320     ( -1.87538   1.22998 )
Epeak [keV] : 55.3235      ( -14.0328 -55.282 )
Norm@50keV  : 2.49732E-02    ( -0.0250827   0.275514 )
------------------------------------------------------------
#Fit statistic : Chi-Squared =          50.53 using 59 PHA bins.
# Reduced chi-squared =         0.9023 for     56 degrees of freedom
# Null hypothesis probability =   6.812568e-01

Photon flux (15-150 keV)    in 1 sec: 0.724754 ( -0.119275  0.119065 ) ph/cm2/s
Energy fluence (15-150 keV)             : 4.73173e-08 ( -1.04372e-08  1.16016e-08 ) ergs/cm2
Band function
Time interval is from    0.604 sec. to    1.604 sec.

Spectral model in the Band function:
------------------------------------------------------------
Parameters  : value       lower 90%   higher 90%
alpha       : -0.163150   ( -1.36638   5.10458 )
beta        : -2.35721    ( 2.34944   0.735318 )
Epeak [keV] : 48.6061      ( -24.5008 73.7782 )
Norm@50keV   : 4.40231E-02    ( -0.0505873   143.337 )
------------------------------------------------------------
#Fit statistic : Chi-Squared =          49.68 using 59 PHA bins.
# Reduced chi-squared =         0.9033 for     55 degrees of freedom
# Null hypothesis probability =   6.774168e-01

Photon flux (15-150 keV)    in 1 sec:  (    ) ph/cm2/s
Energy fluence (15-150 keV)             : 4.91022e-08 ( 0  0 ) ergs/cm2
Single BB
Spectral model blackbody:
------------------------------------------------------------
Parameters  : value    Lower 90%  Upper 90%
kT [keV]    : 11.7121  (-1.77614  2.14049)
R^2/D10^2   : 0.210396  (-0.0973341   0.172726)
(R is the radius in km and D10 is the distance to the source in units of 10 kpc)
------------------------------------------------------------
#Fit statistic : Chi-Squared =          53.78 using 59 PHA bins.
# Reduced chi-squared =         0.9435 for     57 degrees of freedom
# Null hypothesis probability =   5.966393e-01

Energy  Fluence     90% Error
[keV]   [erg/cm2]   [erg/cm2]
15- 25  6.090e-09   1.761e-09
25- 50  1.862e-08   3.710e-09
50-150  1.510e-08   5.385e-09
15-150  3.981e-08   9.015e-09
Thermal bremsstrahlung (OTTB)
Spectral model: thermal bremsstrahlung
------------------------------------------------------------
Parameters  : value         Lower 90%    Upper 90%
kT [keV]    : 123.495       (-54.4314      -122.479)
Norm        : 3.20878       (-0.590101     0.731392)
------------------------------------------------------------
#Fit statistic : Chi-Squared =          51.26 using 59 PHA bins.
# Reduced chi-squared =         0.8993 for     57 degrees of freedom
# Null hypothesis probability =   6.893042e-01

Energy  Fluence     90% Error
[keV]   [erg/cm2]   [erg/cm2]
15- 25  8.347e-09   3.036e-09
25- 50  1.501e-08   6.121e-09
50-150  2.716e-08   1.751e-08
15-150  5.051e-08   2.664e-08
Double BB
------------------------------------------------------------
Parameters  : value         Lower 90%    Upper 90%
kT1 [keV]   : 10.2088        (-4.73105      2.16898)
R1^2/D10^2  : 0.317266        (-0.170197      1.06425)
kT2 [keV]   : 200.000        (      )
R2^2/D10^2  : 6.22660E-05    (-3.85744e-05   0.000492151)
------------------------------------------------------------
#Fit statistic : Chi-Squared =          48.73 using 59 PHA bins.
#Fit statistic : Chi-Squared =          48.59 using 59 PHA bins.
# Reduced chi-squared =         0.8859 for     55 degrees of freedom
# Reduced chi-squared =         0.8834 for     55 degrees of freedom
# Null hypothesis probability =   7.116997e-01
# Null hypothesis probability =   7.164938e-01

Energy  Fluence     90% Error
[keV]   [erg/cm2]   [erg/cm2]
15- 25  6.961e-09   2.963e-09
25- 50  1.791e-08   7.301e-09
50-150  2.644e-08   1.282e-08
15-150  5.131e-08   1.961e-08
Pre-slew spectrum (Pre-slew PHA with pre-slew DRM)
Power-law model
Spectral model in power-law:
------------------------------------------------------------
Parameters  : value       lower 90%   higher 90%
Photon index: 1.94572     ( -0.157706   0.164405 )
Norm@50keV  : 2.53393E-03    ( -0.000259714   0.000254221 )
------------------------------------------------------------
#Fit statistic : Chi-Squared =          53.21 using 59 PHA bins.
# Reduced chi-squared =         0.9334 for     57 degrees of freedom
# Null hypothesis probability =   6.181949e-01

Photon flux (15-150 keV)    in 15.22 sec: 0.370910 ( -0.0302513  0.0302705 ) ph/cm2/s
Energy fluence (15-150 keV)             : 3.54866e-07 ( -3.46958e-08  3.52795e-08 ) ergs/cm2
Cutoff power-law model
Spectral model in the cutoff power-law:
------------------------------------------------------------
Parameters  : value       lower 90%   higher 90%
Photon index: 1.82494     (     )
Epeak [keV] : 63.2857      (   )
Norm@50keV  : 2.96115E-03    (     )
------------------------------------------------------------
#Fit statistic : Chi-Squared =          53.08 using 59 PHA bins.
# Reduced chi-squared =         0.9479 for     56 degrees of freedom
# Null hypothesis probability =   5.859552e-01

Photon flux (15-150 keV)    in 15.22 sec: 0.368730 ( -0.031533  0.031569 ) ph/cm2/s
Energy fluence (15-150 keV)             : 3.50503e-07 ( -4.06146e-08  3.86314e-08 ) ergs/cm2
Band function
Spectral model in the Band function:
------------------------------------------------------------
Parameters  : value       lower 90%   higher 90%
alpha       : -1.81085   ( 1.55906   1.55906 )
beta        : -2.15878    ( 2.14011   0.348499 )
Epeak [keV] : 59.9488      ( -59.936 -59.936 )
Norm@50keV   : 3.02223E-03    ( -0.000702574   0.0650142 )
------------------------------------------------------------
#Fit statistic : Chi-Squared =          53.08 using 59 PHA bins.
# Reduced chi-squared =         0.9651 for     55 degrees of freedom
# Null hypothesis probability =   5.482556e-01

Photon flux (15-150 keV)    in 15.22 sec:  (    ) ph/cm2/s
Energy fluence (15-150 keV)             : 0 ( 0  0 ) ergs/cm2
S(25-50 keV) vs. S(50-100 keV) plot
S(25-50 keV)  = 1.12e-07
S(50-100 keV) = 1.12e-07
T90 vs. Hardness ratio plot
T90                                   = 14.2200000286102 sec.
Hardness ratio (energy fluence ratio) = 1
Color vs. Color plot
Count Ratio  (25-50 keV) / (15-25 keV) = 0.85441
Count Ratio (50-100 keV) / (15-25 keV) = 0.495348
Mask shadow pattern
IMX = 2.845244767049336E-01, IMY = 7.325220387693542E-02
TIME vs. PHA plot around the trigger time
Blue+Cyan dotted lines: Time interval of the scaled map
From 0.000000 to 1.024000
TIME vs. DetID plot around the trigger time
Blue+Cyan dotted lines: Time interval of the scaled map
From 0.000000 to 1.024000
100 us light curve (15-350 keV)
Blue+Cyan dotted lines: Time interval of the scaled map
From 0.000000 to 1.024000
Spacecraft aspect plot
Bright source in the pre-burst/pre-slew/post-slew images
Pre-burst image of 15-350 keV band
Time interval of the image:
-299.704000 -4.024000

# RAcent  DECcent POSerr Theta    Phi  PeakCts   SNR AngSep     Name
#  [deg]    [deg]    ['] [deg]  [deg]                   [']
 83.6330  22.0156    0.4  41.1  144.0  12.2611  25.9    0.1	Crab
191.6780  34.3330    2.7  50.7  -44.4   4.1510   4.3 ------	UNKNOWN
187.3989  50.1064    3.0  43.6  -64.2   3.7623   3.8 ------	UNKNOWN
145.7057  79.6174    3.0  43.1 -112.7   3.2062   3.8 ------	UNKNOWN
Pre-slew background subtracted image of 15-350 keV band
Time interval of the image:
-4.024000 11.196590

# RAcent  DECcent POSerr Theta    Phi  PeakCts   SNR AngSep     Name
#  [deg]    [deg]    ['] [deg]  [deg]                   [']
 83.5200  21.9072    5.4  41.2  143.9   0.1685   2.1    9.0	Crab
147.0191  31.9313    0.6  16.4  -14.4   0.7150  20.0 ------	UNKNOWN
 46.9241  46.8349    2.5  58.4 -169.8   0.8768   4.6 ------	UNKNOWN
188.7064  45.7971    2.3  45.1  -58.3   0.7435   5.0 ------	UNKNOWN
Post-slew image of 15-350 keV band
Time interval of the image:
73.196600 302.352300

# RAcent  DECcent POSerr Theta    Phi  PeakCts   SNR AngSep     Name
#  [deg]    [deg]    ['] [deg]  [deg]                   [']
 82.1988  69.2800    3.1  51.5  162.9   2.0762   3.8 ------	UNKNOWN
135.3167  44.4224    3.1  15.5  154.3   0.5087   3.7 ------	UNKNOWN
164.0628  -1.3341    2.5  36.9  -22.3   0.8323   4.7 ------	UNKNOWN
244.3148  84.1193    2.9  59.1 -166.2   4.2010   4.0 ------	UNKNOWN
170.7315 -18.0851    2.9  54.9  -20.9   1.8920   4.0 ------	UNKNOWN
198.0841  62.5382    3.1  44.4 -142.1   1.1169   3.7 ------	UNKNOWN
184.3662  -4.2649    3.0  50.7  -44.5   3.0870   3.9 ------	UNKNOWN
192.7812  23.7254    2.8  41.0  -83.4   2.8509   4.1 ------	UNKNOWN
Plot creation:
Sun May 31 14:45:05 EDT 2015