Special notes of this burst
Image
Pre-slew 15.0-50.0 keV image (Event data)
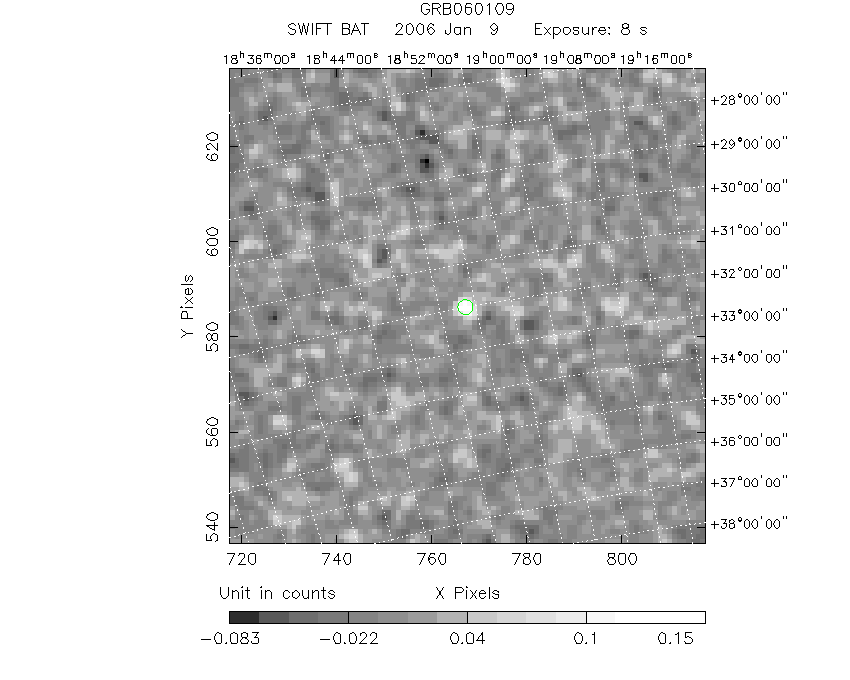
#RAcent DECcent POSerr Theta  Phi  Peak_Cts  SNR Name
282.710 31.990 0.000 18.273 -44.240 0.163 7.746 TRIG_00176620

Image time interval: 0.000 to 8.192 [sec]
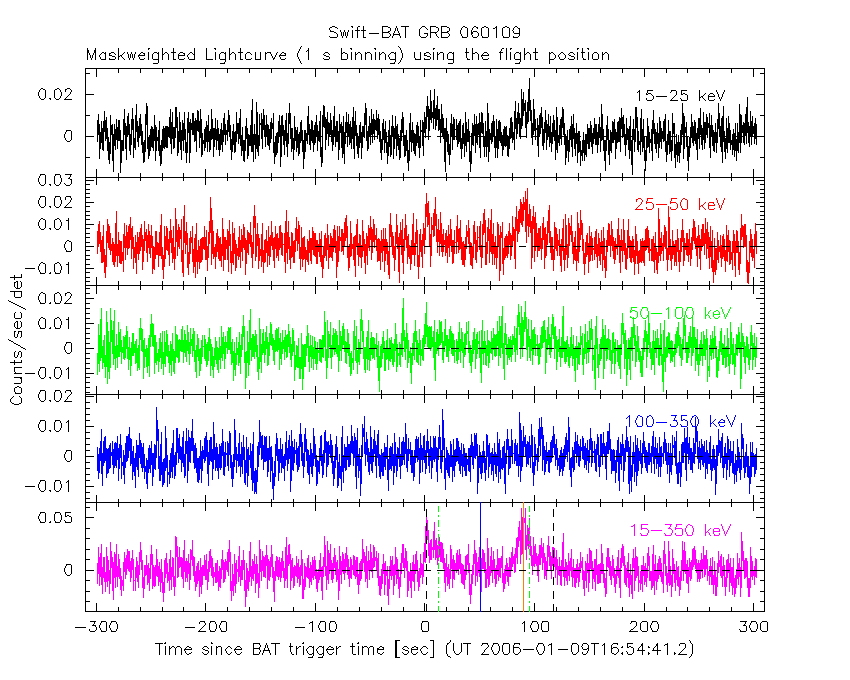
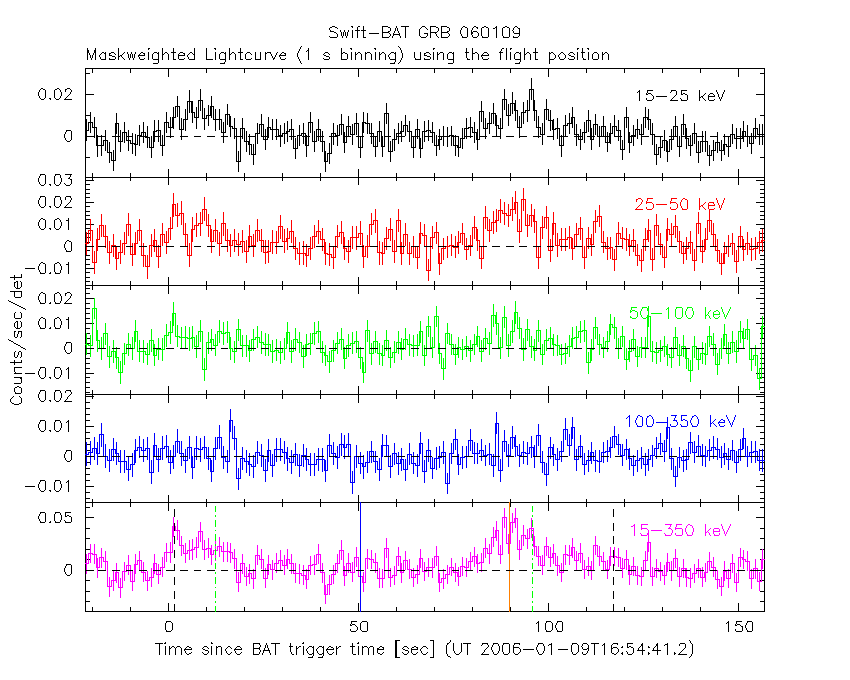
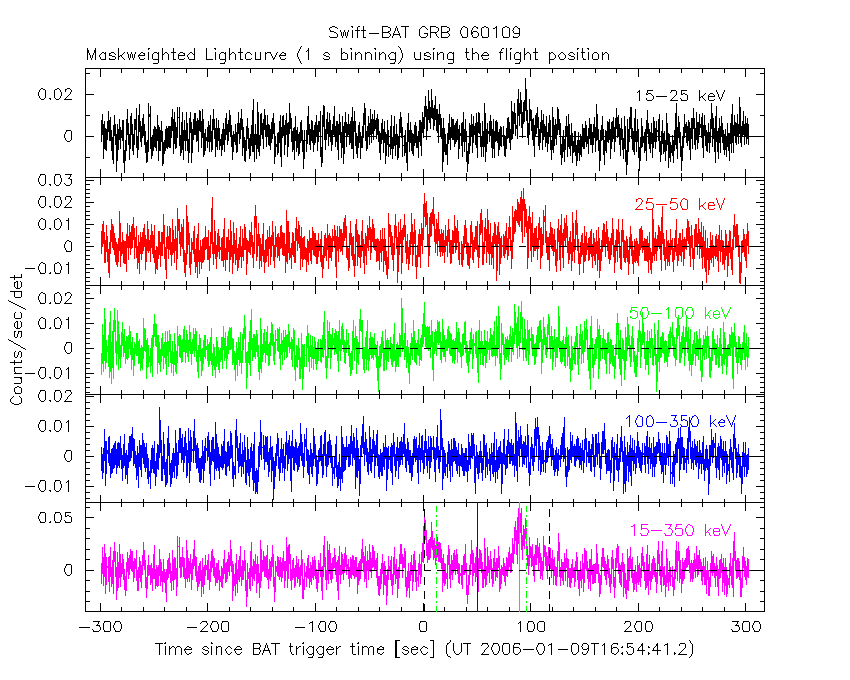
Lightcurves
Notes:
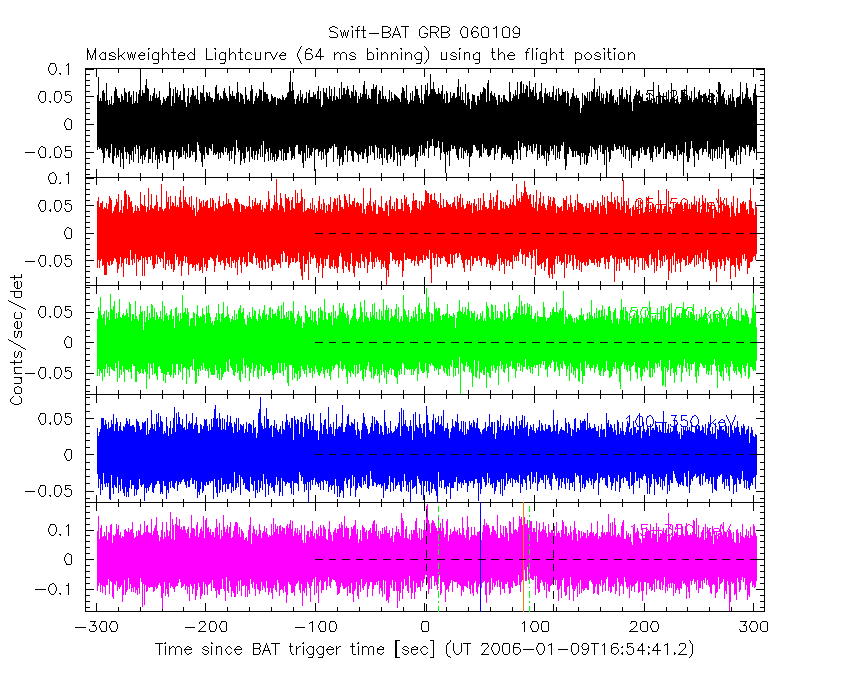
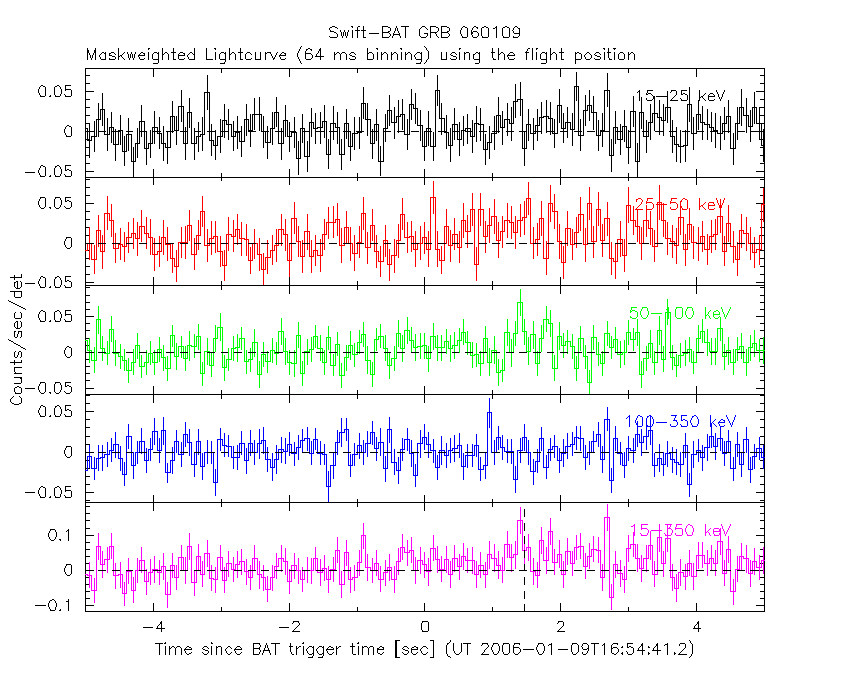
- 1) The mask-weighted light curves are using the flight position.
- 2) Multiple plots of different time binning/intervals are shown to cover all scenarios of short/long GRBs, rate/image triggers, and real/false positives.
- 3) For all the mask-weighted lightcurves, the y-axis units are counts/sec/det where a det is 0.4 x 0.4 = 0.16 sq cm.
- 4) The verticle lines correspond to following: green dotted lines are T50 interval, black dotted lines are T90 interval, blue solid line(s) is a spacecraft slew start time, and orange solid line(s) is a spacecraft slew end time.
- 5) Time of each bin is in the middle of the bin.
1 s binning
From T0-310 s to T0+310 s
From T100_start - 20 s to T100_end + 30 s
Full time interval
64 ms binning
Full time interval
From T100_start to T100_end
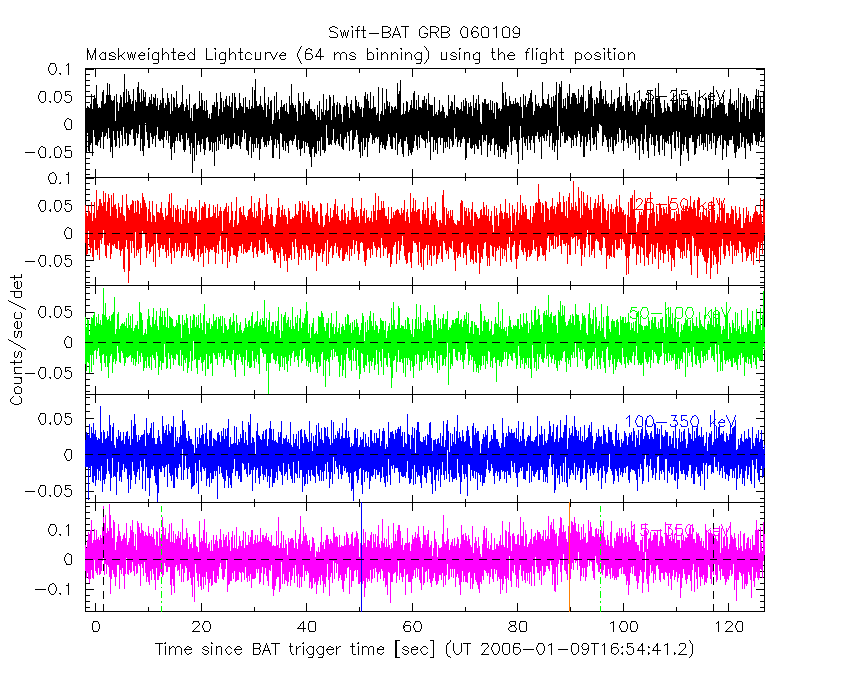
From T0-5 sec to T0+5 sec
16 ms binning
From T100_start-5 s to T100_start+5 s
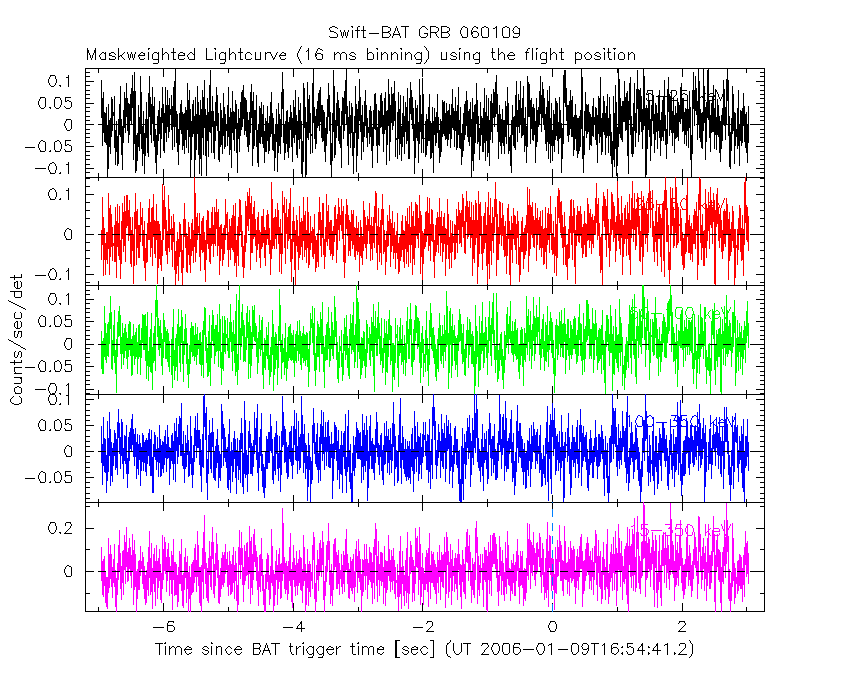
Blue+Cyan dotted lines: Time interval of the scaled map
From 0.000000 to 8.192000
8 ms binning
From T100_start-3 s to T100_start+3 s
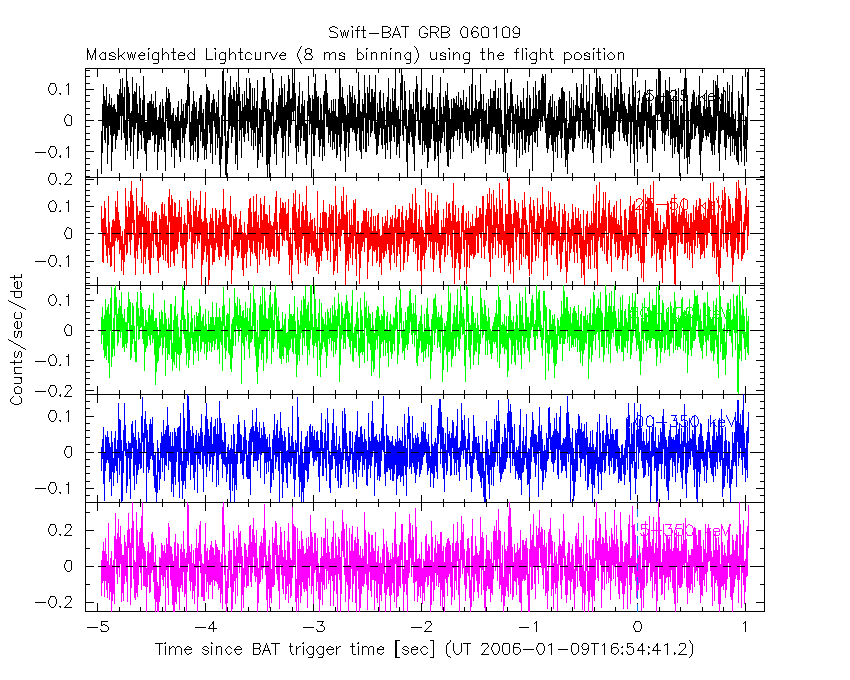
Blue+Cyan dotted lines: Time interval of the scaled map
From 0.000000 to 8.192000
2 ms binning
From T100_start-1 s to T100_start+1 s
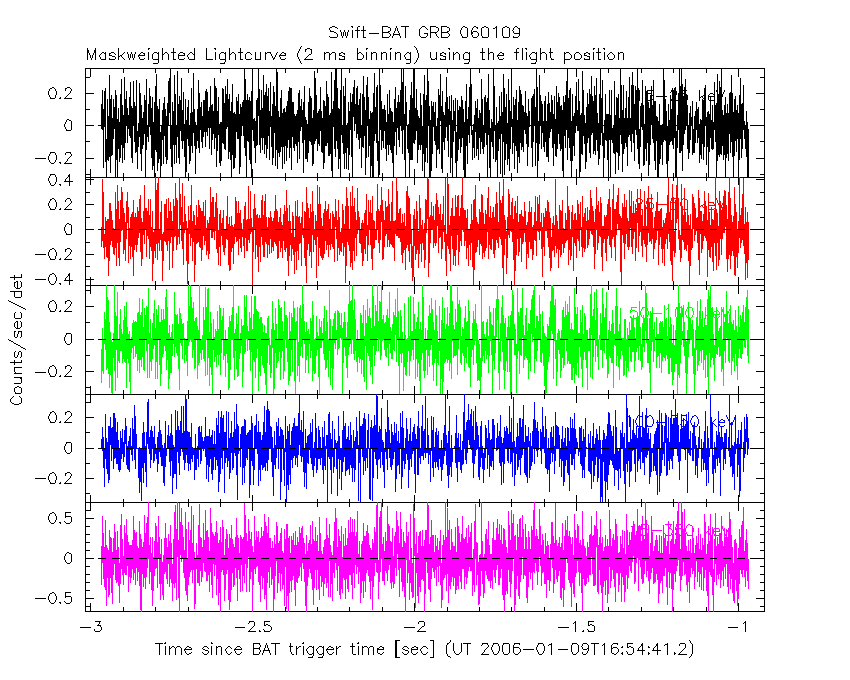
Blue+Cyan dotted lines: Time interval of the scaled map
From 0.000000 to 8.192000
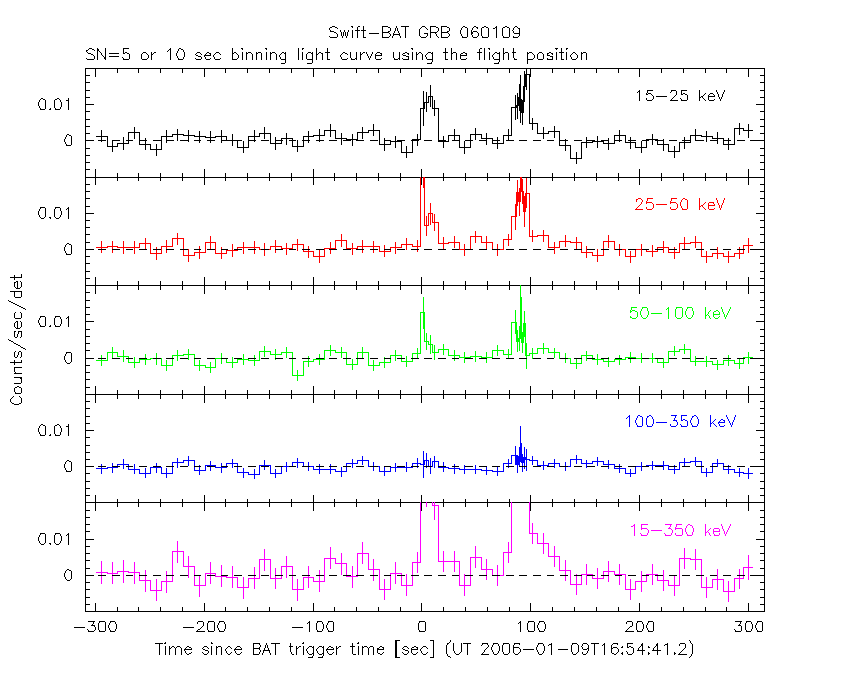
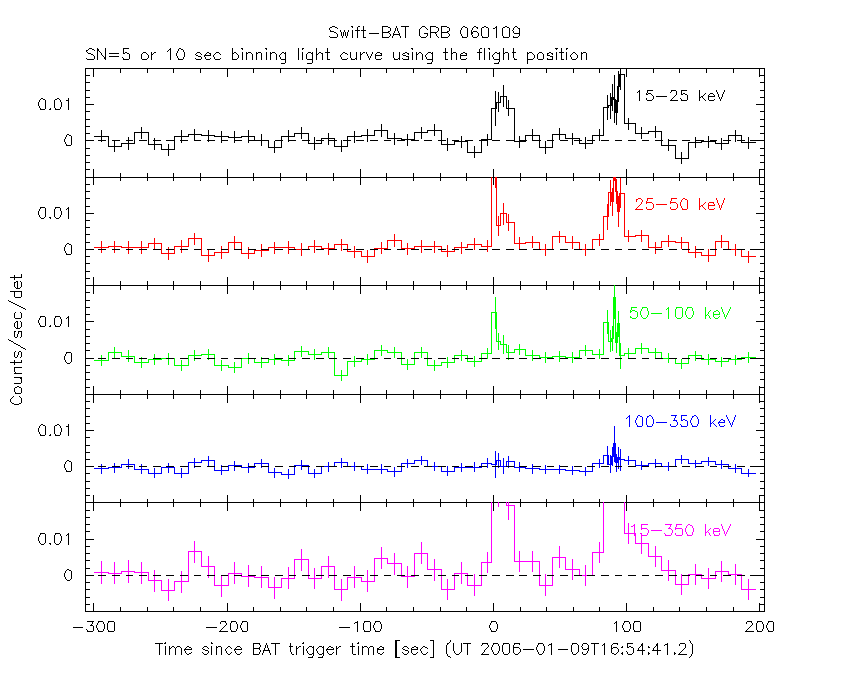
SN=5 or 10 sec. binning (whichever binning is satisfied first)
SN=5 or 10 sec. binning (T < 200 sec)
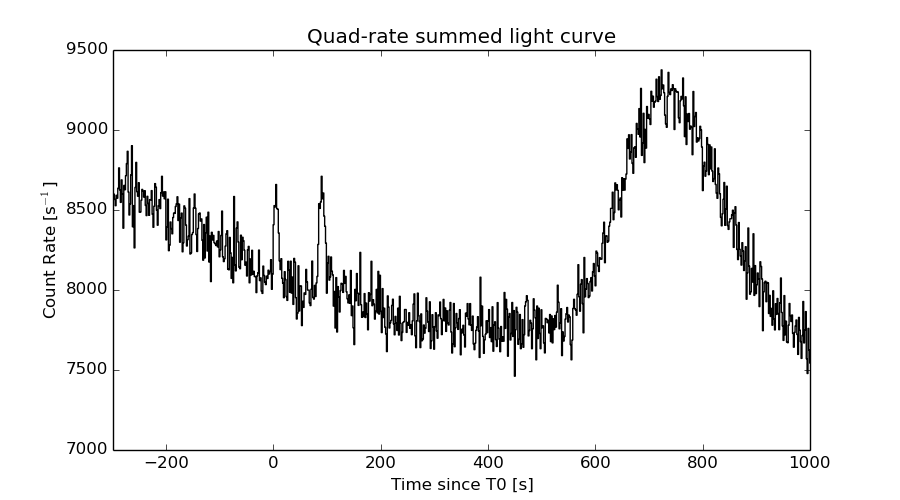
Quad-rate summed light curves (from T0-300s to T0+1000s)
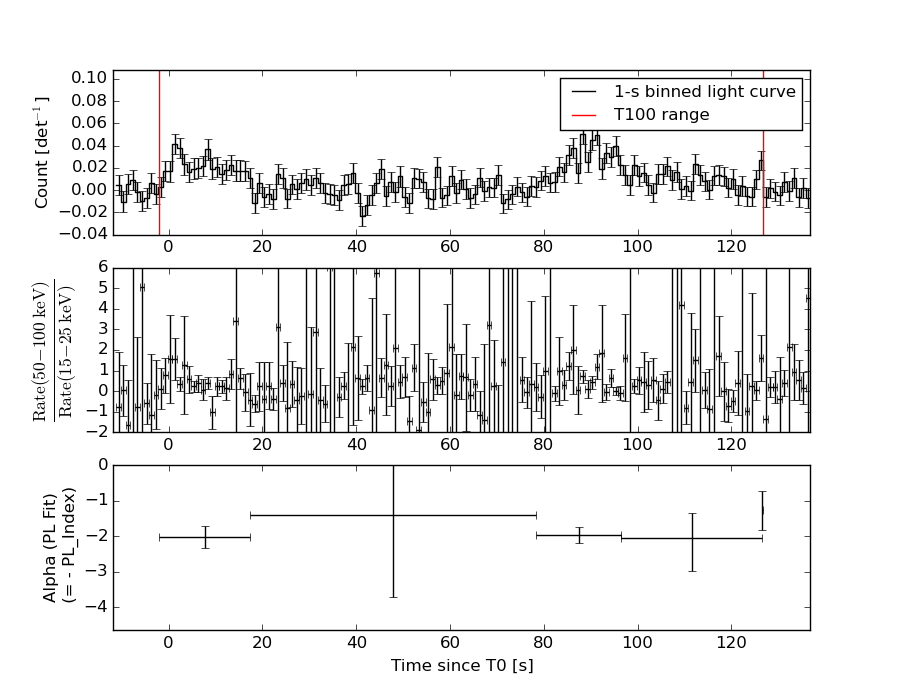
Spectral Evolution
Spectra
Notes:
- 1) The fitting includes the systematic errors.
- 2) When the burst includes telescope slew time periods, the fitting uses an average response file made from multiple 5-s response files through out the slew time plus single time preiod for the non-slew times, and weighted by the total counts in the corresponding time period using addrmf. An average response file is needed becuase a spectral fit using the pre-slew DRM will introduce some errors in both a spectral shape and a normalization if the PHA file contains a lot of the slew/post-slew time interval.
- 3) For fits to more complicated models (e.g. a power-law over a cutoff power-law), the BAT team has decided to require a chi-square improvement of more than 6 for each extra dof.
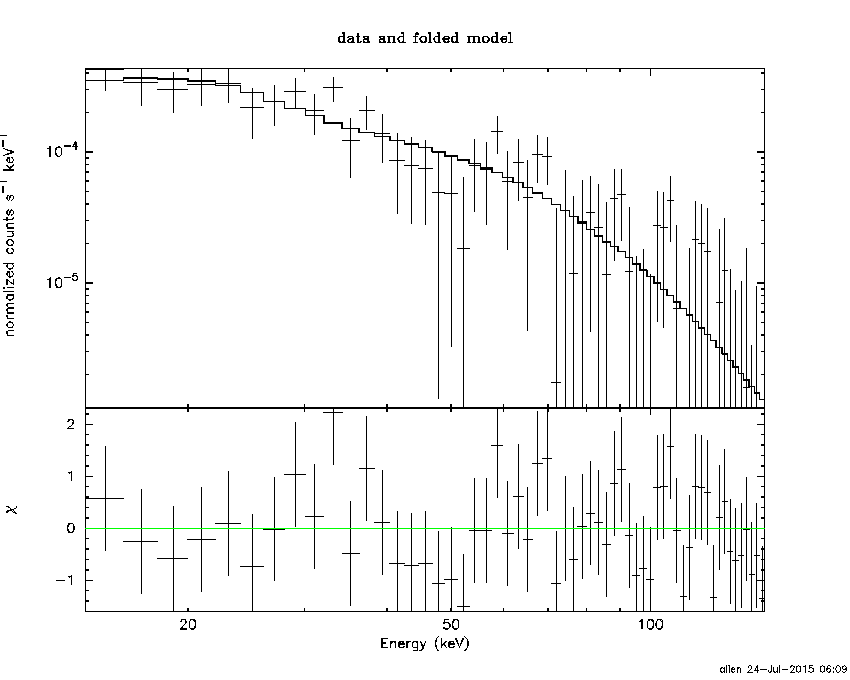
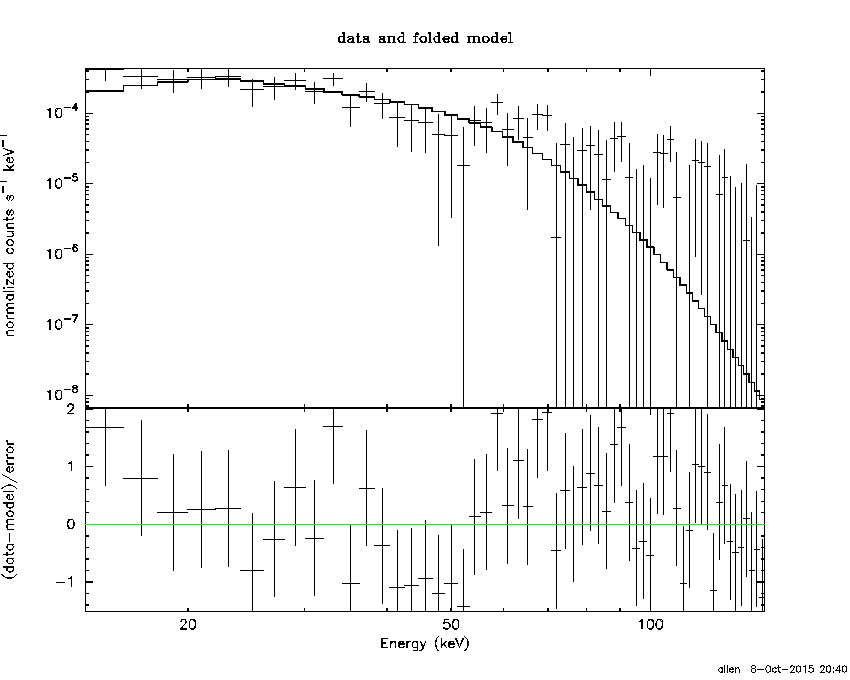
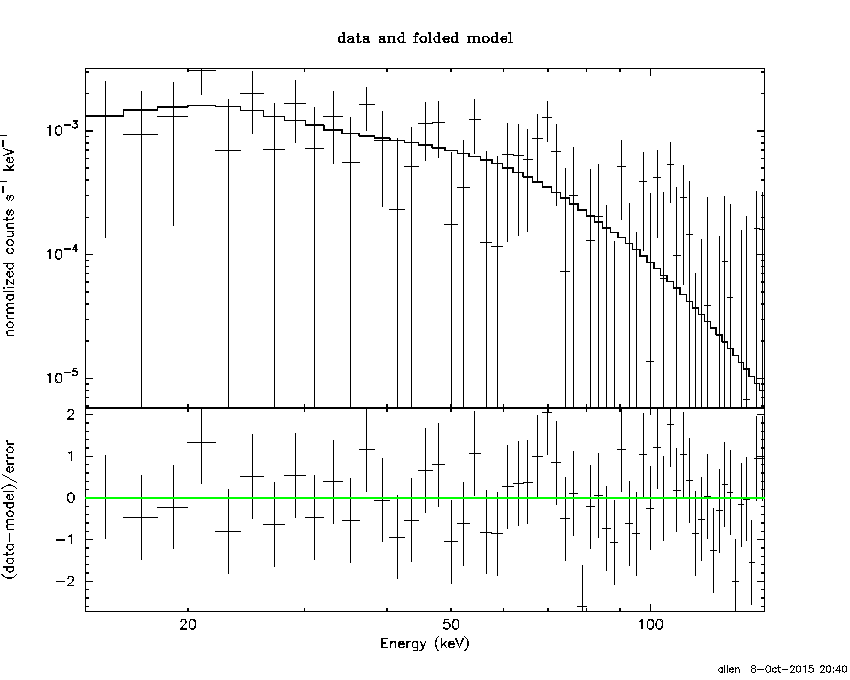
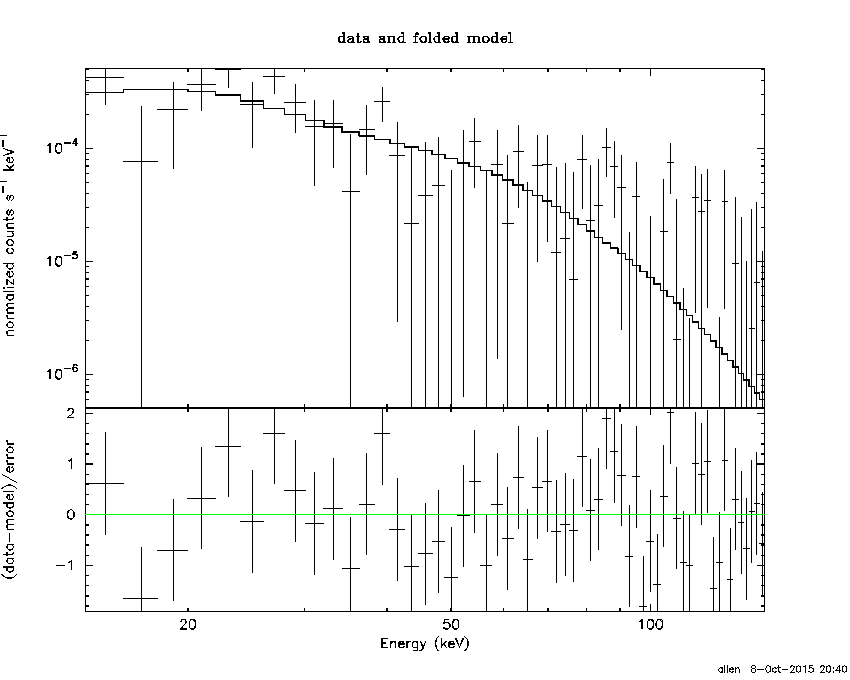
Time averaged spectrum fit using the average DRM
Power-law model

Time interval is from   -1.968 sec. to  126.768 sec.

Spectral model in power-law:
------------------------------------------------------------
Parameters  : value       lower 90%   higher 90%
Photon index: 1.88922     ( -0.228046   0.242888 )
Norm@50keV  : 5.57795E-04    ( -8.94779e-05   8.70886e-05 )
------------------------------------------------------------
#Fit statistic : Chi-Squared =          41.77 using 59 PHA bins.
# Reduced chi-squared =         0.7329 for     57 degrees of freedom
# Null hypothesis probability =   9.349251e-01

Photon flux (15-150 keV)    in 128.7 sec: 7.96855E-02 ( -0.0101102  0.0101106 ) ph/cm2/s
Energy fluence (15-150 keV)             : 6.59953e-07 ( -1.02435e-07  1.05296e-07 ) ergs/cm2
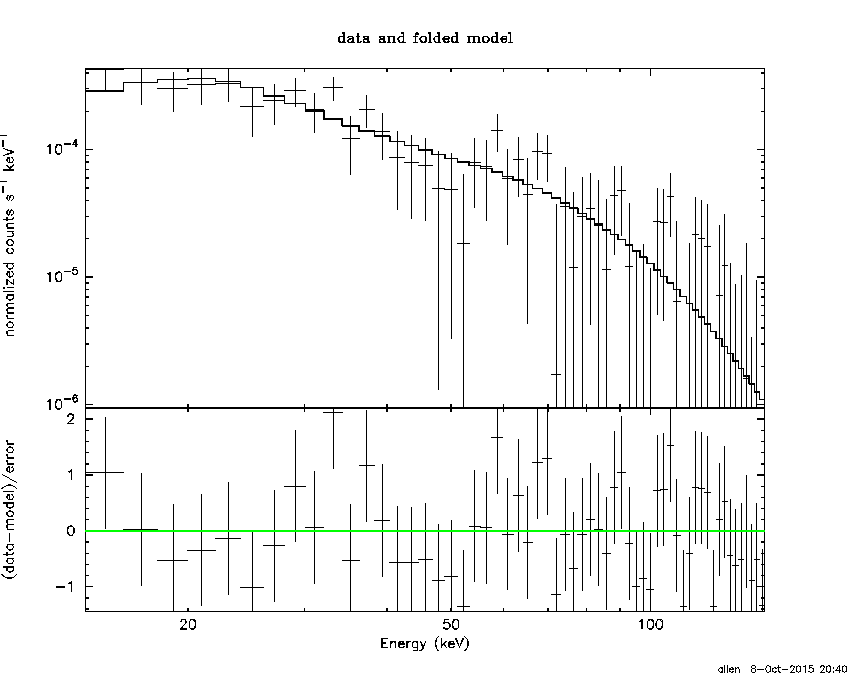
Cutoff power-law model
Time interval is from   -1.968 sec. to  126.768 sec.
Spectral model in the cutoff power-law:
------------------------------------------------------------
Parameters  : value       lower 90%   higher 90%
Photon index: 1.30705     ( -1.10097   0.863022 )
Epeak [keV] : 50.2172      ( -40.4623 -50.2172 )
Norm@50keV  : 1.20671E-03    ( -0.00120671   0.00409062 )
------------------------------------------------------------
#Fit statistic : Chi-Squared =          40.50 using 59 PHA bins.
# Reduced chi-squared =         0.7232 for     56 degrees of freedom
# Null hypothesis probability =   9.409184e-01

Photon flux (15-150 keV)    in 128.7 sec: 7.80610E-02 ( -0.0103637  0.0103769 ) ph/cm2/s
Energy fluence (15-150 keV)             : 6.21588e-07 ( -1.13147e-07  1.19257e-07 ) ergs/cm2
Band function
Time interval is from   -1.968 sec. to  126.768 sec.

Spectral model in the Band function:
------------------------------------------------------------
Parameters  : value       lower 90%   higher 90%
alpha       : -1.30707   ( -4.35656   1.41228 )
beta        : -10.0000    ( 10   3.55271e-15 )
Epeak [keV] : 50.2081      ( -32.3987 -50.2081 )
Norm@50keV   : 1.20654E-03    ( -0.0007132   0.00410702 )
------------------------------------------------------------
#Fit statistic : Chi-Squared =          40.50 using 59 PHA bins.
# Reduced chi-squared =         0.7363 for     55 degrees of freedom
# Null hypothesis probability =   9.281471e-01

Photon flux (15-150 keV)    in 128.7 sec: 7.91058E-02 (    ) ph/cm2/s
Energy fluence (15-150 keV)             : 6.22302e-07 ( -6.21401e-07  -1.14283e-07 ) ergs/cm2
Single BB
Spectral model blackbody:
------------------------------------------------------------
Parameters  : value    Lower 90%  Upper 90%
kT [keV]    : 9.98044  (-1.47168  1.81038)
R^2/D10^2   : 3.76990E-02  (-0.0175523   0.0312279)
(R is the radius in km and D10 is the distance to the source in units of 10 kpc)
------------------------------------------------------------
#Fit statistic : Chi-Squared =          52.33 using 59 PHA bins.
# Reduced chi-squared =         0.9180 for     57 degrees of freedom
# Null hypothesis probability =   6.507578e-01

Energy  Fluence     90% Error
[keV]   [erg/cm2]   [erg/cm2]
15- 25  9.836e-08   2.282e-08
25- 50  2.439e-07   4.440e-08
50-150  1.266e-07   4.055e-08
15-150  4.688e-07   9.138e-08
Thermal bremsstrahlung (OTTB)

Spectral model: thermal bremsstrahlung
------------------------------------------------------------
Parameters  : value         Lower 90%    Upper 90%
kT [keV]    : 78.9855       (-27.2751      55.4324)
Norm        : 0.377218       (-0.0642682     0.0852261)
------------------------------------------------------------
#Fit statistic : Chi-Squared =          40.49 using 59 PHA bins.
# Reduced chi-squared =         0.7104 for     57 degrees of freedom
# Null hypothesis probability =   9.518176e-01

Energy  Fluence     90% Error
[keV]   [erg/cm2]   [erg/cm2]
15- 25  1.259e-07   2.194e-08
25- 50  2.066e-07   3.366e-08
50-150  2.891e-07   1.431e-07
15-150  6.215e-07   1.545e-07
Double BB
Spectral model: bbodyrad<1> + bbodyrad<2>
------------------------------------------------------------
Parameters  : value         Lower 90%    Upper 90%
kT1 [keV]   : 6.46715        (-1.86001      1.91817)
R1^2/D10^2  : 0.138903        (-0.0810242      0.146838)
kT2 [keV]   : 21.9016        (-7.23868      18.0257)
R2^2/D10^2  : 1.31863E-03    (-0.00115939   0.00537468)
------------------------------------------------------------
#Fit statistic : Chi-Squared =          39.41 using 59 PHA bins.
# Reduced chi-squared =         0.7165 for     55 degrees of freedom
# Null hypothesis probability =   9.441766e-01

Energy  Fluence     90% Error
[keV]   [erg/cm2]   [erg/cm2]
15- 25  1.249e-07   6.428e-08
25- 50  2.080e-07   1.077e-07
50-150  3.011e-07   1.707e-07
15-150  6.340e-07   3.390e-07
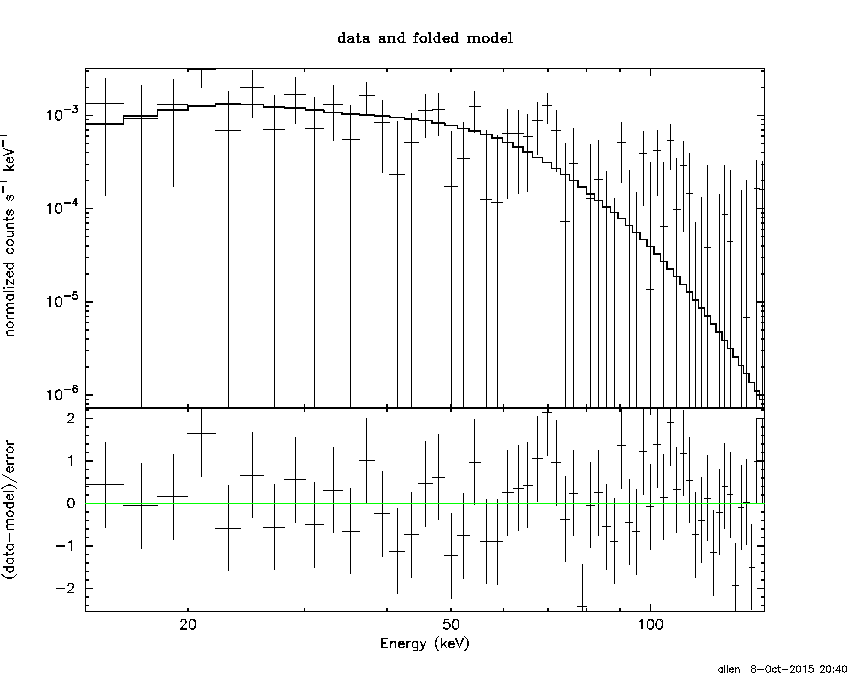
Peak spectrum fit
Power-law model
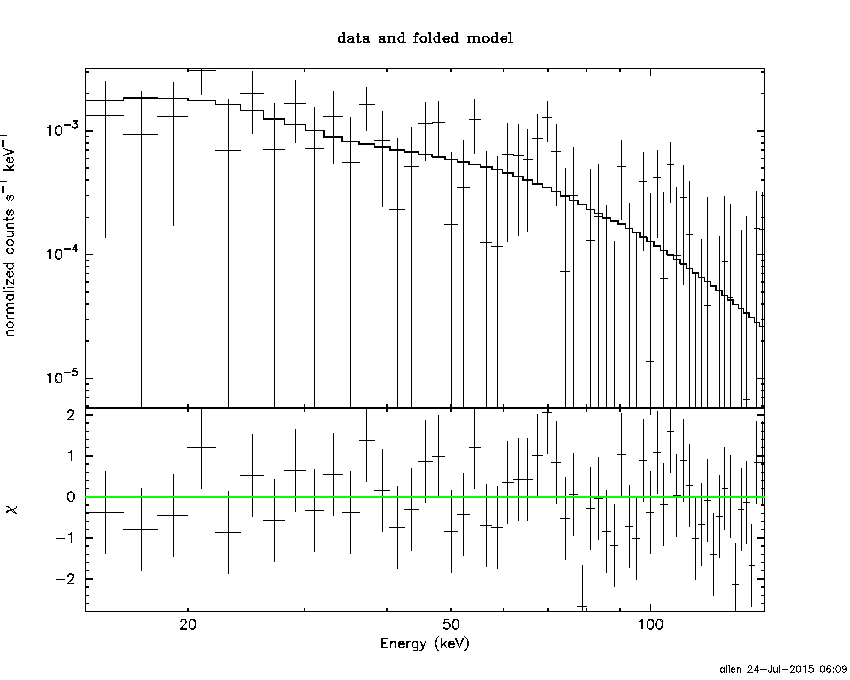
Time interval is from   90.184 sec. to   91.184 sec.

Spectral model in power-law:
------------------------------------------------------------
Parameters  : value       lower 90%   higher 90%
Photon index: 1.55475     ( -0.396908   0.414946 )
Norm@50keV  : 3.62834E-03    ( -0.000961393   0.000942157 )
------------------------------------------------------------
#Fit statistic : Chi-Squared =          49.16 using 59 PHA bins.
# Reduced chi-squared =         0.8625 for     57 degrees of freedom
# Null hypothesis probability =   7.604141e-01

Photon flux (15-150 keV)    in 1 sec: 0.459962 ( -0.113073  0.113161 ) ph/cm2/s
Energy fluence (15-150 keV)             : 3.41331e-08 ( -9.55771e-09  9.90023e-09 ) ergs/cm2
Cutoff power-law model
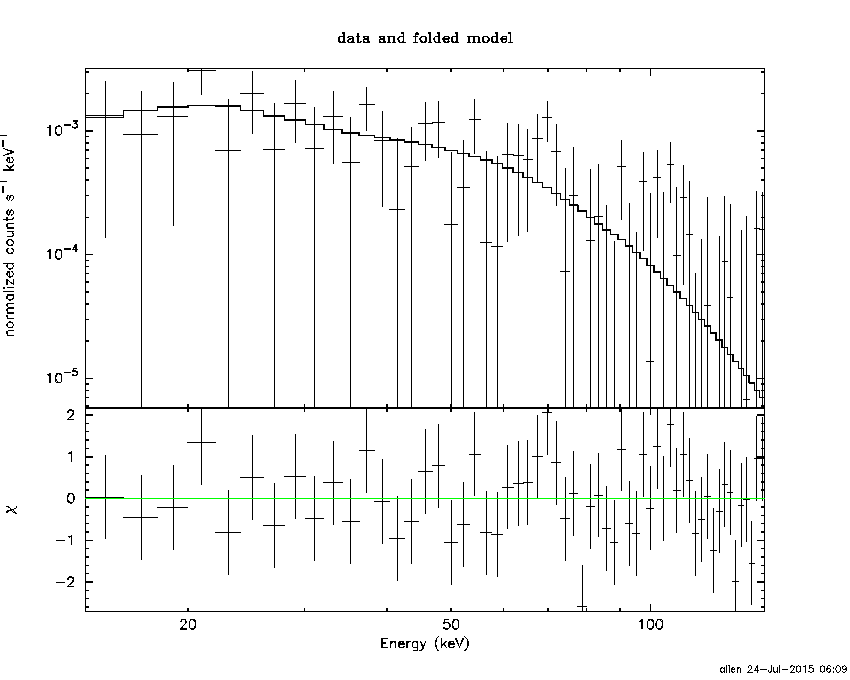
Time interval is from   90.184 sec. to   91.184 sec.
Spectral model in the cutoff power-law:
------------------------------------------------------------
Parameters  : value       lower 90%   higher 90%
Photon index: 0.268648     ( -2.57924   1.48401 )
Epeak [keV] : 62.1642      ( -18.1381 -62.1642 )
Norm@50keV  : 1.78182E-02    ( -0.0178182   0.410401 )
------------------------------------------------------------
#Fit statistic : Chi-Squared =          47.44 using 59 PHA bins.
# Reduced chi-squared =         0.8472 for     56 degrees of freedom
# Null hypothesis probability =   7.852857e-01

Photon flux (15-150 keV)    in 1 sec: 0.441265 ( -0.115555  0.115792 ) ph/cm2/s
Energy fluence (15-150 keV)             : 3.08126e-08 ( -9.612e-09  1.07489e-08 ) ergs/cm2
Band function
Time interval is from   90.184 sec. to   91.184 sec.

Spectral model in the Band function:
------------------------------------------------------------
Parameters  : value       lower 90%   higher 90%
alpha       : -0.357243   ( -1.25439   4.00337 )
beta        : -9.37159    ( 9.37167   19.3717 )
Epeak [keV] : 64.3688      ( -22.8186 229.931 )
Norm@50keV   : 1.57248E-02    ( -0.0157396   111.071 )
------------------------------------------------------------
#Fit statistic : Chi-Squared =          47.45 using 59 PHA bins.
# Reduced chi-squared =         0.8628 for     55 degrees of freedom
# Null hypothesis probability =   7.552840e-01

Photon flux (15-150 keV)    in 1 sec: 0.443672 (    ) ph/cm2/s
Energy fluence (15-150 keV)             : 0 ( 0  0 ) ergs/cm2
Single BB
Spectral model blackbody:
------------------------------------------------------------
Parameters  : value    Lower 90%  Upper 90%
kT [keV]    : 13.5116  (-3.30989  4.58616)
R^2/D10^2   : 7.79793E-02  (-0.0505196   0.133901)
(R is the radius in km and D10 is the distance to the source in units of 10 kpc)
------------------------------------------------------------
#Fit statistic : Chi-Squared =          48.97 using 59 PHA bins.
# Reduced chi-squared =         0.8591 for     57 degrees of freedom
# Null hypothesis probability =   7.664924e-01

Energy  Fluence     90% Error
[keV]   [erg/cm2]   [erg/cm2]
15- 25  3.015e-09   1.512e-09
25- 50  1.082e-08   5.022e-09
50-150  1.276e-08   6.978e-09
15-150  2.660e-08   1.571e-08
Thermal bremsstrahlung (OTTB)
Spectral model: thermal bremsstrahlung
------------------------------------------------------------
Parameters  : value         Lower 90%    Upper 90%
kT [keV]    : 165.249       (-101.155      -165.418)
Norm        : 1.89752       (-0.47781     0.622143)
------------------------------------------------------------
#Fit statistic : Chi-Squared =          48.35 using 59 PHA bins.
# Reduced chi-squared =         0.8482 for     57 degrees of freedom
# Null hypothesis probability =   7.858841e-01

Energy  Fluence     90% Error
[keV]   [erg/cm2]   [erg/cm2]
15- 25  4.830e-09   2.840e-09
25- 50  9.074e-09   5.260e-09
50-150  1.862e-08   1.134e-08
15-150  3.252e-08   1.953e-08
Double BB

Spectral model: bbodyrad<1> + bbodyrad<2>
------------------------------------------------------------
Parameters  : value         Lower 90%    Upper 90%
kT1 [keV]   : 6.40847        (-6.40604      -6.40604)
R1^2/D10^2  : 0.479958        (-0.480462      -0.480462)
kT2 [keV]   : 18.3418        (-18.3394      -18.3394)
R2^2/D10^2  : 2.09642E-02    (-0.0209776   0.123712)
------------------------------------------------------------
#Fit statistic : Chi-Squared =          47.30 using 59 PHA bins.
# Reduced chi-squared =         0.8601 for     55 degrees of freedom
# Null hypothesis probability =   7.601204e-01

Energy  Fluence     90% Error
[keV]   [erg/cm2]   [erg/cm2]
15- 25  4.265e-09   2.460e-09
25- 50  9.864e-09   5.230e-09
50-150  1.654e-08   1.043e-08
15-150  3.067e-08   1.590e-08
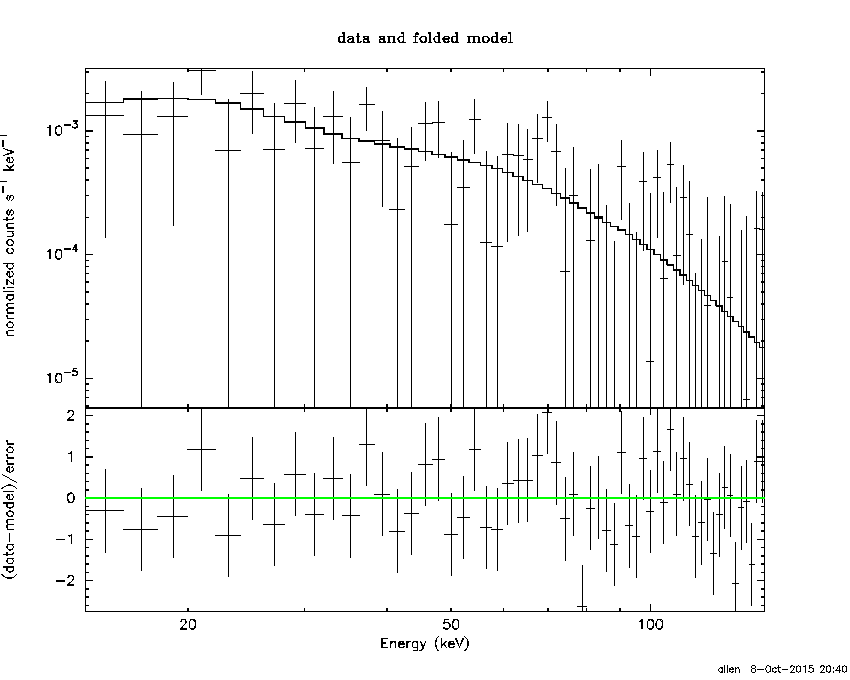
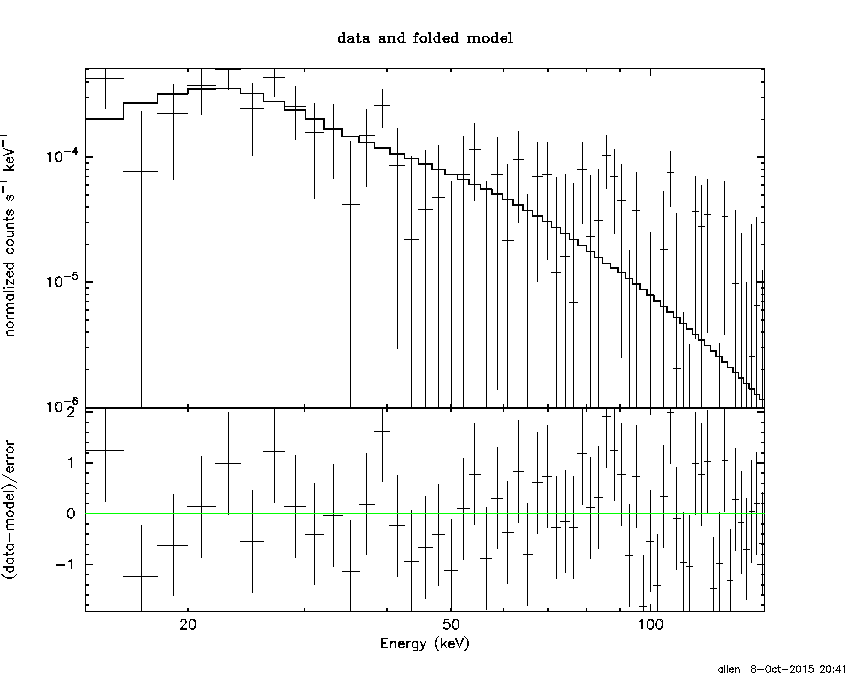
Pre-slew spectrum (Pre-slew PHA with pre-slew DRM)
Power-law model
Spectral model in power-law:
------------------------------------------------------------
Parameters  : value       lower 90%   higher 90%
Photon index: 1.93637     ( -0.386434   0.432576 )
Norm@50keV  : 4.97516E-04    ( -0.000144961   0.000139491 )
------------------------------------------------------------
#Fit statistic : Chi-Squared =          50.08 using 59 PHA bins.
# Reduced chi-squared =         0.8786 for     57 degrees of freedom
# Null hypothesis probability =   7.301234e-01

Photon flux (15-150 keV)    in 52.29 sec: 7.25267E-02 ( -0.0159905  0.0159921 ) ph/cm2/s
Energy fluence (15-150 keV)             : 2.39323e-07 ( -6.48417e-08  6.85182e-08 ) ergs/cm2
Cutoff power-law model
Spectral model in the cutoff power-law:
------------------------------------------------------------
Parameters  : value       lower 90%   higher 90%
Photon index: 1.05779     ( -4.03745   1.0876 )
Epeak [keV] : 41.4961      (   )
Norm@50keV  : 1.70820E-03    (     )
------------------------------------------------------------
#Fit statistic : Chi-Squared =          49.23 using 59 PHA bins.
# Reduced chi-squared =         0.8791 for     56 degrees of freedom
# Null hypothesis probability =   7.269745e-01

Photon flux (15-150 keV)    in 52.29 sec: 7.06743E-02 ( -0.0162163  0.0162954 ) ph/cm2/s
Energy fluence (15-150 keV)             : 2.15456e-07 ( -7.32363e-08  8.0456e-08 ) ergs/cm2
Band function
Spectral model in the Band function:
------------------------------------------------------------
Parameters  : value       lower 90%   higher 90%
alpha       : 4.98733   ( -14.8589   -4.98733 )
beta        : -2.50936    ( -1.50334   0.650654 )
Epeak [keV] : 27.4363      ( -7.41354 5.69434 )
Norm@50keV   : 46.8053    ( -10.0472   361.094 )
------------------------------------------------------------
#Fit statistic : Chi-Squared =          47.07 using 59 PHA bins.
# Reduced chi-squared =         0.8558 for     55 degrees of freedom
# Null hypothesis probability =   7.677487e-01

Photon flux (15-150 keV)    in 52.29 sec: 7.12705E-02 (    ) ph/cm2/s
Energy fluence (15-150 keV)             : 2.17512e-07 ( 0  0 ) ergs/cm2
S(25-50 keV) vs. S(50-100 keV) plot
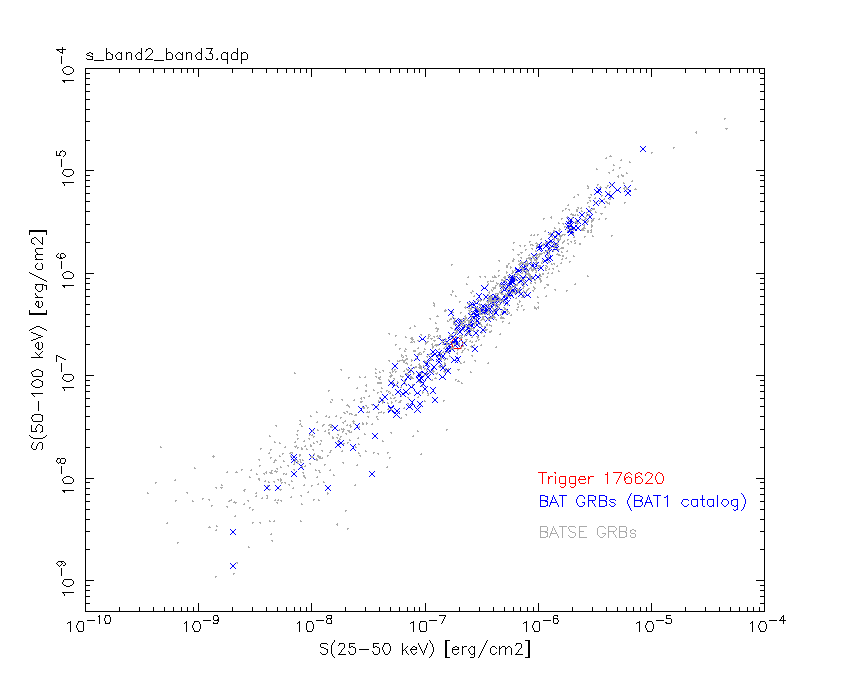
S(25-50 keV)  = 1.92e-07
S(50-100 keV) = 2.07e-07
T90 vs. Hardness ratio plot
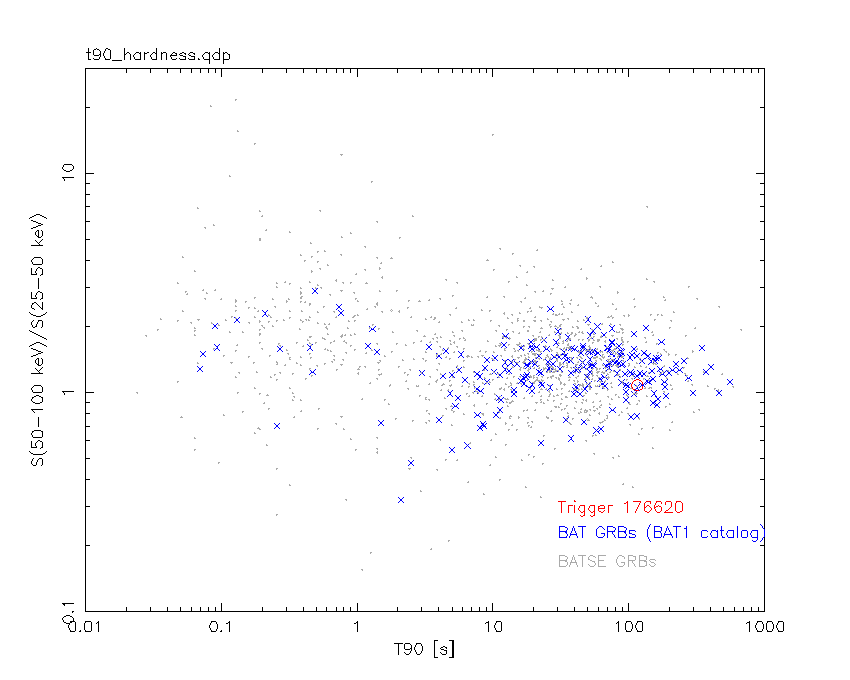
T90                                   = 115.592000007629 sec.
Hardness ratio (energy fluence ratio) = 1.07812
Color vs. Color plot
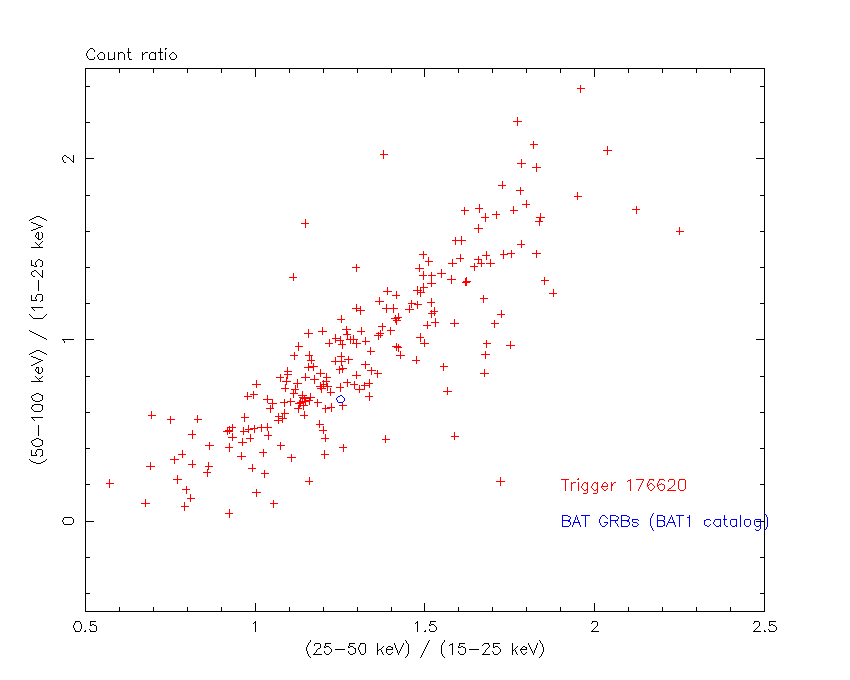
Count Ratio  (25-50 keV) / (15-25 keV) = 1.25162
Count Ratio (50-100 keV) / (15-25 keV) = 0.672952
Mask shadow pattern
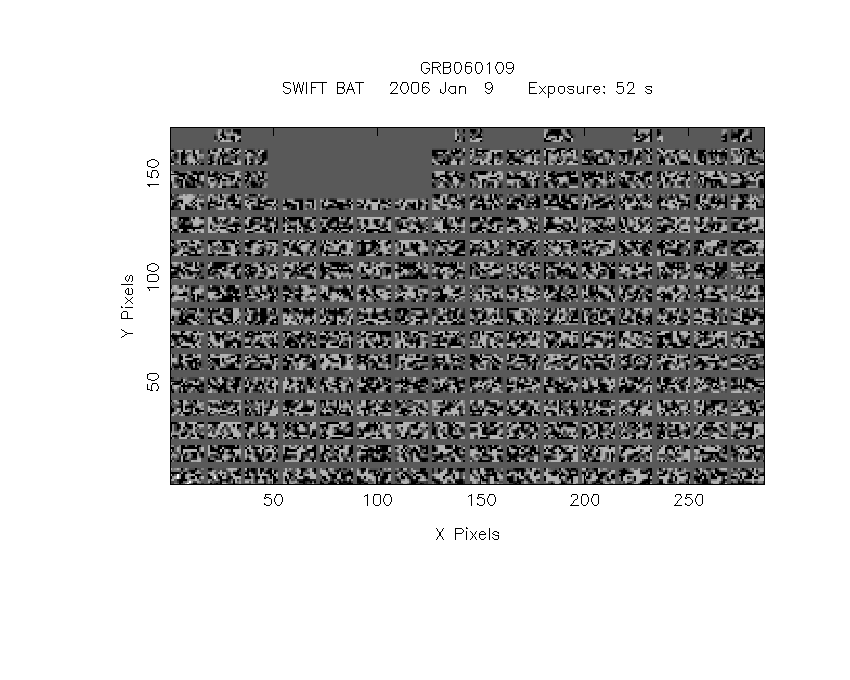
IMX = 0.236553484601, IMY = 0.230361441268
TIME vs. PHA plot around the trigger time
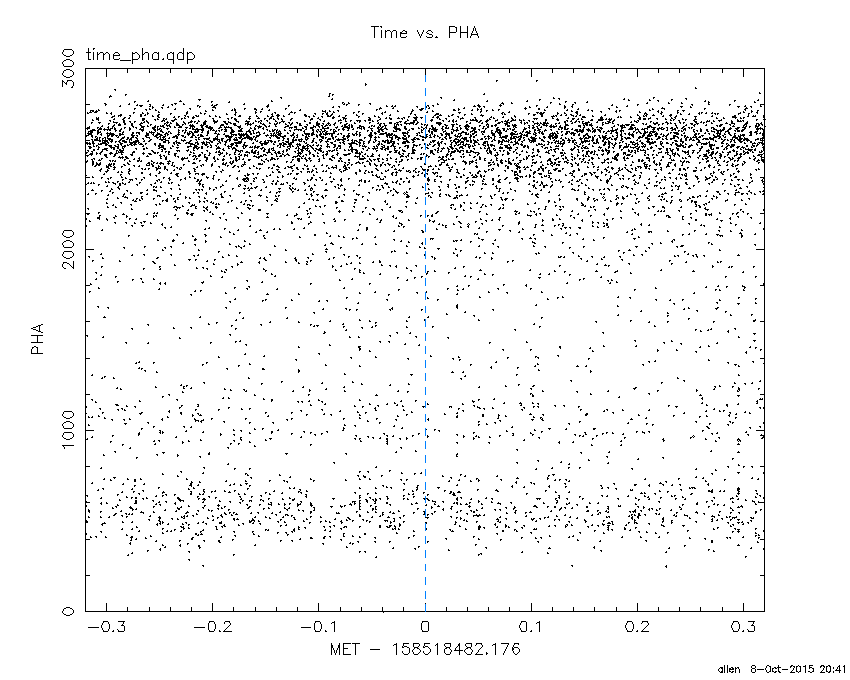
Blue+Cyan dotted lines: Time interval of the scaled map
From 0.000000 to 8.192000
TIME vs. DetID plot around the trigger time
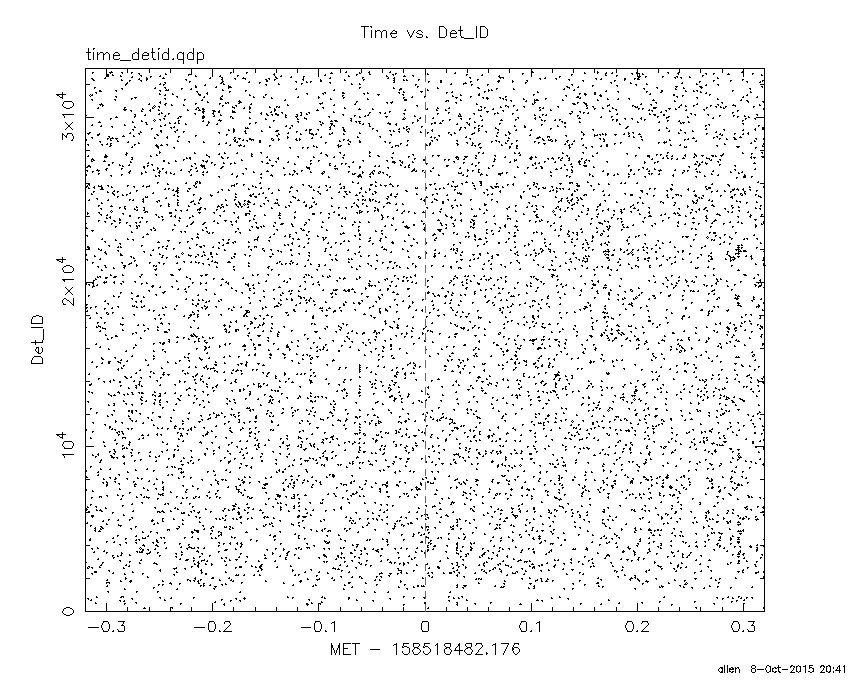
Blue+Cyan dotted lines: Time interval of the scaled map
From 0.000000 to 8.192000
100 us light curve (15-350 keV)
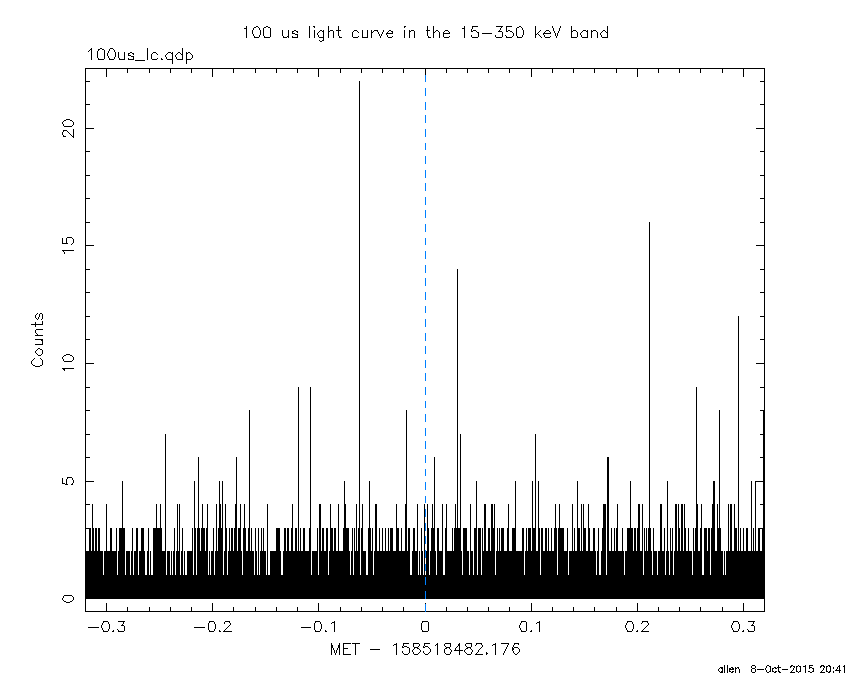
Blue+Cyan dotted lines: Time interval of the scaled map
From 0.000000 to 8.192000
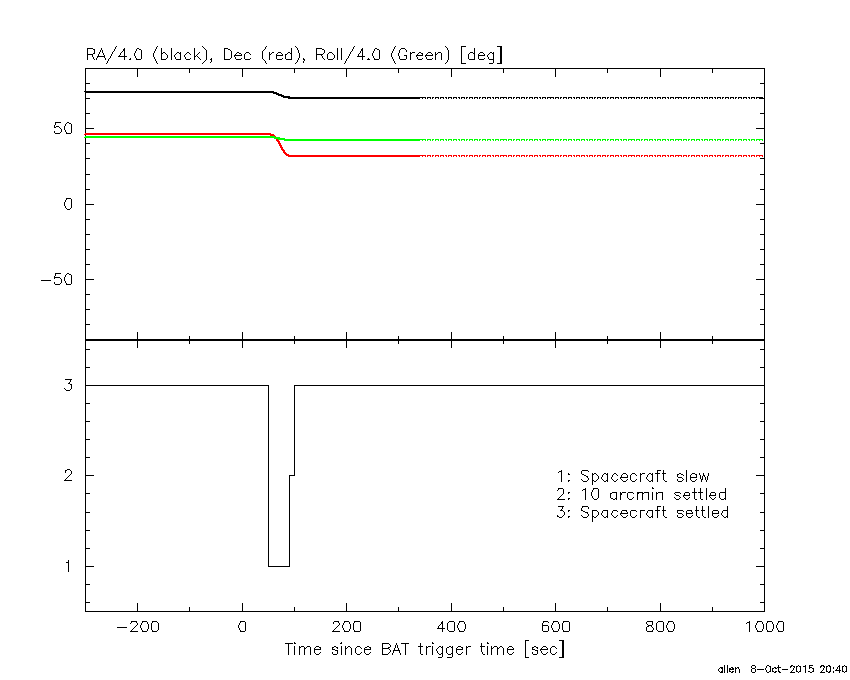
Spacecraft aspect plot
Bright source in the pre-burst/pre-slew/post-slew images
Pre-burst image of 15-350 keV band
Time interval of the image:
-299.176000 -1.968000

# RAcent  DECcent POSerr Theta    Phi  PeakCts   SNR AngSep     Name
#  [deg]    [deg]    ['] [deg]  [deg]                   [']
254.3190  35.4066    5.0  33.9   -0.9   0.6028   2.3    7.8	Her X-1
288.8076  10.9863    2.2  36.1  -73.3   2.7361   5.2    2.5	GRS 1915+105
299.5946  35.1969    0.2  11.2  -96.8  12.1903  61.3    0.4	Cyg X-1
308.1361  40.9574    1.1   9.4 -146.8   2.2466  10.1    1.2	Cyg X-3
326.0702  38.2469    5.8  22.5 -167.1   0.4380   2.0    6.6	Cyg X-2
245.1290  27.8874    2.4  44.7   -3.3   1.8280   4.8 ------	UNKNOWN
322.7690  31.8934    2.7  24.2 -150.2   0.8818   4.3 ------	UNKNOWN
Pre-slew background subtracted image of 15-350 keV band
Time interval of the image:
-1.968000 50.324600

# RAcent  DECcent POSerr Theta    Phi  PeakCts   SNR AngSep     Name
#  [deg]    [deg]    ['] [deg]  [deg]                   [']
254.3714  35.1700    8.0  34.0   -1.3  -0.1388  -1.4   11.2	Her X-1
288.7794  10.9640  217.5  36.1  -73.2  -0.0081  -0.1    1.6	GRS 1915+105
299.6132  35.2059   13.5  11.2  -96.8   0.0570   0.9    1.1	Cyg X-1
307.9142  40.9739    5.4   9.2 -146.3   0.1425   2.1    9.0	Cyg X-3
326.1592  38.2582    7.7  22.5 -167.2   0.1099   1.5    3.9	Cyg X-2
  3.1404  32.6733    2.5  51.0  173.1   0.8927   4.7 ------	UNKNOWN
282.7250  32.0169    1.8  18.2  -44.2   0.4560   6.3 ------	UNKNOWN
  0.5850  18.4030    2.5  58.4 -171.6   1.8084   4.7 ------	UNKNOWN
Post-slew image of 15-350 keV band
Time interval of the image:
89.724600 302.935500

# RAcent  DECcent POSerr Theta    Phi  PeakCts   SNR AngSep     Name
#  [deg]    [deg]    ['] [deg]  [deg]                   [']
254.3107  35.4136    5.9  23.8   25.4  -0.3286  -2.0    8.4	Her X-1
268.4111  -1.4264    6.3  36.1  -55.9   0.5278   1.8    3.0	SW J1753.5-0127
288.8187  10.9604    1.0  21.8  -97.0   2.1556  12.2    1.5	GRS 1915+105
299.5894  35.2006    0.2  14.4  171.9   9.0743  62.7    0.1	Cyg X-1
308.0797  40.9569    1.3  22.2  158.4   1.5242   8.8    1.4	Cyg X-3
326.1803  38.1885    6.2  35.8  167.0   0.4388   1.9    8.0	Cyg X-2
299.2917  70.8156    2.1  39.9  107.7   3.3849   5.6 ------	UNKNOWN
315.8876  -3.7829    2.0  47.7 -128.3   4.2203   5.9 ------	UNKNOWN
Plot creation:
Thu Oct  8 20:41:37 EDT 2015