Special notes of this burst
Image
Pre-slew 15.0-350.0 keV image (Event data)
#   RAcent    DECcent   POSerr    Theta     Phi              Peak Cts       SNR   Name
  276.1951    37.6025   0.0042    17.9957   -34.0834         1.7417863     46.281 TRIG_00176818

Foreground time interval of the image:
 -0.652  10.029 (delta_t =  10.681 [sec])
Background time interval of the image:
-299.072  -0.652 (delta_t = 298.420 [sec])
Lightcurves
Notes:
- 1) The mask-weighted light curves are using the flight position.
- 2) Multiple plots of different time binning/intervals are shown to cover all scenarios of short/long GRBs, rate/image triggers, and real/false positives.
- 3) For all the mask-weighted lightcurves, the y-axis units are counts/sec/det where a det is 0.4 x 0.4 = 0.16 sq cm.
- 4) The verticle lines correspond to following: green dotted lines are T50 interval, black dotted lines are T90 interval, blue solid line(s) is a spacecraft slew start time, and orange solid line(s) is a spacecraft slew end time.
- 5) Time of each bin is in the middle of the bin.
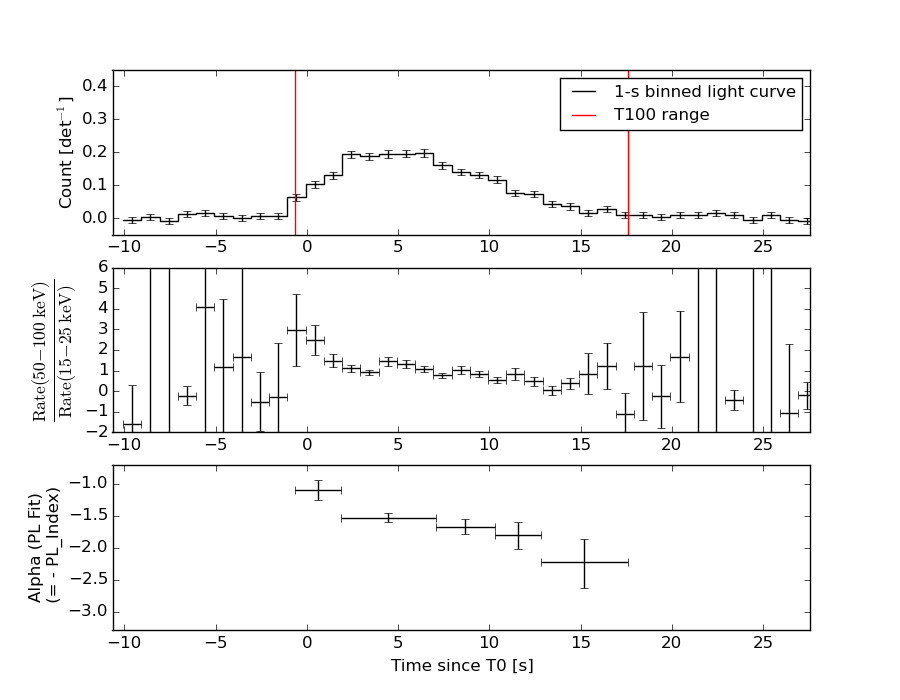
1 s binning
From T0-310 s to T0+310 s
From T100_start - 20 s to T100_end + 30 s
Full time interval

64 ms binning
Full time interval

From T100_start to T100_end
From T0-5 sec to T0+5 sec
16 ms binning
From T100_start-5 s to T100_start+5 s
Blue+Cyan dotted lines: Time interval of the scaled map
From 0.000000 to 0.512000
8 ms binning
From T100_start-3 s to T100_start+3 s

Blue+Cyan dotted lines: Time interval of the scaled map
From 0.000000 to 0.512000
2 ms binning
From T100_start-1 s to T100_start+1 s
Blue+Cyan dotted lines: Time interval of the scaled map
From 0.000000 to 0.512000
SN=5 or 10 sec. binning (whichever binning is satisfied first)
SN=5 or 10 sec. binning (T < 200 sec)
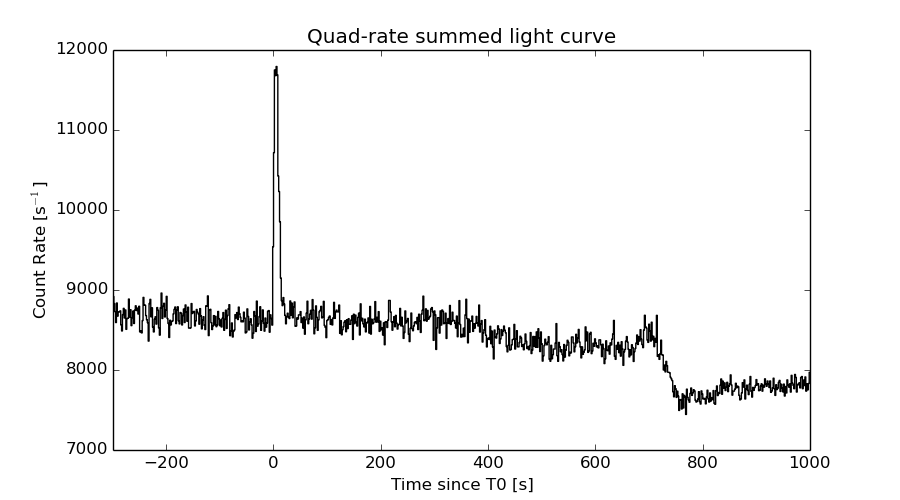
Quad-rate summed light curves (from T0-300s to T0+1000s)
Spectral Evolution
Spectra
Notes:
- 1) The fitting includes the systematic errors.
- 2) When the burst includes telescope slew time periods, the fitting uses an average response file made from multiple 5-s response files through out the slew time plus single time preiod for the non-slew times, and weighted by the total counts in the corresponding time period using addrmf. An average response file is needed becuase a spectral fit using the pre-slew DRM will introduce some errors in both a spectral shape and a normalization if the PHA file contains a lot of the slew/post-slew time interval.
- 3) For fits to more complicated models (e.g. a power-law over a cutoff power-law), the BAT team has decided to require a chi-square improvement of more than 6 for each extra dof.
Time averaged spectrum fit using the average DRM
Power-law model
Time interval is from   -0.652 sec. to   17.576 sec.

Spectral model in power-law:
------------------------------------------------------------
Parameters  : value       lower 90%   higher 90%
Photon index: 1.62126     ( -0.0643743   0.0647158 )
Norm@50keV  : 7.50084E-03    ( -0.000277474   0.000276868 )
------------------------------------------------------------
#Fit statistic : Chi-Squared =          63.41 using 59 PHA bins.
# Reduced chi-squared =          1.112 for     57 degrees of freedom
# Null hypothesis probability =   2.607037e-01

Photon flux (15-150 keV)    in 18.23 sec: 0.970352 ( -0.0362263  0.0362822 ) ph/cm2/s
Energy fluence (15-150 keV)             : 1.27563e-06 ( -5.02242e-08  5.0414e-08 ) ergs/cm2
Cutoff power-law model
Time interval is from   -0.652 sec. to   17.576 sec.
Spectral model in the cutoff power-law:
------------------------------------------------------------
Parameters  : value       lower 90%   higher 90%
Photon index: 0.881577     ( -0.30215   0.282746 )
Epeak [keV] : 73.8796      ( -9.11195 16.9346 )
Norm@50keV  : 1.78009E-02    ( -0.00491235   0.00738219 )
------------------------------------------------------------
#Fit statistic : Chi-Squared =          41.34 using 59 PHA bins.
# Reduced chi-squared =         0.7381 for     56 degrees of freedom
# Null hypothesis probability =   9.285129e-01

Photon flux (15-150 keV)    in 18.23 sec: 0.929336 ( -0.038973  0.039042 ) ph/cm2/s
Energy fluence (15-150 keV)             : 1.19737e-06 ( -5.76269e-08  5.79131e-08 ) ergs/cm2
Band function

Time interval is from   -0.652 sec. to   17.576 sec.

Spectral model in the Band function:
------------------------------------------------------------
Parameters  : value       lower 90%   higher 90%
alpha       : 1.11535   ( -2.49145   3.47311 )
beta        : -1.84522    ( 1.83818   0.113997 )
Epeak [keV] : 37.6002      ( -5.24208 32.2267 )
Norm@50keV   : 0.412293    ( -0.409881   127.572 )
------------------------------------------------------------
#Fit statistic : Chi-Squared =          38.92 using 59 PHA bins.
# Reduced chi-squared =         0.7076 for     55 degrees of freedom
# Null hypothesis probability =   9.504935e-01

Photon flux (15-150 keV)    in 18.23 sec: 0.928267 ( 6.07173  -0.038922 ) ph/cm2/s
Energy fluence (15-150 keV)             : 4.40401e-15 ( 0  0 ) ergs/cm2
Single BB

Spectral model blackbody:
------------------------------------------------------------
Parameters  : value    Lower 90%  Upper 90%
kT [keV]    : 13.9190  (  )
R^2/D10^2   : 0.138221  (   )
(R is the radius in km and D10 is the distance to the source in units of 10 kpc)
------------------------------------------------------------
#Fit statistic : Chi-Squared =         150.76 using 59 PHA bins.
# Reduced chi-squared =         2.6450 for     57 degrees of freedom
# Null hypothesis probability =   2.092630e-10

Energy  Fluence     90% Error
[keV]   [erg/cm2]   [erg/cm2]
15- 25  1.032e-07   6.645e-09
25- 50  3.815e-07   1.695e-08
50-150  4.852e-07   3.518e-08
15-150  9.699e-07   4.166e-08
Thermal bremsstrahlung (OTTB)

Spectral model: thermal bremsstrahlung
------------------------------------------------------------
Parameters  : value         Lower 90%    Upper 90%
kT [keV]    : 160.478       (-28.7209      32.5644)
Norm        : 3.97335       (-0.160454     0.193431)
------------------------------------------------------------
#Fit statistic : Chi-Squared =          46.49 using 59 PHA bins.
# Reduced chi-squared =         0.8156 for     57 degrees of freedom
# Null hypothesis probability =   8.385876e-01

Energy  Fluence     90% Error
[keV]   [erg/cm2]   [erg/cm2]
15- 25  1.849e-07   1.199e-08
25- 50  3.460e-07   2.570e-08
50-150  7.018e-07   1.814e-07
15-150  1.233e-06   2.082e-07
Double BB

Spectral model: bbodyrad<1> + bbodyrad<2>
------------------------------------------------------------
Parameters  : value         Lower 90%    Upper 90%
kT1 [keV]   : 7.25581        (-0.915932      1.00939)
R1^2/D10^2  : 0.852356        (-0.280539      0.466499)
kT2 [keV]   : 22.8226        (-2.65373      3.85184)
R2^2/D10^2  : 1.73439E-02    (-0.00797822   0.0112591)
------------------------------------------------------------
#Fit statistic : Chi-Squared =          36.21 using 59 PHA bins.
# Reduced chi-squared =         0.6583 for     55 degrees of freedom
# Null hypothesis probability =   9.763853e-01

Energy  Fluence     90% Error
[keV]   [erg/cm2]   [erg/cm2]
15- 25  1.662e-07   2.021e-08
25- 50  3.616e-07   3.883e-08
50-150  6.674e-07   1.185e-07
15-150  1.195e-06   1.612e-07
Peak spectrum fit
Power-law model
Time interval is from    4.312 sec. to    5.312 sec.

Spectral model in power-law:
------------------------------------------------------------
Parameters  : value       lower 90%   higher 90%
Photon index: 1.37543     ( -0.129848   0.130281 )
Norm@50keV  : 1.45642E-02    ( -0.00116344   0.00116075 )
------------------------------------------------------------
#Fit statistic : Chi-Squared =          53.85 using 59 PHA bins.
# Reduced chi-squared =         0.9446 for     57 degrees of freedom
# Null hypothesis probability =   5.941915e-01

Photon flux (15-150 keV)    in 1 sec: 1.76401 ( -0.140245  0.140344 ) ph/cm2/s
Energy fluence (15-150 keV)             : 1.41454e-07 ( -1.25641e-08  1.26615e-08 ) ergs/cm2
Cutoff power-law model

Time interval is from    4.312 sec. to    5.312 sec.
Spectral model in the cutoff power-law:
------------------------------------------------------------
Parameters  : value       lower 90%   higher 90%
Photon index: 0.522307     ( -0.661791   0.569944 )
Epeak [keV] : 86.0074      ( -18.9695 71.902 )
Norm@50keV  : 3.95963E-02    ( -0.0189837   0.04493 )
------------------------------------------------------------
#Fit statistic : Chi-Squared =          46.90 using 59 PHA bins.
# Reduced chi-squared =         0.8375 for     56 degrees of freedom
# Null hypothesis probability =   8.017045e-01

Photon flux (15-150 keV)    in 1 sec: 1.71017 ( -0.1452  0.14502 ) ph/cm2/s
Energy fluence (15-150 keV)             : 1.328e-07 ( -1.3921e-08  1.4012e-08 ) ergs/cm2
Band function

Time interval is from    4.312 sec. to    5.312 sec.

Spectral model in the Band function:
------------------------------------------------------------
Parameters  : value       lower 90%   higher 90%
alpha       : -0.211763   ( -0.809349   0.206543 )
beta        : -1.94063    ( 1.9388   0.499019 )
Epeak [keV] : 70.3460      ( -38.5539 66.3794 )
Norm@50keV   : 6.06933E-02    ( -0.0196426   133.971 )
------------------------------------------------------------
#Fit statistic : Chi-Squared =          46.27 using 59 PHA bins.
# Reduced chi-squared =         0.8412 for     55 degrees of freedom
# Null hypothesis probability =   7.930419e-01

Photon flux (15-150 keV)    in 1 sec: 1.70847 ( 5.29153  -0.14463 ) ph/cm2/s
Energy fluence (15-150 keV)             : 1.33731e-07 ( -1.33724e-07  -1.3821e-08 ) ergs/cm2
Single BB

Spectral model blackbody:
------------------------------------------------------------
Parameters  : value    Lower 90%  Upper 90%
kT [keV]    : 15.4894  (-1.39288  1.56517)
R^2/D10^2   : 0.189112  (-0.0537752   0.0731403)
(R is the radius in km and D10 is the distance to the source in units of 10 kpc)
------------------------------------------------------------
#Fit statistic : Chi-Squared =          65.29 using 59 PHA bins.
# Reduced chi-squared =          1.145 for     57 degrees of freedom
# Null hypothesis probability =   2.108647e-01

Energy  Fluence     90% Error
[keV]   [erg/cm2]   [erg/cm2]
15- 25  9.445e-09   1.304e-09
25- 50  3.863e-08   3.995e-09
50-150  6.396e-08   9.850e-09
15-150  1.120e-07   1.147e-08
Thermal bremsstrahlung (OTTB)

Spectral model: thermal bremsstrahlung
------------------------------------------------------------
Parameters  : value         Lower 90%    Upper 90%
kT [keV]    : 200.000       (      )
Norm        : 7.25012       (-0.573256     0.573259)
------------------------------------------------------------
#Fit statistic : Chi-Squared =          54.55 using 59 PHA bins.
# Reduced chi-squared =         0.9570 for     57 degrees of freedom
# Null hypothesis probability =   5.676339e-01

Energy  Fluence     90% Error
[keV]   [erg/cm2]   [erg/cm2]
15- 25  1.815e-08   1.680e-09
25- 50  3.491e-08   6.450e-09
50-150  7.656e-08   3.083e-08
15-150  1.296e-07   3.470e-08
Double BB

Spectral model: bbodyrad<1> + bbodyrad<2>
------------------------------------------------------------
Parameters  : value         Lower 90%    Upper 90%
kT1 [keV]   : 8.93606        (-3.09813      3.27847)
R1^2/D10^2  : 0.735815        (-0.396454      1.62394)
kT2 [keV]   : 27.4375        (-8.20815      40.3109)
R2^2/D10^2  : 1.83807E-02    (-0.0170282   0.0567465)
------------------------------------------------------------
#Fit statistic : Chi-Squared =          46.51 using 59 PHA bins.
# Reduced chi-squared =         0.8457 for     55 degrees of freedom
# Null hypothesis probability =   7.853986e-01

Energy  Fluence     90% Error
[keV]   [erg/cm2]   [erg/cm2]
15- 25  1.368e-08   5.377e-09
25- 50  3.750e-08   1.590e-08
50-150  8.314e-08   4.064e-08
15-150  1.343e-07   5.593e-08
Pre-slew spectrum (Pre-slew PHA with pre-slew DRM)
Power-law model
Spectral model in power-law:
------------------------------------------------------------
Parameters  : value       lower 90%   higher 90%
Photon index: 1.50835     ( -0.0615194   0.0617002 )
Norm@50keV  : 1.06784E-02    ( -0.000375699   0.000375362 )
------------------------------------------------------------
#Fit statistic : Chi-Squared =          69.11 using 59 PHA bins.
# Reduced chi-squared =          1.213 for     57 degrees of freedom
# Null hypothesis probability =   1.304224e-01

Photon flux (15-150 keV)    in 10.68 sec: 1.33610 ( -0.0484469  0.0485229 ) ph/cm2/s
Energy fluence (15-150 keV)             : 1.08043e-06 ( -4.10992e-08  4.12307e-08 ) ergs/cm2
Cutoff power-law model
Spectral model in the cutoff power-law:
------------------------------------------------------------
Parameters  : value       lower 90%   higher 90%
Photon index: 0.662359     ( -0.302042   0.283001 )
Epeak [keV] : 80.4228      ( -9.3003 16.0611 )
Norm@50keV  : 2.77705E-02    ( -0.00745354   0.0110318 )
------------------------------------------------------------
#Fit statistic : Chi-Squared =          39.78 using 59 PHA bins.
# Reduced chi-squared =         0.7103 for     56 degrees of freedom
# Null hypothesis probability =   9.502915e-01

Photon flux (15-150 keV)    in 10.68 sec: 1.27282 ( -0.05209  0.0522 ) ph/cm2/s
Energy fluence (15-150 keV)             : 1.01299e-06 ( -4.65552e-08  4.66951e-08 ) ergs/cm2
Band function

Spectral model in the Band function:
------------------------------------------------------------
Parameters  : value       lower 90%   higher 90%
alpha       : -0.579745   ( -0.339234   0.641756 )
beta        : -2.26999    ( 2.27404   0.44613 )
Epeak [keV] : 75.9793      ( -21.1901 18.3537 )
Norm@50keV   : 3.09434E-02    ( -0.0100392   0.0466471 )
------------------------------------------------------------
#Fit statistic : Chi-Squared =          39.26 using 59 PHA bins.
# Reduced chi-squared =         0.7139 for     55 degrees of freedom
# Null hypothesis probability =   9.461214e-01

Photon flux (15-150 keV)    in 10.68 sec: 1.27055 ( 5.72945  -0.05199 ) ph/cm2/s
Energy fluence (15-150 keV)             : 1.01381e-06 ( -1.01373e-06  -4.66161e-08 ) ergs/cm2
S(25-50 keV) vs. S(50-100 keV) plot

S(25-50 keV)  = 3.34e-07
S(50-100 keV) = 4.34e-07
T90 vs. Hardness ratio plot
T90                                   = 13.2120000123978 sec.
Hardness ratio (energy fluence ratio) = 1.2994
Color vs. Color plot
Count Ratio  (25-50 keV) / (15-25 keV) = 1.48538
Count Ratio (50-100 keV) / (15-25 keV) = 0.985722
Mask shadow pattern
IMX = 2.690370798467176E-01, IMY = 1.820379872454307E-01
TIME vs. PHA plot around the trigger time

Blue+Cyan dotted lines: Time interval of the scaled map
From 0.000000 to 0.512000
TIME vs. DetID plot around the trigger time

Blue+Cyan dotted lines: Time interval of the scaled map
From 0.000000 to 0.512000
100 us light curve (15-350 keV)

Blue+Cyan dotted lines: Time interval of the scaled map
From 0.000000 to 0.512000
Spacecraft aspect plot
Bright source in the pre-burst/pre-slew/post-slew images
Pre-burst image of 15-350 keV band
Time interval of the image:
-299.072000 -0.652000

# RAcent  DECcent POSerr Theta    Phi  PeakCts   SNR AngSep     Name
#  [deg]    [deg]    ['] [deg]  [deg]                   [']
254.3310  35.1879    0.0  34.0  -16.1  -0.3124  -1.2   11.2	Her X-1
288.8336  10.9480    1.8  36.2  -88.1   3.7315   6.5    2.1	GRS 1915+105
299.5871  35.1991    0.2  11.3 -111.5  13.9365  68.6    0.2	Cyg X-1
308.0550  40.8911    2.2   9.4 -160.9   1.0635   5.2    4.5	Cyg X-3
326.1285  38.4589    4.0  22.4  177.6   0.6274   2.9    8.5	Cyg X-2
317.3283  32.1986    2.5  20.8 -156.7   0.9655   4.6 ------	UNKNOWN
268.4826  11.9729    2.7  42.2  -57.7   2.8238   4.3 ------	UNKNOWN
324.7872   0.3522    2.8  51.9 -138.3   4.8418   4.1 ------	UNKNOWN
Pre-slew background subtracted image of 15-350 keV band
Time interval of the image:
-0.652000 10.028600

# RAcent  DECcent POSerr Theta    Phi  PeakCts   SNR AngSep     Name
#  [deg]    [deg]    ['] [deg]  [deg]                   [']
254.3898  35.1992   25.7  34.0  -16.1  -0.0205  -0.4    9.2	Her X-1
288.9143  10.8850   11.4  36.2  -88.3  -0.0891  -1.0    7.7	GRS 1915+105
299.7305  35.3277   16.2  11.2 -112.2   0.0267   0.7   10.2	Cyg X-1
308.1111  41.0295    3.7   9.3 -161.7   0.1152   3.1    4.6	Cyg X-3
326.2214  38.3440    6.3  22.6  177.8  -0.0740  -1.8    2.7	Cyg X-2
276.1951  37.6025    0.2  18.0  -34.1   1.7418  46.3 ------	UNKNOWN
242.8969  22.5658    2.2  49.7  -21.9   0.4308   5.2 ------	UNKNOWN
236.2190  15.9283    1.9  58.8  -22.4   1.4478   6.1 ------	UNKNOWN
Post-slew image of 15-350 keV band
Time interval of the image:
54.828600 302.991400

# RAcent  DECcent POSerr Theta    Phi  PeakCts   SNR AngSep     Name
#  [deg]    [deg]    ['] [deg]  [deg]                   [']
254.4621  35.3507   92.4  17.6   16.5  -0.0216  -0.1    0.5	Her X-1
268.2952  -1.3360    6.3  39.6  -60.3   0.8829   1.8    8.2	SW J1753.5-0127
288.7988  10.9677    1.0  28.9  -99.0   3.4256  12.1    1.3	GRS 1915+105
299.5860  35.1937    0.2  18.9 -162.5  11.2391  66.4    0.5	Cyg X-1
308.1127  40.9461    3.2  24.8  179.5   0.7006   3.7    0.4	Cyg X-3
325.9715  38.2417    7.6  38.8 -179.5  -0.4081  -1.5   10.6	Cyg X-2
251.2310  51.9083    2.7  22.6   64.5   0.9082   4.3 ------	UNKNOWN
249.3029  36.5424    2.2  21.4   22.7   0.9277   5.2 ------	UNKNOWN
334.2533  16.9821    2.5  54.6 -157.3   2.9918   4.6 ------	UNKNOWN
270.1099  -5.6797    2.4  43.7  -64.0   3.8503   4.7 ------	UNKNOWN
Plot creation:
Sun May 31 14:39:25 EDT 2015