Click here for the BAT GCN circular template
Image
Pre-slew 15.0-350.0 keV image (Event data)
#   RAcent    DECcent   POSerr    Theta     Phi              Peak Cts       SNR   Name
  327.9119   -59.9814   0.0033    50.1207  -159.0268        33.2103911     58.201 TRIG_00177666

Foreground time interval of the image:
 -1.972  26.288 (delta_t =  28.260 [sec])
Background time interval of the image:
-299.560  -1.972 (delta_t = 297.588 [sec])
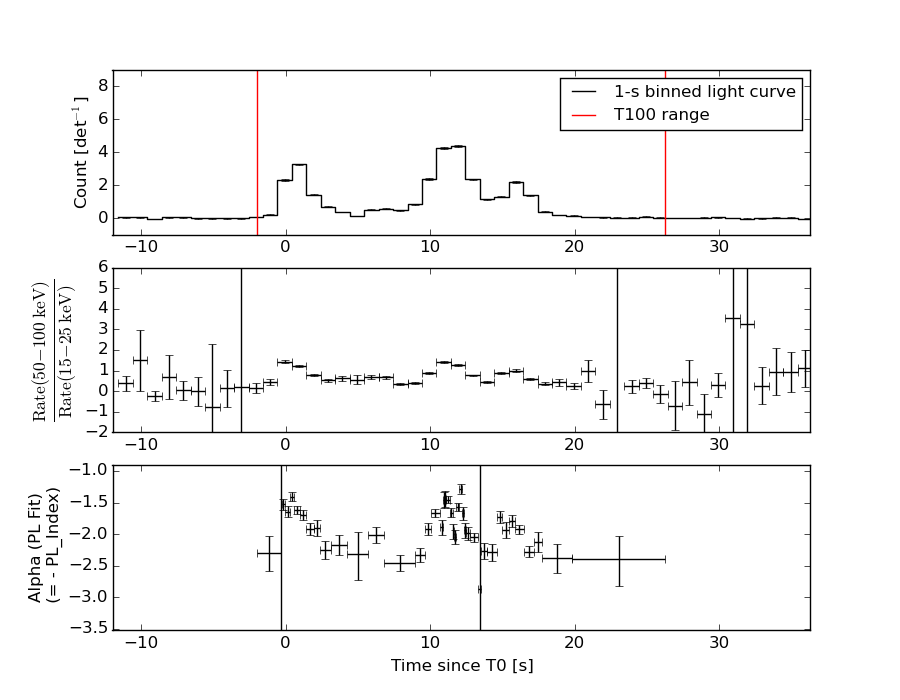
Lightcurves
Notes:
- 1) The mask-weighted light curves are using the flight position.
- 2) Multiple plots of different time binning/intervals are shown to cover all scenarios of short/long GRBs, rate/image triggers, and real/false positives.
- 3) For all the mask-weighted lightcurves, the y-axis units are counts/sec/det where a det is 0.4 x 0.4 = 0.16 sq cm.
- 4) The verticle lines correspond to following: green dotted lines are T50 interval, black dotted lines are T90 interval, blue solid line(s) is a spacecraft slew start time, and orange solid line(s) is a spacecraft slew end time.
- 5) Time of each bin is in the middle of the bin.
1 s binning
From T0-310 s to T0+310 s
From T100_start - 20 s to T100_end + 30 s
Full time interval
64 ms binning
Full time interval
From T100_start to T100_end
From T0-5 sec to T0+5 sec

16 ms binning
From T100_start-5 s to T100_start+5 s
Blue+Cyan dotted lines: Time interval of the scaled map
From 0.000000 to 1.024000
8 ms binning
From T100_start-3 s to T100_start+3 s
Blue+Cyan dotted lines: Time interval of the scaled map
From 0.000000 to 1.024000
2 ms binning
From T100_start-1 s to T100_start+1 s
Blue+Cyan dotted lines: Time interval of the scaled map
From 0.000000 to 1.024000
SN=5 or 10 sec. binning (whichever binning is satisfied first)
SN=5 or 10 sec. binning (T < 200 sec)
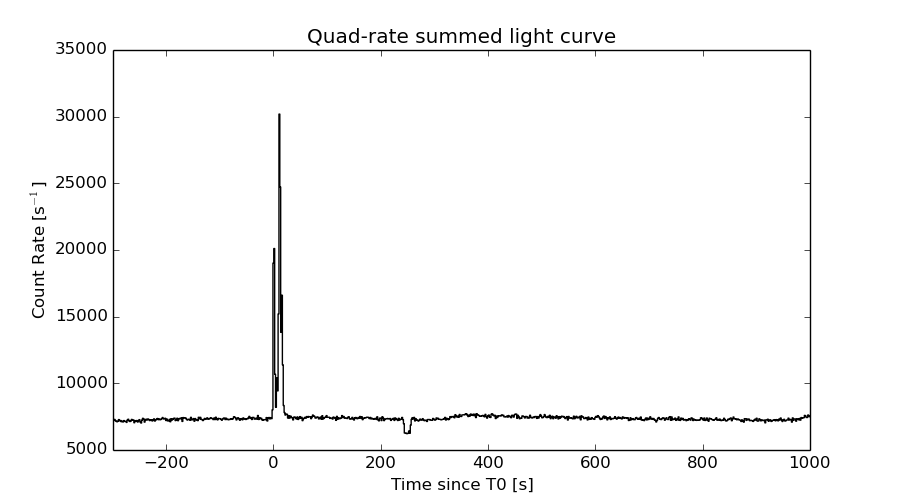
Quad-rate summed light curves (from T0-300s to T0+1000s)
Spectral Evolution
Spectra
Notes:
- 1) The fitting includes the systematic errors.
- 2) When the burst includes telescope slew time periods, the fitting uses an average response file made from multiple 5-s response files through out the slew time plus single time preiod for the non-slew times, and weighted by the total counts in the corresponding time period using addrmf. An average response file is needed becuase a spectral fit using the pre-slew DRM will introduce some errors in both a spectral shape and a normalization if the PHA file contains a lot of the slew/post-slew time interval.
- 3) For fits to more complicated models (e.g. a power-law over a cutoff power-law), the BAT team has decided to require a chi-square improvement of more than 6 for each extra dof.
Time averaged spectrum fit using the average DRM
Power-law model
Time interval is from   -1.972 sec. to   26.288 sec.

Spectral model in power-law:
------------------------------------------------------------
Parameters  : value       lower 90%   higher 90%
Photon index: 1.88299     ( -0.027773   0.0277571 )
Norm@50keV  : 8.06479E-02    ( -0.00122792   0.00122749 )
------------------------------------------------------------
#Fit statistic : Chi-Squared =          73.17 using 59 PHA bins.
# Reduced chi-squared =          1.284 for     57 degrees of freedom
# Null hypothesis probability =   7.324733e-02

Photon flux (15-150 keV)    in 28.26 sec: 11.4912 ( -0.235318  0.236586 ) ph/cm2/s
Energy fluence (15-150 keV)             : 2.09517e-05 ( -3.18993e-07  3.19081e-07 ) ergs/cm2
Cutoff power-law model

Time interval is from   -1.972 sec. to   26.288 sec.
Spectral model in the cutoff power-law:
------------------------------------------------------------
Parameters  : value       lower 90%   higher 90%
Photon index: 1.51305     ( -0.119999   0.117245 )
Epeak [keV] : 78.2411      ( -6.43716 10.3062 )
Norm@50keV  : 0.115634    ( -0.0122   0.0139569 )
------------------------------------------------------------
#Fit statistic : Chi-Squared =          42.94 using 59 PHA bins.
# Reduced chi-squared =         0.7668 for     56 degrees of freedom
# Null hypothesis probability =   8.999545e-01

Photon flux (15-150 keV)    in 28.26 sec: 11.0118 ( -0.2691  0.2718 ) ph/cm2/s
Energy fluence (15-150 keV)             : 2.05409e-05 ( -3.42483e-07  3.42652e-07 ) ergs/cm2
Band function

Time interval is from   -1.972 sec. to   26.288 sec.

Spectral model in the Band function:
------------------------------------------------------------
Parameters  : value       lower 90%   higher 90%
alpha       : -1.51302   ( -0.0886243   0.162907 )
beta        : -10.0000    ( 10   1.08358e-13 )
Epeak [keV] : 78.2259      ( -5.81355 10.3083 )
Norm@50keV   : 0.115616    ( -0.0122005   0.0139602 )
------------------------------------------------------------
#Fit statistic : Chi-Squared =          42.94 using 59 PHA bins.
# Reduced chi-squared =         0.7807 for     55 degrees of freedom
# Null hypothesis probability =   8.813607e-01

Photon flux (15-150 keV)    in 28.26 sec: 10.7466 ( -3.7466  -0.3399 ) ph/cm2/s
Energy fluence (15-150 keV)             : 2.0324e-05 ( -2.03238e-05  -3.62321e-07 ) ergs/cm2
Single BB

Spectral model blackbody:
------------------------------------------------------------
Parameters  : value    Lower 90%  Upper 90%
kT [keV]    : 16.1062  (  )
R^2/D10^2   : 0.837256  (   )
(R is the radius in km and D10 is the distance to the source in units of 10 kpc)
------------------------------------------------------------
#Fit statistic : Chi-Squared =        1045.80 using 59 PHA bins.
# Reduced chi-squared =        18.3474 for     57 degrees of freedom
# Null hypothesis probability =  8.471951e-182

Energy  Fluence     90% Error
[keV]   [erg/cm2]   [erg/cm2]
15- 25  1.267e-06   4.069e-08
25- 50  5.362e-06   1.243e-07
50-150  9.747e-06   2.148e-07
15-150  1.638e-05   2.769e-07
Thermal bremsstrahlung (OTTB)

Spectral model: thermal bremsstrahlung
------------------------------------------------------------
Parameters  : value         Lower 90%    Upper 90%
kT [keV]    : 113.270       (      )
Norm        : 47.0776       (     )
------------------------------------------------------------
#Fit statistic : Chi-Squared =          51.15 using 59 PHA bins.
# Reduced chi-squared =         0.8974 for     57 degrees of freedom
# Null hypothesis probability =   6.931763e-01

Energy  Fluence     90% Error
[keV]   [erg/cm2]   [erg/cm2]
15- 25  3.366e-06   1.540e-07
25- 50  6.021e-06   2.063e-07
50-150  1.074e-05   2.011e-06
15-150  2.013e-05   2.128e-06
Double BB

Spectral model: bbodyrad<1> + bbodyrad<2>
------------------------------------------------------------
Parameters  : value         Lower 90%    Upper 90%
kT1 [keV]   : 7.99653        (-0.393392      0.403048)
R1^2/D10^2  : 8.06185        (-1.30391      1.63367)
kT2 [keV]   : 26.8582        (-1.32642      1.52194)
R2^2/D10^2  : 8.95159E-02    (-0.0178692   0.0206914)
------------------------------------------------------------
#Fit statistic : Chi-Squared =          50.00 using 59 PHA bins.
# Reduced chi-squared =         0.9091 for     55 degrees of freedom
# Null hypothesis probability =   6.655153e-01

Energy  Fluence     90% Error
[keV]   [erg/cm2]   [erg/cm2]
15- 25  2.938e-06   1.622e-07
25- 50  6.397e-06   1.681e-07
50-150  1.066e-05   2.840e-07
15-150  1.999e-05   4.493e-07
Peak spectrum fit
Power-law model
Time interval is from   11.144 sec. to   12.144 sec.

Spectral model in power-law:
------------------------------------------------------------
Parameters  : value       lower 90%   higher 90%
Photon index: 1.56045     ( -0.0391882   0.0392647 )
Norm@50keV  : 0.398031    ( -0.00919793   0.00919712 )
------------------------------------------------------------
#Fit statistic : Chi-Squared =          98.94 using 59 PHA bins.
# Reduced chi-squared =          1.736 for     57 degrees of freedom
# Null hypothesis probability =   4.824482e-04

Photon flux (15-150 keV)    in 1 sec: 50.5421 ( -1.33299  1.33674 ) ph/cm2/s
Energy fluence (15-150 keV)             : 3.74162e-06 ( -8.76427e-08  8.76619e-08 ) ergs/cm2
Cutoff power-law model

Time interval is from   11.144 sec. to   12.144 sec.
Spectral model in the cutoff power-law:
------------------------------------------------------------
Parameters  : value       lower 90%   higher 90%
Photon index: 0.936926     ( -0.176417   0.170521 )
Epeak [keV] : 100.914      ( -10.2439 16.3676 )
Norm@50keV  : 0.740831    ( -0.11301   0.138092 )
------------------------------------------------------------
#Fit statistic : Chi-Squared =          56.74 using 59 PHA bins.
# Reduced chi-squared =          1.013 for     56 degrees of freedom
# Null hypothesis probability =   4.472638e-01

Photon flux (15-150 keV)    in 1 sec: 48.4828 ( -1.4053  1.4138 ) ph/cm2/s
Energy fluence (15-150 keV)             : 3.68137e-06 ( 0  0 ) ergs/cm2
Band function
Time interval is from   11.144 sec. to   12.144 sec.

Spectral model in the Band function:
------------------------------------------------------------
Parameters  : value       lower 90%   higher 90%
alpha       : -0.936882   ( -0.144407   0.208498 )
beta        : -10.0000    ( 10   20 )
Epeak [keV] : 100.895      ( -9.07658 12.2741 )
Norm@50keV   : 0.740812    ( -0.11306   0.138084 )
------------------------------------------------------------
#Fit statistic : Chi-Squared =          56.74 using 59 PHA bins.
# Reduced chi-squared =          1.032 for     55 degrees of freedom
# Null hypothesis probability =   4.099462e-01

Photon flux (15-150 keV)    in 1 sec:  (    ) ph/cm2/s
Energy fluence (15-150 keV)             : 0 ( 0  0 ) ergs/cm2
Single BB

Spectral model blackbody:
------------------------------------------------------------
Parameters  : value    Lower 90%  Upper 90%
kT [keV]    : 17.6345  (  )
R^2/D10^2   : 3.23829  (   )
(R is the radius in km and D10 is the distance to the source in units of 10 kpc)
------------------------------------------------------------
#Fit statistic : Chi-Squared =         384.67 using 59 PHA bins.
# Reduced chi-squared =         6.7485 for     57 degrees of freedom
# Null hypothesis probability =   3.892788e-50

Energy  Fluence     90% Error
[keV]   [erg/cm2]   [erg/cm2]
15- 25  2.029e-07   9.850e-09
25- 50  9.240e-07   2.915e-08
50-150  2.074e-06   7.350e-08
15-150  3.201e-06   8.000e-08
Thermal bremsstrahlung (OTTB)

Spectral model: thermal bremsstrahlung
------------------------------------------------------------
Parameters  : value         Lower 90%    Upper 90%
kT [keV]    : 200.000       (      )
Norm        : 207.171       (-4.76558     4.76551)
------------------------------------------------------------
#Fit statistic : Chi-Squared =          69.71 using 59 PHA bins.
# Reduced chi-squared =          1.223 for     57 degrees of freedom
# Null hypothesis probability =   1.203740e-01

Energy  Fluence     90% Error
[keV]   [erg/cm2]   [erg/cm2]
15- 25  5.161e-07   1.330e-08
25- 50  9.927e-07   2.835e-08
50-150  2.177e-06   6.200e-08
15-150  3.686e-06   1.020e-07
Double BB

Spectral model: bbodyrad<1> + bbodyrad<2>
------------------------------------------------------------
Parameters  : value         Lower 90%    Upper 90%
kT1 [keV]   : 7.99077        (-0.75256      0.790886)
R1^2/D10^2  : 29.3241        (-7.67539      11.6183)
kT2 [keV]   : 26.5222        (-1.73944      2.13266)
R2^2/D10^2  : 0.591066    (-0.158022   0.186967)
------------------------------------------------------------
#Fit statistic : Chi-Squared =          58.62 using 59 PHA bins.
# Reduced chi-squared =          1.066 for     55 degrees of freedom
# Null hypothesis probability =   3.440756e-01

Energy  Fluence     90% Error
[keV]   [erg/cm2]   [erg/cm2]
15- 25  4.082e-07   3.415e-08
25- 50  9.994e-07   5.180e-08
50-150  2.262e-06   1.015e-07
15-150  3.670e-06   1.560e-07
Pre-slew spectrum (Pre-slew PHA with pre-slew DRM)
Power-law model

Spectral model in power-law:
------------------------------------------------------------
Parameters  : value       lower 90%   higher 90%
Photon index: 1.88299     ( -0.027773   0.0277571 )
Norm@50keV  : 8.06479E-02    ( -0.00122792   0.00122749 )
------------------------------------------------------------
#Fit statistic : Chi-Squared =          73.17 using 59 PHA bins.
# Reduced chi-squared =          1.284 for     57 degrees of freedom
# Null hypothesis probability =   7.324733e-02

Photon flux (15-150 keV)    in 28.26 sec: 11.4912 ( -0.235318  0.236586 ) ph/cm2/s
Energy fluence (15-150 keV)             : 2.09517e-05 ( -3.18993e-07  3.19081e-07 ) ergs/cm2
Cutoff power-law model

Spectral model in the cutoff power-law:
------------------------------------------------------------
Parameters  : value       lower 90%   higher 90%
Photon index: 1.51305     ( -0.119999   0.117245 )
Epeak [keV] : 78.2411      ( -6.43716 10.3062 )
Norm@50keV  : 0.115634    ( -0.0122   0.0139569 )
------------------------------------------------------------
#Fit statistic : Chi-Squared =          42.94 using 59 PHA bins.
# Reduced chi-squared =         0.7668 for     56 degrees of freedom
# Null hypothesis probability =   8.999545e-01

Photon flux (15-150 keV)    in 28.26 sec: 11.0118 ( -0.2691  0.2718 ) ph/cm2/s
Energy fluence (15-150 keV)             : 2.05409e-05 ( -3.42483e-07  3.42652e-07 ) ergs/cm2
Band function
Spectral model in the Band function:
------------------------------------------------------------
Parameters  : value       lower 90%   higher 90%
alpha       : -1.51302   ( -0.0886243   0.162907 )
beta        : -10.0000    ( 10   0 )
Epeak [keV] : 78.2259      ( -5.81355 10.3083 )
Norm@50keV   : 0.115616    ( -0.0122005   0.0139602 )
------------------------------------------------------------
#Fit statistic : Chi-Squared =          42.94 using 59 PHA bins.
# Reduced chi-squared =         0.7807 for     55 degrees of freedom
# Null hypothesis probability =   8.813607e-01

Photon flux (15-150 keV)    in 28.26 sec: 10.7466 ( -3.7466  -0.3399 ) ph/cm2/s
Energy fluence (15-150 keV)             : 2.0324e-05 ( -2.03238e-05  -3.62548e-07 ) ergs/cm2
S(25-50 keV) vs. S(50-100 keV) plot
S(25-50 keV)  = 6.08e-06
S(50-100 keV) = 6.59e-06
T90 vs. Hardness ratio plot
T90                                   = 16.8519999980927 sec.
Hardness ratio (energy fluence ratio) = 1.08388
Color vs. Color plot
Count Ratio  (25-50 keV) / (15-25 keV) = 1.38729
Count Ratio (50-100 keV) / (15-25 keV) = 0.926086
Mask shadow pattern
IMX = -1.117570735384882E+00, IMY = 4.283949195744891E-01
TIME vs. PHA plot around the trigger time
Blue+Cyan dotted lines: Time interval of the scaled map
From 0.000000 to 1.024000
TIME vs. DetID plot around the trigger time
Blue+Cyan dotted lines: Time interval of the scaled map
From 0.000000 to 1.024000
100 us light curve (15-350 keV)
Blue+Cyan dotted lines: Time interval of the scaled map
From 0.000000 to 1.024000
Spacecraft aspect plot
Bright source in the pre-burst/pre-slew/post-slew images
Pre-burst image of 15-350 keV band
Time interval of the image:
-299.560000 -1.972000

# RAcent  DECcent POSerr Theta    Phi  PeakCts   SNR AngSep     Name
#  [deg]    [deg]    ['] [deg]  [deg]                   [']
326.0515  38.3666   16.5  55.0  -14.4  -0.4413  -0.7    6.3	Cyg X-2
 18.9882   4.4022    2.1  34.3   70.0   2.2628   5.5 ------	UNKNOWN
358.8312  -0.8988    3.1  15.1   48.9   0.6392   3.7   88.5	UNKNOWN
308.6515  19.3117    3.1  50.7  -44.5   3.6292   3.7 ------	UNKNOWN
306.8289 -16.3051    3.9  40.9  -93.3   2.6662   3.0 ------	UNKNOWN
Pre-slew background subtracted image of 15-350 keV band
Time interval of the image:
-1.972000 26.288000

# RAcent  DECcent POSerr Theta    Phi  PeakCts   SNR AngSep     Name
#  [deg]    [deg]    ['] [deg]  [deg]                   [']
326.1778  38.3864    6.5  55.0  -14.3  -0.6003  -1.8    3.9	Cyg X-2
 12.2670 -50.7646    3.1  42.9  165.8   1.2101   3.8 ------	UNKNOWN
  0.4739 -53.5165    2.8  42.2  177.2   1.3006   4.1 ------	UNKNOWN
327.9119 -59.9814    0.2  50.1 -159.0  33.2071  58.2 ------	UNKNOWN
307.6651 -40.0867    2.5  45.6 -127.6   3.2634   4.6 ------	UNKNOWN
Post-slew image of 15-350 keV band
Time interval of the image:
Plot creation:
Sun May 31 14:26:29 EDT 2015