Special notes of this burst
Image
Pre-slew 15.0-350.0 keV image (Event data)

#   RAcent    DECcent   POSerr    Theta     Phi              Peak Cts       SNR   Name
   77.1049    69.7250   0.0135    37.8139  -158.2628         0.8451603     14.125 TRIG_00178750

Foreground time interval of the image:
 -1.200  13.548 (delta_t =  14.748 [sec])
Background time interval of the image:
-27.899  -1.200 (delta_t =  26.699 [sec])
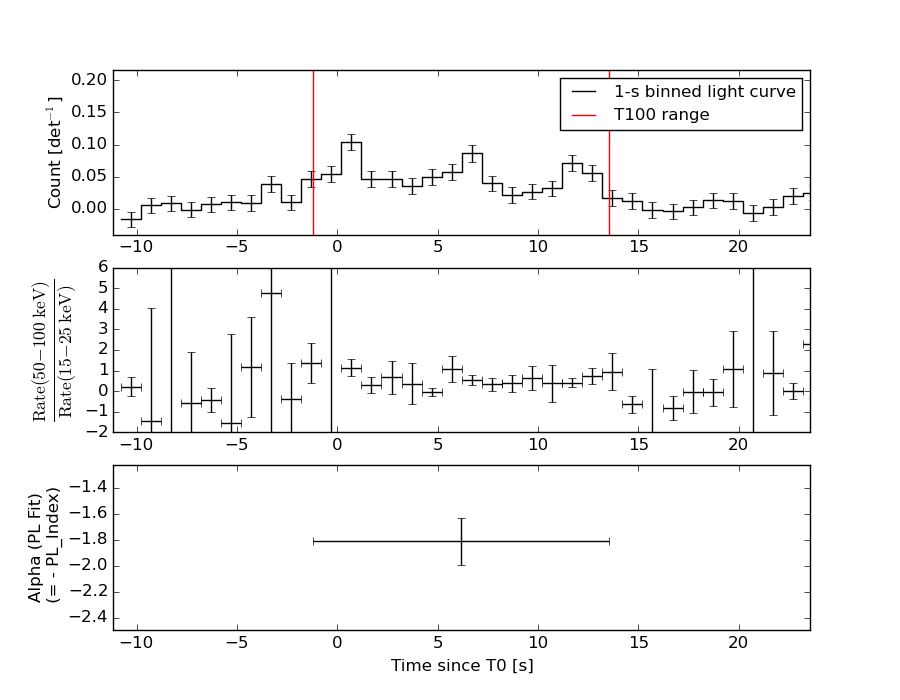
Lightcurves
Notes:
- 1) The mask-weighted light curves are using the flight position.
- 2) Multiple plots of different time binning/intervals are shown to cover all scenarios of short/long GRBs, rate/image triggers, and real/false positives.
- 3) For all the mask-weighted lightcurves, the y-axis units are counts/sec/det where a det is 0.4 x 0.4 = 0.16 sq cm.
- 4) The verticle lines correspond to following: green dotted lines are T50 interval, black dotted lines are T90 interval, blue solid line(s) is a spacecraft slew start time, and orange solid line(s) is a spacecraft slew end time.
- 5) Time of each bin is in the middle of the bin.
1 s binning
From T0-310 s to T0+310 s

From T100_start - 20 s to T100_end + 30 s

Full time interval
64 ms binning
Full time interval
From T100_start to T100_end
From T0-5 sec to T0+5 sec
16 ms binning
From T100_start-5 s to T100_start+5 s
Blue+Cyan dotted lines: Time interval of the scaled map
From 0.000000 to 1.024000
8 ms binning
From T100_start-3 s to T100_start+3 s
Blue+Cyan dotted lines: Time interval of the scaled map
From 0.000000 to 1.024000
2 ms binning
From T100_start-1 s to T100_start+1 s

Blue+Cyan dotted lines: Time interval of the scaled map
From 0.000000 to 1.024000
SN=5 or 10 sec. binning (whichever binning is satisfied first)
SN=5 or 10 sec. binning (T < 200 sec)

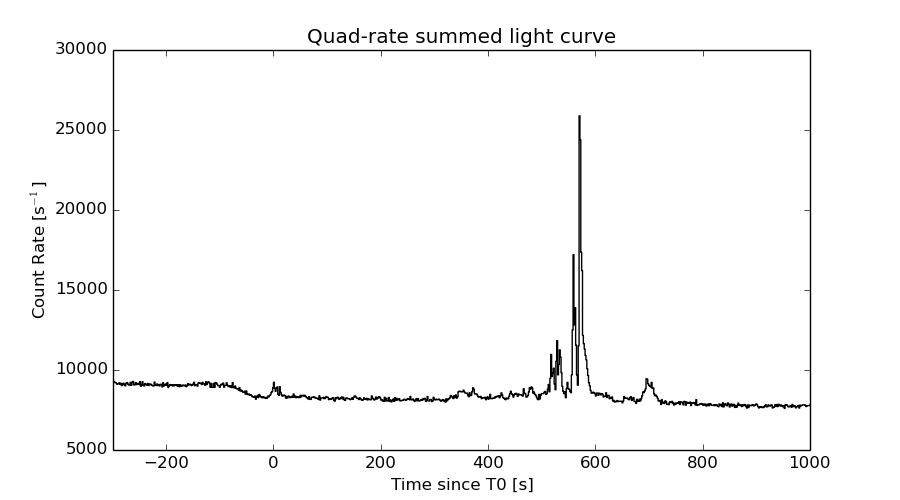
Quad-rate summed light curves (from T0-300s to T0+1000s)
Spectral Evolution
Spectra
Notes:
- 1) The fitting includes the systematic errors.
- 2) When the burst includes telescope slew time periods, the fitting uses an average response file made from multiple 5-s response files through out the slew time plus single time preiod for the non-slew times, and weighted by the total counts in the corresponding time period using addrmf. An average response file is needed becuase a spectral fit using the pre-slew DRM will introduce some errors in both a spectral shape and a normalization if the PHA file contains a lot of the slew/post-slew time interval.
- 3) For fits to more complicated models (e.g. a power-law over a cutoff power-law), the BAT team has decided to require a chi-square improvement of more than 6 for each extra dof.
Time averaged spectrum fit using the average DRM
Power-law model

Time interval is from   -1.200 sec. to   13.548 sec.

Spectral model in power-law:
------------------------------------------------------------
Parameters  : value       lower 90%   higher 90%
Photon index: 1.81370     ( -0.176925   0.18285 )
Norm@50keV  : 3.42799E-03    ( -0.000388214   0.000380674 )
------------------------------------------------------------
#Fit statistic : Chi-Squared =          41.15 using 59 PHA bins.
# Reduced chi-squared =         0.7220 for     57 degrees of freedom
# Null hypothesis probability =   9.435459e-01

Photon flux (15-150 keV)    in 14.75 sec: 0.474902 ( -0.0459631  0.0459863 ) ph/cm2/s
Energy fluence (15-150 keV)             : 4.65277e-07 ( -5.29647e-08  5.3843e-08 ) ergs/cm2
Cutoff power-law model

Time interval is from   -1.200 sec. to   13.548 sec.
Spectral model in the cutoff power-law:
------------------------------------------------------------
Parameters  : value       lower 90%   higher 90%
Photon index: 1.73706     ( -0.778234   0.635754 )
Epeak [keV] : 148.016      ( -153.248 -153.261 )
Norm@50keV  : 3.78863E-03    ( -0.00200995   0.00660497 )
------------------------------------------------------------
#Fit statistic : Chi-Squared =          41.12 using 59 PHA bins.
# Reduced chi-squared =         0.7343 for     56 degrees of freedom
# Null hypothesis probability =   9.318324e-01

Photon flux (15-150 keV)    in 14.75 sec: 0.473361 ( -0.047518  0.047093 ) ph/cm2/s
Energy fluence (15-150 keV)             : 4.61535e-07 ( -6.48808e-08  5.69483e-08 ) ergs/cm2
Band function

Time interval is from   -1.200 sec. to   13.548 sec.

Spectral model in the Band function:
------------------------------------------------------------
Parameters  : value       lower 90%   higher 90%
alpha       : 4.49208   ( -4.49208   -4.49208 )
beta        : -1.99419    ( -0.256661   0.227282 )
Epeak [keV] : 25.3459      ( -4.55526 3.72663 )
Norm@50keV   : 187.635    ( -17.9288   11767.3 )
------------------------------------------------------------
#Fit statistic : Chi-Squared =          38.45 using 59 PHA bins.
# Reduced chi-squared =         0.6991 for     55 degrees of freedom
# Null hypothesis probability =   9.560157e-01

Photon flux (15-150 keV)    in 14.75 sec:  (    ) ph/cm2/s
Energy fluence (15-150 keV)             : 0 ( 0  0 ) ergs/cm2
Single BB
Spectral model blackbody:
------------------------------------------------------------
Parameters  : value    Lower 90%  Upper 90%
kT [keV]    : 10.3429  (-1.21472  1.41771)
R^2/D10^2   : 0.193905  (-0.0745096   0.117465)
(R is the radius in km and D10 is the distance to the source in units of 10 kpc)
------------------------------------------------------------
#Fit statistic : Chi-Squared =          65.79 using 59 PHA bins.
# Reduced chi-squared =          1.154 for     57 degrees of freedom
# Null hypothesis probability =   1.988288e-01

Energy  Fluence     90% Error
[keV]   [erg/cm2]   [erg/cm2]
15- 25  6.298e-08   1.136e-08
25- 50  1.641e-07   2.066e-08
50-150  9.435e-08   2.444e-08
15-150  3.214e-07   4.432e-08
Thermal bremsstrahlung (OTTB)
Spectral model: thermal bremsstrahlung
------------------------------------------------------------
Parameters  : value         Lower 90%    Upper 90%
kT [keV]    : 95.3121       (-29.4807      56.9227)
Norm        : 2.11471       (-0.283382     0.351305)
------------------------------------------------------------
#Fit statistic : Chi-Squared =          42.00 using 59 PHA bins.
# Reduced chi-squared =         0.7369 for     57 degrees of freedom
# Null hypothesis probability =   9.314813e-01

Energy  Fluence     90% Error
[keV]   [erg/cm2]   [erg/cm2]
15- 25  8.149e-08   1.165e-08
25- 50  1.395e-07   1.499e-08
50-150  2.199e-07   8.621e-08
15-150  4.410e-07   1.016e-07
Double BB
Spectral model: bbodyrad<1> + bbodyrad<2>
------------------------------------------------------------
Parameters  : value         Lower 90%    Upper 90%
kT1 [keV]   : 7.47686        (-1.40276      1.45752)
R1^2/D10^2  : 0.548871        (-0.254274      0.307425)
kT2 [keV]   : 39.1117        (-16.5868      140.737)
R2^2/D10^2  : 1.22378E-03    (-0.00112654   0.00617384)
------------------------------------------------------------
#Fit statistic : Chi-Squared =          37.20 using 59 PHA bins.
# Reduced chi-squared =         0.6763 for     55 degrees of freedom
# Null hypothesis probability =   9.685555e-01

Energy  Fluence     90% Error
[keV]   [erg/cm2]   [erg/cm2]
15- 25  8.108e-08   2.139e-08
25- 50  1.447e-07   3.930e-08
50-150  2.531e-07   1.358e-07
15-150  4.789e-07   1.682e-07
Peak spectrum fit
Power-law model
Time interval is from    0.184 sec. to    1.184 sec.

Spectral model in power-law:
------------------------------------------------------------
Parameters  : value       lower 90%   higher 90%
Photon index: 1.57664     ( -0.344453   0.357902 )
Norm@50keV  : 6.75070E-03    ( -0.00147938   0.00144931 )
------------------------------------------------------------
#Fit statistic : Chi-Squared =          44.24 using 59 PHA bins.
# Reduced chi-squared =         0.7761 for     57 degrees of freedom
# Null hypothesis probability =   8.915194e-01

Photon flux (15-150 keV)    in 1 sec: 0.861337 ( -0.175621  0.175813 ) ph/cm2/s
Energy fluence (15-150 keV)             : 6.33198e-08 ( -1.47219e-08  1.51269e-08 ) ergs/cm2
Cutoff power-law model
Time interval is from    0.184 sec. to    1.184 sec.
Spectral model in the cutoff power-law:
------------------------------------------------------------
Parameters  : value       lower 90%   higher 90%
Photon index: 0.978188     ( -1.02668   0.907951 )
Epeak [keV] : 79.3279      (   )
Norm@50keV  : 1.41795E-02    (     )
------------------------------------------------------------
#Fit statistic : Chi-Squared =          43.62 using 59 PHA bins.
# Reduced chi-squared =         0.7790 for     56 degrees of freedom
# Null hypothesis probability =   8.857956e-01

Photon flux (15-150 keV)    in 1 sec: 0.842936 ( -0.180318  0.180174 ) ph/cm2/s
Energy fluence (15-150 keV)             : 6.00302e-08 ( -1.63357e-08  1.66981e-08 ) ergs/cm2
Band function
Time interval is from    0.184 sec. to    1.184 sec.

Spectral model in the Band function:
------------------------------------------------------------
Parameters  : value       lower 90%   higher 90%
alpha       : -1.01590   ( -0.784077   1.31635 )
beta        : -9.37155    ( 9.37167   19.3717 )
Epeak [keV] : 83.2862      ( -38.583 -83.0671 )
Norm@50keV   : 1.34087E-02    ( -0.00701307   0.0104121 )
------------------------------------------------------------
#Fit statistic : Chi-Squared =          43.63 using 59 PHA bins.
# Reduced chi-squared =         0.7933 for     55 degrees of freedom
# Null hypothesis probability =   8.653447e-01

Photon flux (15-150 keV)    in 1 sec: 0.843745 (    ) ph/cm2/s
Energy fluence (15-150 keV)             : 6.12214e-08 ( 0  0 ) ergs/cm2
Single BB
Spectral model blackbody:
------------------------------------------------------------
Parameters  : value    Lower 90%  Upper 90%
kT [keV]    : 12.9031  (-3.07791  4.21946)
R^2/D10^2   : 0.165242  (-0.104559   0.273124)
(R is the radius in km and D10 is the distance to the source in units of 10 kpc)
------------------------------------------------------------
#Fit statistic : Chi-Squared =          48.27 using 59 PHA bins.
# Reduced chi-squared =         0.8468 for     57 degrees of freedom
# Null hypothesis probability =   7.882599e-01

Energy  Fluence     90% Error
[keV]   [erg/cm2]   [erg/cm2]
15- 25  5.835e-09   2.266e-09
25- 50  1.993e-08   8.410e-09
50-150  2.089e-08   1.010e-08
15-150  4.666e-08   1.721e-08
Thermal bremsstrahlung (OTTB)

Spectral model: thermal bremsstrahlung
------------------------------------------------------------
Parameters  : value         Lower 90%    Upper 90%
kT [keV]    : 170.008       (-98.5401      -169.949)
Norm        : 3.55274       (-0.740629     0.970673)
------------------------------------------------------------
#Fit statistic : Chi-Squared =          43.73 using 59 PHA bins.
# Reduced chi-squared =         0.7672 for     57 degrees of freedom
# Null hypothesis probability =   9.016982e-01

Energy  Fluence     90% Error
[keV]   [erg/cm2]   [erg/cm2]
15- 25  9.016e-09   5.190e-09
25- 50  1.700e-08   9.760e-09
50-150  3.526e-08   2.016e-08
15-150  6.128e-08   3.505e-08
Double BB
------------------------------------------------------------
Parameters  : value         Lower 90%    Upper 90%
kT1 [keV]   : 7.42565        (-3.65461      4.70345)
R1^2/D10^2  : 0.812268        (      )
kT2 [keV]   : 26.7357        (-22.8323      -26.7849)
R2^2/D10^2  : 8.88801E-03    (-0.0087825   0.0839781)
------------------------------------------------------------
#Fit statistic : Chi-Squared =          43.00 using 59 PHA bins.
#Fit statistic : Chi-Squared =          42.81 using 59 PHA bins.
# Reduced chi-squared =         0.7818 for     55 degrees of freedom
# Reduced chi-squared =         0.7784 for     55 degrees of freedom
# Null hypothesis probability =   8.800565e-01
# Null hypothesis probability =   8.841606e-01

Energy  Fluence     90% Error
[keV]   [erg/cm2]   [erg/cm2]
15- 25  8.565e-09   5.170e-09
25- 50  1.715e-08   9.165e-09
50-150  3.177e-08   1.883e-08
15-150  5.748e-08   3.225e-08
Pre-slew spectrum (Pre-slew PHA with pre-slew DRM)
Power-law model
Spectral model in power-law:
------------------------------------------------------------
Parameters  : value       lower 90%   higher 90%
Photon index: 1.81370     ( -0.176925   0.18285 )
Norm@50keV  : 3.42799E-03    ( -0.000388214   0.000380674 )
------------------------------------------------------------
#Fit statistic : Chi-Squared =          41.15 using 59 PHA bins.
# Reduced chi-squared =         0.7220 for     57 degrees of freedom
# Null hypothesis probability =   9.435459e-01

Photon flux (15-150 keV)    in 14.75 sec: 0.474902 ( -0.0459631  0.0459863 ) ph/cm2/s
Energy fluence (15-150 keV)             : 4.65277e-07 ( -5.29647e-08  5.3843e-08 ) ergs/cm2
Cutoff power-law model

Spectral model in the cutoff power-law:
------------------------------------------------------------
Parameters  : value       lower 90%   higher 90%
Photon index: 1.73706     ( -0.778234   0.635754 )
Epeak [keV] : 148.016      ( -153.248 -153.261 )
Norm@50keV  : 3.78863E-03    ( -0.00200995   0.00660497 )
------------------------------------------------------------
#Fit statistic : Chi-Squared =          41.12 using 59 PHA bins.
# Reduced chi-squared =         0.7343 for     56 degrees of freedom
# Null hypothesis probability =   9.318324e-01

Photon flux (15-150 keV)    in 14.75 sec: 0.473361 ( -0.047518  0.047089 ) ph/cm2/s
Energy fluence (15-150 keV)             : 4.61535e-07 ( -6.48808e-08  5.69483e-08 ) ergs/cm2
Band function
Spectral model in the Band function:
------------------------------------------------------------
Parameters  : value       lower 90%   higher 90%
alpha       : 4.49208   ( -4.49208   -4.49208 )
beta        : -1.99419    ( -0.256661   0.227282 )
Epeak [keV] : 25.3459      ( -4.55526 3.72663 )
Norm@50keV   : 187.635    ( -17.9288   11767.3 )
------------------------------------------------------------
#Fit statistic : Chi-Squared =          38.45 using 59 PHA bins.
# Reduced chi-squared =         0.6991 for     55 degrees of freedom
# Null hypothesis probability =   9.560157e-01

Photon flux (15-150 keV)    in 14.75 sec:  (    ) ph/cm2/s
Energy fluence (15-150 keV)             : 0 ( 0  0 ) ergs/cm2
S(25-50 keV) vs. S(50-100 keV) plot
S(25-50 keV)  = 1.32e-07
S(50-100 keV) = 1.50e-07
T90 vs. Hardness ratio plot
T90                                   = 13.4239999949932 sec.
Hardness ratio (energy fluence ratio) = 1.13636
Color vs. Color plot
Count Ratio  (25-50 keV) / (15-25 keV) = 1.27624
Count Ratio (50-100 keV) / (15-25 keV) = 0.654796
Mask shadow pattern
IMX = -7.208831570264456E-01, IMY = 2.874164623184512E-01
TIME vs. PHA plot around the trigger time
Blue+Cyan dotted lines: Time interval of the scaled map
From 0.000000 to 1.024000
TIME vs. DetID plot around the trigger time
Blue+Cyan dotted lines: Time interval of the scaled map
From 0.000000 to 1.024000
100 us light curve (15-350 keV)
Blue+Cyan dotted lines: Time interval of the scaled map
From 0.000000 to 1.024000
Spacecraft aspect plot
Bright source in the pre-burst/pre-slew/post-slew images
Pre-burst image of 15-350 keV band
Time interval of the image:
-27.899400 -1.200000

# RAcent  DECcent POSerr Theta    Phi  PeakCts   SNR AngSep     Name
#  [deg]    [deg]    ['] [deg]  [deg]                   [']
153.2197  -2.4514    2.2  50.0   30.6   1.1404   5.3 ------	UNKNOWN
125.5825  17.7411    2.0  29.6   74.7   0.4329   5.7 ------	UNKNOWN
 97.5377  39.4994    2.1  29.8  143.8   0.3538   5.5 ------	UNKNOWN
126.4748  29.0488    2.5  18.7   82.7   0.2397   4.6 ------	UNKNOWN
151.8331  17.2636    2.2  30.8   23.8   0.3154   5.3 ------	UNKNOWN
205.8990  65.8294    3.0  40.7  -93.1   0.7221   3.8 ------	UNKNOWN
Pre-slew background subtracted image of 15-350 keV band
Time interval of the image:
-1.200000 13.548000

# RAcent  DECcent POSerr Theta    Phi  PeakCts   SNR AngSep     Name
#  [deg]    [deg]    ['] [deg]  [deg]                   [']
138.8304   0.0306    2.1  45.6   49.4   1.0380   5.5 ------	UNKNOWN
 71.0440  39.3607    3.3  48.0  158.7   0.4352   3.5 ------	UNKNOWN
150.5175  18.5246    2.6  29.2   25.3   0.2588   4.5 ------	UNKNOWN
 77.1049  69.7250    0.8  37.8 -158.3   0.8451  14.1 ------	UNKNOWN
181.3243  64.6652    2.4  30.4  -93.1   0.3429   4.7 ------	UNKNOWN
Post-slew image of 15-350 keV band
Time interval of the image:
89.300590 302.276800

# RAcent  DECcent POSerr Theta    Phi  PeakCts   SNR AngSep     Name
#  [deg]    [deg]    ['] [deg]  [deg]                   [']
 83.6282  22.0211    0.9  47.9  139.3   9.4691  12.6    0.5	Crab
117.8743  37.1133    2.1  39.2   92.0   3.4304   5.4 ------	UNKNOWN
158.2590  49.1733    2.8  41.9   43.0   1.7101   4.1 ------	UNKNOWN
171.6323  67.4856    3.0  31.2   15.2   0.7157   3.9 ------	UNKNOWN
 72.4904  54.6961    2.7  15.2  157.6   0.6567   4.3 ------	UNKNOWN
307.2821  61.8627    3.3  43.7  -64.0   2.6007   3.5 ------	UNKNOWN
Plot creation:
Sun May 31 14:24:46 EDT 2015