Click here for the BAT GCN circular template
Image
Pre-slew 15.0-350.0 keV image (Event data)

#   RAcent    DECcent   POSerr    Theta     Phi              Peak Cts       SNR   Name
   35.8104    38.3746   0.0172    38.1368  -155.9733         1.4640845     11.167 TRIG_00179968

Foreground time interval of the image:
-26.448  72.501 (delta_t =  98.949 [sec])
Background time interval of the image:
-299.000 -26.448 (delta_t = 272.552 [sec])
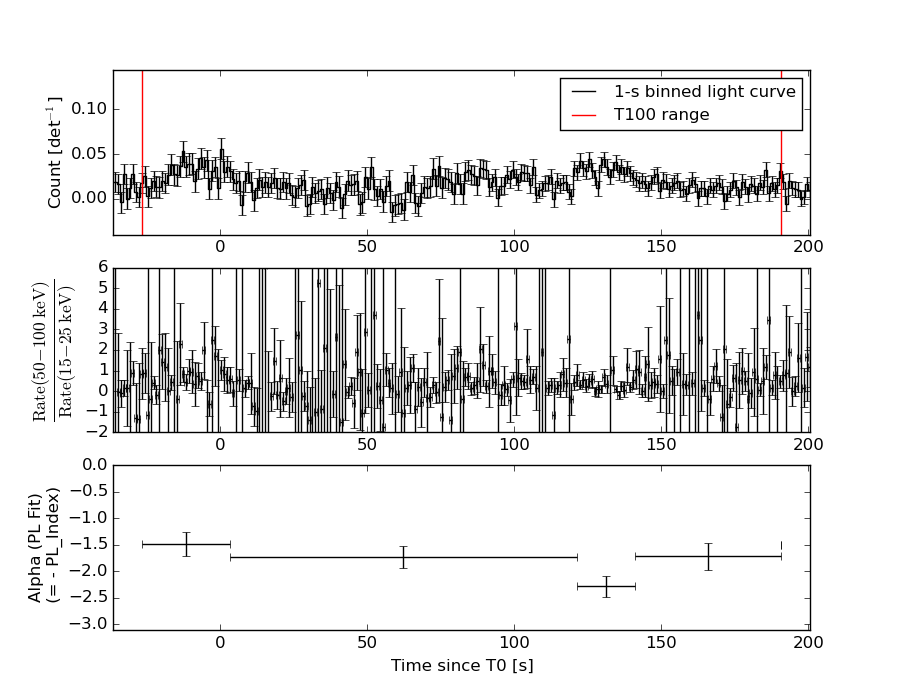
Lightcurves
Notes:
- 1) The mask-weighted light curves are using the flight position.
- 2) Multiple plots of different time binning/intervals are shown to cover all scenarios of short/long GRBs, rate/image triggers, and real/false positives.
- 3) For all the mask-weighted lightcurves, the y-axis units are counts/sec/det where a det is 0.4 x 0.4 = 0.16 sq cm.
- 4) The verticle lines correspond to following: green dotted lines are T50 interval, black dotted lines are T90 interval, blue solid line(s) is a spacecraft slew start time, and orange solid line(s) is a spacecraft slew end time.
- 5) Time of each bin is in the middle of the bin.
1 s binning
From T0-310 s to T0+310 s

From T100_start - 20 s to T100_end + 30 s

Full time interval

64 ms binning
Full time interval

From T100_start to T100_end

From T0-5 sec to T0+5 sec

16 ms binning
From T100_start-5 s to T100_start+5 s

8 ms binning
From T100_start-3 s to T100_start+3 s

2 ms binning
From T100_start-1 s to T100_start+1 s

SN=5 or 10 sec. binning (whichever binning is satisfied first)

SN=5 or 10 sec. binning (T < 200 sec)

Quad-rate summed light curves (from T0-300s to T0+1000s)

Spectral Evolution
Spectra
Notes:
- 1) The fitting includes the systematic errors.
- 2) When the burst includes telescope slew time periods, the fitting uses an average response file made from multiple 5-s response files through out the slew time plus single time preiod for the non-slew times, and weighted by the total counts in the corresponding time period using addrmf. An average response file is needed becuase a spectral fit using the pre-slew DRM will introduce some errors in both a spectral shape and a normalization if the PHA file contains a lot of the slew/post-slew time interval.
- 3) For fits to more complicated models (e.g. a power-law over a cutoff power-law), the BAT team has decided to require a chi-square improvement of more than 6 for each extra dof.
Time averaged spectrum fit using the average DRM
Power-law model

Time interval is from  -26.448 sec. to  190.560 sec.

Spectral model in power-law:
------------------------------------------------------------
Parameters  : value       lower 90%   higher 90%
Photon index: 1.76925     ( -0.123938   0.126297 )
Norm@50keV  : 1.11173E-03    ( -8.10068e-05   8.00421e-05 )
------------------------------------------------------------
#Fit statistic : Chi-Squared =          59.75 using 59 PHA bins.
# Reduced chi-squared =          1.048 for     57 degrees of freedom
# Null hypothesis probability =   3.761992e-01

Photon flux (15-150 keV)    in 217 sec: 0.151406 ( -0.0100973  0.010115 ) ph/cm2/s
Energy fluence (15-150 keV)             : 2.22379e-06 ( -1.6661e-07  1.68106e-07 ) ergs/cm2
Cutoff power-law model

Time interval is from  -26.448 sec. to  190.560 sec.
Spectral model in the cutoff power-law:
------------------------------------------------------------
Parameters  : value       lower 90%   higher 90%
Photon index: 1.77397     ( -0.330918   0.123437 )
Epeak [keV] : 9999.36      ( -9999.35 -9999.36 )
Norm@50keV  : 1.10971E-03    ( -0.000530728   0.000522889 )
------------------------------------------------------------
#Fit statistic : Chi-Squared =          59.76 using 59 PHA bins.
# Reduced chi-squared =          1.067 for     56 degrees of freedom
# Null hypothesis probability =   3.408065e-01

Photon flux (15-150 keV)    in 217 sec: 0.151364 ( -0.01009  0.010087 ) ph/cm2/s
Energy fluence (15-150 keV)             : 2.22089e-06 ( -8.41873e-08  1.68001e-07 ) ergs/cm2
Band function

Time interval is from  -26.448 sec. to  190.560 sec.

Spectral model in the Band function:
------------------------------------------------------------
Parameters  : value       lower 90%   higher 90%
alpha       : -0.299993   ( 1.20275   6.12236 )
beta        : -1.80861    ( -0.193934   0.133252 )
Epeak [keV] : 28.5408      ( -28.5252 325.269 )
Norm@50keV   : 1.40749E-02    ( -0.0149632   104.387 )
------------------------------------------------------------
#Fit statistic : Chi-Squared =          59.16 using 59 PHA bins.
# Reduced chi-squared =          1.076 for     55 degrees of freedom
# Null hypothesis probability =   3.263382e-01

Photon flux (15-150 keV)    in 217 sec:  (    ) ph/cm2/s
Energy fluence (15-150 keV)             : 0 ( 0  0 ) ergs/cm2
Single BB

Spectral model blackbody:
------------------------------------------------------------
Parameters  : value    Lower 90%  Upper 90%
kT [keV]    : 11.8748  (  )
R^2/D10^2   : 3.60307E-02  (   )
(R is the radius in km and D10 is the distance to the source in units of 10 kpc)
------------------------------------------------------------
#Fit statistic : Chi-Squared =         140.25 using 59 PHA bins.
# Reduced chi-squared =         2.4606 for     57 degrees of freedom
# Null hypothesis probability =   5.724097e-09

Energy  Fluence     90% Error
[keV]   [erg/cm2]   [erg/cm2]
15- 25  2.330e-07   2.844e-08
25- 50  7.242e-07   5.892e-08
50-150  6.097e-07   9.624e-08
15-150  1.567e-06   1.352e-07
Thermal bremsstrahlung (OTTB)

Spectral model: thermal bremsstrahlung
------------------------------------------------------------
Parameters  : value         Lower 90%    Upper 90%
kT [keV]    : 123.601       (-33.5203      46.1375)
Norm        : 0.626516       (-0.0520582     0.0704143)
------------------------------------------------------------
#Fit statistic : Chi-Squared =          64.69 using 59 PHA bins.
# Reduced chi-squared =          1.135 for     57 degrees of freedom
# Null hypothesis probability =   2.261475e-01

Energy  Fluence     90% Error
[keV]   [erg/cm2]   [erg/cm2]
15- 25  3.537e-07   3.591e-08
25- 50  6.359e-07   5.859e-08
50-150  1.151e-06   3.894e-07
15-150  2.141e-06   4.556e-07
Double BB

Spectral model: bbodyrad<1> + bbodyrad<2>
------------------------------------------------------------
Parameters  : value         Lower 90%    Upper 90%
kT1 [keV]   : 6.18692        (-0.912213      1.01861)
R1^2/D10^2  : 0.310385        (-0.133581      0.263144)
kT2 [keV]   : 26.7717        (-5.09047      8.44447)
R2^2/D10^2  : 1.50389E-03    (-0.000892548   0.00168699)
------------------------------------------------------------
#Fit statistic : Chi-Squared =          57.28 using 59 PHA bins.
# Reduced chi-squared =          1.041 for     55 degrees of freedom
# Null hypothesis probability =   3.906822e-01

Energy  Fluence     90% Error
[keV]   [erg/cm2]   [erg/cm2]
15- 25  3.967e-07   8.148e-08
25- 50  6.105e-07   1.058e-07
50-150  1.244e-06   4.061e-07
15-150  2.251e-06   5.219e-07
Peak spectrum fit
Power-law model

Time interval is from   -6.448 sec. to   -5.448 sec.

Spectral model in power-law:
------------------------------------------------------------
Parameters  : value       lower 90%   higher 90%
Photon index: 1.37532     ( -0.687551   0.645078 )
Norm@50keV  : 4.36194E-03    ( -0.00130536   0.00129368 )
------------------------------------------------------------
#Fit statistic : Chi-Squared =          39.07 using 59 PHA bins.
# Reduced chi-squared =         0.6855 for     57 degrees of freedom
# Null hypothesis probability =   9.665416e-01

Photon flux (15-150 keV)    in 1 sec: 0.528225 ( -0.167819  0.166772 ) ph/cm2/s
Energy fluence (15-150 keV)             : 4.23776e-08 ( -1.41073e-08  1.41455e-08 ) ergs/cm2
Cutoff power-law model

Time interval is from   -6.448 sec. to   -5.448 sec.
Spectral model in the cutoff power-law:
------------------------------------------------------------
Parameters  : value       lower 90%   higher 90%
Photon index: 2.02668     (     )
Epeak [keV] : 10.5590      (   )
Norm@50keV  : 1.98960E-03    (     )
------------------------------------------------------------
#Fit statistic : Chi-Squared =          38.69 using 59 PHA bins.
# Reduced chi-squared =         0.6909 for     56 degrees of freedom
# Null hypothesis probability =   9.623459e-01

Photon flux (15-150 keV)    in 1 sec: 0.529499 ( -0.162713  0.165216 ) ph/cm2/s
Energy fluence (15-150 keV)             : 4.17391e-08 ( -1.35426e-08  1.37574e-08 ) ergs/cm2
Band function

Time interval is from   -6.448 sec. to   -5.448 sec.

Spectral model in the Band function:
------------------------------------------------------------
Parameters  : value       lower 90%   higher 90%
alpha       : -1.11691   ( 1.11706   1.11706 )
beta        : -1.37325    ( 1.37396   0.687637 )
Epeak [keV] : 33.8337      ( -33.8785 -33.8785 )
Norm@50keV   : 8.55503E-03    ( -0.00855992   0.141898 )
------------------------------------------------------------
#Fit statistic : Chi-Squared =          39.07 using 59 PHA bins.
# Reduced chi-squared =         0.7104 for     55 degrees of freedom
# Null hypothesis probability =   9.485465e-01

Photon flux (15-150 keV)    in 1 sec:  (    ) ph/cm2/s
Energy fluence (15-150 keV)             : 0 ( 0  0 ) ergs/cm2
Single BB

Spectral model blackbody:
------------------------------------------------------------
Parameters  : value    Lower 90%  Upper 90%
kT [keV]    : 23.7839  (-12.0968  59.431)
R^2/D10^2   : 1.20116E-02  (-0.0113073   0.107559)
(R is the radius in km and D10 is the distance to the source in units of 10 kpc)
------------------------------------------------------------
#Fit statistic : Chi-Squared =          46.75 using 59 PHA bins.
# Reduced chi-squared =         0.8201 for     57 degrees of freedom
# Null hypothesis probability =   8.318242e-01

Energy  Fluence     90% Error
[keV]   [erg/cm2]   [erg/cm2]
15- 25  1.211e-09   8.140e-10
25- 50  6.694e-09   4.277e-09
50-150  2.823e-08   1.728e-08
15-150  3.614e-08   2.245e-08
Thermal bremsstrahlung (OTTB)

Spectral model: thermal bremsstrahlung
------------------------------------------------------------
Parameters  : value         Lower 90%    Upper 90%
kT [keV]    : 199.363       (-124.007      -199.363)
Norm        : 2.17166       (-0.656545     0.656545)
------------------------------------------------------------
#Fit statistic : Chi-Squared =          40.34 using 59 PHA bins.
# Reduced chi-squared =         0.7078 for     57 degrees of freedom
# Null hypothesis probability =   9.535627e-01

Energy  Fluence     90% Error
[keV]   [erg/cm2]   [erg/cm2]
15- 25  5.408e-09   3.296e-09
25- 50  1.040e-08   6.375e-09
50-150  2.281e-08   1.379e-08
15-150  3.862e-08   2.370e-08
Double BB

Spectral model: bbodyrad<1> + bbodyrad<2>
------------------------------------------------------------
Parameters  : value         Lower 90%    Upper 90%
kT1 [keV]   : 5.09823        (-2.09263      2.06086)
R1^2/D10^2  : 2.66150        (-2.45044      30.4212)
kT2 [keV]   : 71.0173        (-48.0514      -72.3767)
R2^2/D10^2  : 6.31336E-04    (-0.000535113   0.00324438)
------------------------------------------------------------
#Fit statistic : Chi-Squared =          35.88 using 59 PHA bins.
# Reduced chi-squared =         0.6524 for     55 degrees of freedom
# Null hypothesis probability =   9.785889e-01

Energy  Fluence     90% Error
[keV]   [erg/cm2]   [erg/cm2]
15- 25  7.253e-09   4.391e-09
25- 50  6.806e-09   4.041e-09
50-150  3.297e-08   1.906e-08
15-150  4.703e-08   2.487e-08
Pre-slew spectrum (Pre-slew PHA with pre-slew DRM)
Power-law model

Spectral model in power-law:
------------------------------------------------------------
Parameters  : value       lower 90%   higher 90%
Photon index: 1.46913     ( -0.221964   0.222502 )
Norm@50keV  : 1.06997E-03    ( -0.000129863   0.000129322 )
------------------------------------------------------------
#Fit statistic : Chi-Squared =          59.26 using 59 PHA bins.
# Reduced chi-squared =          1.040 for     57 degrees of freedom
# Null hypothesis probability =   3.932611e-01

Photon flux (15-150 keV)    in 98.95 sec: 0.132497 ( -0.0164937  0.0165737 ) ph/cm2/s
Energy fluence (15-150 keV)             : 1.00965e-06 ( -1.33813e-07  1.34834e-07 ) ergs/cm2
Cutoff power-law model

Spectral model in the cutoff power-law:
------------------------------------------------------------
Parameters  : value       lower 90%   higher 90%
Photon index: 1.47567     ( -0.232177   0.215516 )
Epeak [keV] : 9999.36      ( -9999.36 -9999.36 )
Norm@50keV  : 1.06882E-03    ( -0.00107244   0.000728568 )
------------------------------------------------------------
#Fit statistic : Chi-Squared =          59.27 using 59 PHA bins.
# Reduced chi-squared =          1.058 for     56 degrees of freedom
# Null hypothesis probability =   3.570787e-01

Photon flux (15-150 keV)    in 98.95 sec: 0.132875 ( -0.008501  0.016184 ) ph/cm2/s
Energy fluence (15-150 keV)             : 1.01048e-06 ( -1.34057e-07  1.30456e-07 ) ergs/cm2
Band function

Spectral model in the Band function:
------------------------------------------------------------
Parameters  : value       lower 90%   higher 90%
alpha       : -9.95727   ( 9.95727   9.95727 )
beta        : -1.46912    ( -0.222226   0.222242 )
Epeak [keV] : 49.7460      ( -49.746 -49.746 )
Norm@50keV   : 0.145424    ( -0.017651   0.0175765 )
------------------------------------------------------------
#Fit statistic : Chi-Squared =          59.26 using 59 PHA bins.
# Reduced chi-squared =          1.077 for     55 degrees of freedom
# Null hypothesis probability =   3.231287e-01

Photon flux (15-150 keV)    in 98.95 sec:  (    ) ph/cm2/s
Energy fluence (15-150 keV)             : 0 ( 0  0 ) ergs/cm2
S(25-50 keV) vs. S(50-100 keV) plot
S(25-50 keV)  = 6.19e-07
S(50-100 keV) = 7.26e-07
T90 vs. Hardness ratio plot

T90                                   = 192.876000016928 sec.
Hardness ratio (energy fluence ratio) = 1.17286
Color vs. Color plot

Count Ratio  (25-50 keV) / (15-25 keV) = 1.0225
Count Ratio (50-100 keV) / (15-25 keV) = 0.693868
Mask shadow pattern

IMX = -7.171113790294807E-01, IMY = 3.196790061159926E-01
TIME vs. PHA plot around the trigger time

TIME vs. DetID plot around the trigger time

100 us light curve (15-350 keV)

Spacecraft aspect plot

Bright source in the pre-burst/pre-slew/post-slew images
Pre-burst image of 15-350 keV band
Time interval of the image:
-299.000000 -26.448000

# RAcent  DECcent POSerr Theta    Phi  PeakCts   SNR AngSep     Name
#  [deg]    [deg]    ['] [deg]  [deg]                   [']
 83.6312  22.0049    0.8  47.9  139.0  11.3901  13.7    0.6	Crab
259.7589  67.5022    3.2  42.8  -34.4   1.1076   3.7 ------	UNKNOWN
 19.8806  25.3638    4.2  55.2 -145.1   3.1048   2.8 ------	UNKNOWN
274.5955  58.8841    3.8  50.8  -44.4   2.9640   3.1 ------	UNKNOWN
Pre-slew background subtracted image of 15-350 keV band
Time interval of the image:
-26.448000 72.500610

# RAcent  DECcent POSerr Theta    Phi  PeakCts   SNR AngSep     Name
#  [deg]    [deg]    ['] [deg]  [deg]                   [']
 83.5559  21.9800    7.4  47.9  139.0  -0.7593  -1.6    4.8	Crab
219.0224  78.9231    2.3  29.8  -19.1   0.5416   4.9 ------	UNKNOWN
226.2797  60.7993    2.2  47.7  -13.1   0.9410   5.2 ------	UNKNOWN
 35.8103  38.3746    1.0  38.1 -156.0   1.4643  11.2 ------	UNKNOWN
246.1223  58.9720    2.2  51.1  -25.6   1.3587   5.2 ------	UNKNOWN
 21.6563  29.6088    2.2  50.6 -145.0   1.5768   5.1 ------	UNKNOWN
  7.2129  40.1727    2.4  45.9 -124.7   1.9771   4.9 ------	UNKNOWN
Post-slew image of 15-350 keV band
Time interval of the image:
131.900600 303.103100

# RAcent  DECcent POSerr Theta    Phi  PeakCts   SNR AngSep     Name
#  [deg]    [deg]    ['] [deg]  [deg]                   [']
 49.0520  18.9865    2.6  22.5  164.9   0.5775   4.4 ------	UNKNOWN
 35.8750  38.3714    0.9   0.0   98.7   1.5166  12.6 ------	UNKNOWN
307.5034  60.7744    2.8  56.4  -16.5   2.1114   4.1 ------	UNKNOWN
328.1237  41.4220    3.6  50.7  -44.4   2.0411   3.2 ------	UNKNOWN
Plot creation:
Sun May 31 14:22:37 EDT 2015