Special notes of this burst
Image
Pre-slew 15.0-350.0 keV image (Event data)
#   RAcent    DECcent   POSerr    Theta     Phi              Peak Cts       SNR   Name
  211.8037    27.6734   0.0046    30.9830   -27.4270         3.7055143     41.568 TRIG_00180241

Foreground time interval of the image:
-24.276  23.613 (delta_t =  47.889 [sec])
Background time interval of the image:
-299.088 -24.276 (delta_t = 274.812 [sec])
Lightcurves
Notes:
- 1) The mask-weighted light curves are using the flight position.
- 2) Multiple plots of different time binning/intervals are shown to cover all scenarios of short/long GRBs, rate/image triggers, and real/false positives.
- 3) For all the mask-weighted lightcurves, the y-axis units are counts/sec/det where a det is 0.4 x 0.4 = 0.16 sq cm.
- 4) The verticle lines correspond to following: green dotted lines are T50 interval, black dotted lines are T90 interval, blue solid line(s) is a spacecraft slew start time, and orange solid line(s) is a spacecraft slew end time.
- 5) Time of each bin is in the middle of the bin.
1 s binning
From T0-310 s to T0+310 s
From T100_start - 20 s to T100_end + 30 s

Full time interval

64 ms binning
Full time interval

From T100_start to T100_end

From T0-5 sec to T0+5 sec
16 ms binning
From T100_start-5 s to T100_start+5 s

8 ms binning
From T100_start-3 s to T100_start+3 s

2 ms binning
From T100_start-1 s to T100_start+1 s
SN=5 or 10 sec. binning (whichever binning is satisfied first)

SN=5 or 10 sec. binning (T < 200 sec)
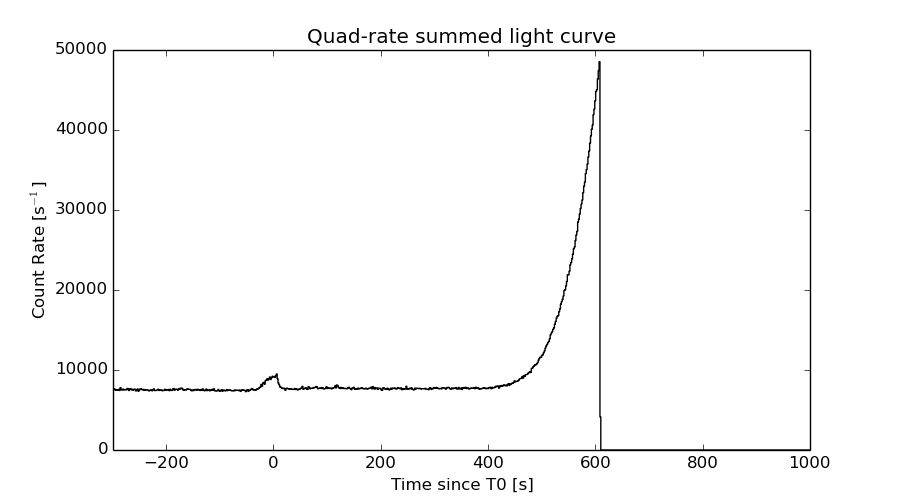
Quad-rate summed light curves (from T0-300s to T0+1000s)
Spectral Evolution

Spectra
Notes:
- 1) The fitting includes the systematic errors.
- 2) When the burst includes telescope slew time periods, the fitting uses an average response file made from multiple 5-s response files through out the slew time plus single time preiod for the non-slew times, and weighted by the total counts in the corresponding time period using addrmf. An average response file is needed becuase a spectral fit using the pre-slew DRM will introduce some errors in both a spectral shape and a normalization if the PHA file contains a lot of the slew/post-slew time interval.
- 3) For fits to more complicated models (e.g. a power-law over a cutoff power-law), the BAT team has decided to require a chi-square improvement of more than 6 for each extra dof.
Time averaged spectrum fit using the average DRM
Power-law model

Time interval is from  -24.276 sec. to  170.716 sec.

Spectral model in power-law:
------------------------------------------------------------
Parameters  : value       lower 90%   higher 90%
Photon index: 1.41628     ( -0.0820848   0.0821192 )
Norm@50keV  : 1.64182E-03    ( -7.63916e-05   7.63351e-05 )
------------------------------------------------------------
#Fit statistic : Chi-Squared =          71.15 using 59 PHA bins.
# Reduced chi-squared =          1.248 for     57 degrees of freedom
# Null hypothesis probability =   9.850769e-02

Photon flux (15-150 keV)    in 195 sec: 0.200694 ( -0.00961192  0.00962707 ) ph/cm2/s
Energy fluence (15-150 keV)             : 3.08342e-06 ( -1.57575e-07  1.58277e-07 ) ergs/cm2
Cutoff power-law model

Time interval is from  -24.276 sec. to  170.716 sec.
Spectral model in the cutoff power-law:
------------------------------------------------------------
Parameters  : value       lower 90%   higher 90%
Photon index: 0.785264     ( -0.391162   0.358075 )
Epeak [keV] : 98.4925      ( -19.9709 60.9845 )
Norm@50keV  : 3.34807E-03    ( -0.00109231   0.00181135 )
------------------------------------------------------------
#Fit statistic : Chi-Squared =          61.55 using 59 PHA bins.
# Reduced chi-squared =          1.099 for     56 degrees of freedom
# Null hypothesis probability =   2.840517e-01

Photon flux (15-150 keV)    in 195 sec: 0.193872 ( -0.010315  0.010315 ) ph/cm2/s
Energy fluence (15-150 keV)             : 2.93301e-06 ( -1.80122e-07  1.80199e-07 ) ergs/cm2
Band function

Time interval is from  -24.276 sec. to  170.716 sec.

Spectral model in the Band function:
------------------------------------------------------------
Parameters  : value       lower 90%   higher 90%
alpha       : -0.409998   ( -0.615658   1.32657 )
beta        : -1.77527    ( 1.7733   0.241211 )
Epeak [keV] : 71.6590      ( -26.9211 54.5793 )
Norm@50keV   : 5.56324E-03    ( -0.00310583   0.036228 )
------------------------------------------------------------
#Fit statistic : Chi-Squared =          59.91 using 59 PHA bins.
# Reduced chi-squared =          1.089 for     55 degrees of freedom
# Null hypothesis probability =   3.022954e-01

Photon flux (15-150 keV)    in 195 sec:  (    ) ph/cm2/s
Energy fluence (15-150 keV)             : 2.94579e-06 ( -2.94442e-06  -1.76728e-07 ) ergs/cm2
Single BB
Spectral model blackbody:
------------------------------------------------------------
Parameters  : value    Lower 90%  Upper 90%
kT [keV]    : 15.7806  (  )
R^2/D10^2   : 1.93501E-02  (   )
(R is the radius in km and D10 is the distance to the source in units of 10 kpc)
------------------------------------------------------------
#Fit statistic : Chi-Squared =         121.21 using 59 PHA bins.
# Reduced chi-squared =         2.1265 for     57 degrees of freedom
# Null hypothesis probability =   1.557826e-06

Energy  Fluence     90% Error
[keV]   [erg/cm2]   [erg/cm2]
15- 25  1.949e-07   1.761e-08
25- 50  8.103e-07   4.641e-08
50-150  1.403e-06   1.155e-07
15-150  2.408e-06   1.414e-07
Thermal bremsstrahlung (OTTB)
Spectral model: thermal bremsstrahlung
------------------------------------------------------------
Parameters  : value         Lower 90%    Upper 90%
kT [keV]    : 200.000       (      )
Norm        : 0.825403       (-0.0385857     0.0385878)
------------------------------------------------------------
#Fit statistic : Chi-Squared =          72.29 using 59 PHA bins.
# Reduced chi-squared =          1.268 for     57 degrees of freedom
# Null hypothesis probability =   8.351559e-02

Energy  Fluence     90% Error
[keV]   [erg/cm2]   [erg/cm2]
15- 25  4.031e-07   2.106e-08
25- 50  7.754e-07   4.056e-08
50-150  1.700e-06   1.097e-07
15-150  2.879e-06   1.628e-07
Double BB

Spectral model: bbodyrad<1> + bbodyrad<2>
------------------------------------------------------------
Parameters  : value         Lower 90%    Upper 90%
kT1 [keV]   : 9.18554        (-2.01617      1.97839)
R1^2/D10^2  : 7.87162E-02        (-0.031062      0.0757875)
kT2 [keV]   : 29.9829        (-7.16456      18.1589)
R2^2/D10^2  : 1.49963E-03    (-0.00116164   0.00274385)
------------------------------------------------------------
#Fit statistic : Chi-Squared =          63.39 using 59 PHA bins.
# Reduced chi-squared =          1.152 for     55 degrees of freedom
# Null hypothesis probability =   2.046618e-01

Energy  Fluence     90% Error
[keV]   [erg/cm2]   [erg/cm2]
15- 25  2.959e-07   4.622e-08
25- 50  8.125e-07   1.336e-07
50-150  1.838e-06   7.187e-07
15-150  2.947e-06   8.674e-07
Peak spectrum fit
Power-law model

Time interval is from    5.044 sec. to    6.044 sec.

Spectral model in power-law:
------------------------------------------------------------
Parameters  : value       lower 90%   higher 90%
Photon index: 1.45085     ( -0.185929   0.189135 )
Norm@50keV  : 1.07697E-02    ( -0.00129208   0.00128259 )
------------------------------------------------------------
#Fit statistic : Chi-Squared =          61.55 using 59 PHA bins.
# Reduced chi-squared =          1.080 for     57 degrees of freedom
# Null hypothesis probability =   3.164019e-01

Photon flux (15-150 keV)    in 1 sec: 1.32750 ( -0.152626  0.152683 ) ph/cm2/s
Energy fluence (15-150 keV)             : 1.03044e-07 ( -1.36408e-08  1.38347e-08 ) ergs/cm2
Cutoff power-law model

Time interval is from    5.044 sec. to    6.044 sec.
Spectral model in the cutoff power-law:
------------------------------------------------------------
Parameters  : value       lower 90%   higher 90%
Photon index: 0.224197     ( -1.16902   0.916995 )
Epeak [keV] : 67.8618      ( -14.682 63.9303 )
Norm@50keV  : 4.83330E-02    ( -0.0483379   0.152495 )
------------------------------------------------------------
#Fit statistic : Chi-Squared =          56.04 using 59 PHA bins.
# Reduced chi-squared =          1.001 for     56 degrees of freedom
# Null hypothesis probability =   4.733908e-01

Photon flux (15-150 keV)    in 1 sec: 1.27393 ( -0.15856  0.15822 ) ph/cm2/s
Energy fluence (15-150 keV)             : 9.29648e-08 ( -1.50459e-08  1.57352e-08 ) ergs/cm2
Band function
Time interval is from    5.044 sec. to    6.044 sec.

Spectral model in the Band function:
------------------------------------------------------------
Parameters  : value       lower 90%   higher 90%
alpha       : 0.552781   ( -2.55866   3.21558 )
beta        : -2.06305    ( 1.99784   0.437062 )
Epeak [keV] : 52.1336      ( -17.3918 47.0896 )
Norm@50keV   : 0.150026    ( -0.156525   55.3243 )
------------------------------------------------------------
#Fit statistic : Chi-Squared =          55.06 using 59 PHA bins.
# Reduced chi-squared =          1.001 for     55 degrees of freedom
# Null hypothesis probability =   4.722396e-01

Photon flux (15-150 keV)    in 1 sec:  (    ) ph/cm2/s
Energy fluence (15-150 keV)             : 9.58591e-08 ( 0  0 ) ergs/cm2
Single BB

Spectral model blackbody:
------------------------------------------------------------
Parameters  : value    Lower 90%  Upper 90%
kT [keV]    : 14.0171  (-1.68857  1.97504)
R^2/D10^2   : 0.201716  (-0.0750355   0.114667)
(R is the radius in km and D10 is the distance to the source in units of 10 kpc)
------------------------------------------------------------
#Fit statistic : Chi-Squared =          61.43 using 59 PHA bins.
# Reduced chi-squared =          1.078 for     57 degrees of freedom
# Null hypothesis probability =   3.204280e-01

Energy  Fluence     90% Error
[keV]   [erg/cm2]   [erg/cm2]
15- 25  8.371e-09   1.817e-09
25- 50  3.117e-08   5.115e-09
50-150  4.035e-08   9.655e-09
15-150  7.990e-08   1.169e-08
Thermal bremsstrahlung (OTTB)

Spectral model: thermal bremsstrahlung
------------------------------------------------------------
Parameters  : value         Lower 90%    Upper 90%
kT [keV]    : 199.363       (-71.2012      -199.363)
Norm        : 5.46946       (-0.622909     0.62291)
------------------------------------------------------------
#Fit statistic : Chi-Squared =          59.71 using 59 PHA bins.
# Reduced chi-squared =          1.047 for     57 degrees of freedom
# Null hypothesis probability =   3.775899e-01

Energy  Fluence     90% Error
[keV]   [erg/cm2]   [erg/cm2]
15- 25  1.362e-08   7.575e-09
25- 50  2.620e-08   1.438e-08
50-150  5.746e-08   3.216e-08
15-150  9.728e-08   5.248e-08
Double BB

------------------------------------------------------------
Parameters  : value         Lower 90%    Upper 90%
kT1 [keV]   : 36.3358        (-5.73609      3.6435)
R1^2/D10^2  : 3.88132E-03        (-0.244558      2.80069)
kT2 [keV]   : 10.6563        (      )
R2^2/D10^2  : 0.404005    (-0.200536   0.315929)
------------------------------------------------------------
#Fit statistic : Chi-Squared =          55.41 using 59 PHA bins.
#Fit statistic : Chi-Squared =          55.38 using 59 PHA bins.
# Reduced chi-squared =          1.007 for     55 degrees of freedom
# Reduced chi-squared =          1.007 for     55 degrees of freedom
# Null hypothesis probability =   4.591006e-01
# Null hypothesis probability =   4.603066e-01

Energy  Fluence     90% Error
[keV]   [erg/cm2]   [erg/cm2]
15- 25  1.039e-08   5.369e-09
25- 50  3.025e-08   1.535e-08
50-150  5.515e-08   2.992e-08
15-150  9.579e-08   4.633e-08
Pre-slew spectrum (Pre-slew PHA with pre-slew DRM)
Power-law model

Spectral model in power-law:
------------------------------------------------------------
Parameters  : value       lower 90%   higher 90%
Photon index: 1.31336     ( -0.0622311   0.0620171 )
Norm@50keV  : 5.23885E-03    ( -0.000184055   0.000184055 )
------------------------------------------------------------
#Fit statistic : Chi-Squared =          80.24 using 59 PHA bins.
# Reduced chi-squared =          1.408 for     57 degrees of freedom
# Null hypothesis probability =   2.295864e-02

Photon flux (15-150 keV)    in 47.89 sec: 0.626573 ( -0.0231888  0.0232255 ) ph/cm2/s
Energy fluence (15-150 keV)             : 2.47124e-06 ( -9.41685e-08  9.4407e-08 ) ergs/cm2
Cutoff power-law model

Spectral model in the cutoff power-law:
------------------------------------------------------------
Parameters  : value       lower 90%   higher 90%
Photon index: 0.734187     ( -0.279323   0.262313 )
Epeak [keV] : 117.219      ( -21.8268 51.63 )
Norm@50keV  : 9.82001E-03    ( -0.00237303   0.00336176 )
------------------------------------------------------------
#Fit statistic : Chi-Squared =          64.98 using 59 PHA bins.
# Reduced chi-squared =          1.160 for     56 degrees of freedom
# Null hypothesis probability =   1.924201e-01

Photon flux (15-150 keV)    in 47.89 sec: 0.607379 ( -0.024595  0.024622 ) ph/cm2/s
Energy fluence (15-150 keV)             : 2.37782e-06 ( -1.04616e-07  1.04199e-07 ) ergs/cm2
Band function

Spectral model in the Band function:
------------------------------------------------------------
Parameters  : value       lower 90%   higher 90%
alpha       : 0.220106   ( -0.99364   2.92814 )
beta        : -1.53451    ( -0.465855   0.137709 )
Epeak [keV] : 57.5236      ( -22.0165 60.896 )
Norm@50keV   : 3.88528E-02    ( -0.039444   5.40827 )
------------------------------------------------------------
#Fit statistic : Chi-Squared =          62.09 using 59 PHA bins.
# Reduced chi-squared =          1.129 for     55 degrees of freedom
# Null hypothesis probability =   2.383568e-01

Photon flux (15-150 keV)    in 47.89 sec:  (    ) ph/cm2/s
Energy fluence (15-150 keV)             : 2.39146e-06 ( -2.39112e-06  -1.02025e-07 ) ergs/cm2
S(25-50 keV) vs. S(50-100 keV) plot

S(25-50 keV)  = 7.31e-07
S(50-100 keV) = 1.10e-06
T90 vs. Hardness ratio plot

T90                                   = 139.463999986649 sec.
Hardness ratio (energy fluence ratio) = 1.50479
Color vs. Color plot

Count Ratio  (25-50 keV) / (15-25 keV) = 1.54984
Count Ratio (50-100 keV) / (15-25 keV) = 1.21408
Mask shadow pattern

IMX = 5.329645474828859E-01, IMY = 2.765809152646098E-01
TIME vs. PHA plot around the trigger time
TIME vs. DetID plot around the trigger time

100 us light curve (15-350 keV)
Spacecraft aspect plot

Bright source in the pre-burst/pre-slew/post-slew images
Pre-burst image of 15-350 keV band
Time interval of the image:
-299.088000 -24.276000

# RAcent  DECcent POSerr Theta    Phi  PeakCts   SNR AngSep     Name
#  [deg]    [deg]    ['] [deg]  [deg]                   [']
185.7949  10.2845    2.3  35.6   28.2   1.2510   4.9 ------	UNKNOWN
233.2798  24.8777    3.1  47.3  -44.5   2.5051   3.8 ------	UNKNOWN
Pre-slew background subtracted image of 15-350 keV band
Time interval of the image:
-24.276000 23.612600

# RAcent  DECcent POSerr Theta    Phi  PeakCts   SNR AngSep     Name
#  [deg]    [deg]    ['] [deg]  [deg]                   [']
190.6266  40.4964    2.5   9.4  -23.1   0.3108   4.6 ------	UNKNOWN
211.8037  27.6734    0.3  31.0  -27.4   3.7054  41.6 ------	UNKNOWN
225.9102  41.8972    2.4  33.1  -62.1   0.5695   4.8 ------	UNKNOWN
Post-slew image of 15-350 keV band
Time interval of the image:
82.612590 303.002700

# RAcent  DECcent POSerr Theta    Phi  PeakCts   SNR AngSep     Name
#  [deg]    [deg]    ['] [deg]  [deg]                   [']
254.4246  35.3439   12.8  36.9 -120.3   0.2530   0.9    1.6	Her X-1
186.1506  29.3408    2.3  22.5   93.0   0.9344   5.0 ------	UNKNOWN
238.1830  55.5194    2.6  33.7 -160.4   0.7367   4.4 ------	UNKNOWN
Plot creation:
Sun May 31 14:19:42 EDT 2015