Special notes of this burst
Image
Pre-slew 15.0-350.0 keV image (Event data)

#   RAcent    DECcent   POSerr    Theta     Phi              Peak Cts       SNR   Name
  202.9263    35.0487   0.0041    10.5637   135.2489         1.5969903     46.758 TRIG_00180455

Foreground time interval of the image:
 -0.552  12.029 (delta_t =  12.581 [sec])
Background time interval of the image:
-299.272  -0.552 (delta_t = 298.720 [sec])
Lightcurves
Notes:
- 1) The mask-weighted light curves are using the flight position.
- 2) Multiple plots of different time binning/intervals are shown to cover all scenarios of short/long GRBs, rate/image triggers, and real/false positives.
- 3) For all the mask-weighted lightcurves, the y-axis units are counts/sec/det where a det is 0.4 x 0.4 = 0.16 sq cm.
- 4) The verticle lines correspond to following: green dotted lines are T50 interval, black dotted lines are T90 interval, blue solid line(s) is a spacecraft slew start time, and orange solid line(s) is a spacecraft slew end time.
- 5) Time of each bin is in the middle of the bin.
1 s binning
From T0-310 s to T0+310 s

From T100_start - 20 s to T100_end + 30 s

Full time interval

64 ms binning
Full time interval

From T100_start to T100_end

From T0-5 sec to T0+5 sec

16 ms binning
From T100_start-5 s to T100_start+5 s

Blue+Cyan dotted lines: Time interval of the scaled map
From 0.000000 to 0.512000
8 ms binning
From T100_start-3 s to T100_start+3 s

Blue+Cyan dotted lines: Time interval of the scaled map
From 0.000000 to 0.512000
2 ms binning
From T100_start-1 s to T100_start+1 s

Blue+Cyan dotted lines: Time interval of the scaled map
From 0.000000 to 0.512000
SN=5 or 10 sec. binning (whichever binning is satisfied first)

SN=5 or 10 sec. binning (T < 200 sec)

Quad-rate summed light curves (from T0-300s to T0+1000s)

Spectral Evolution

Spectra
Notes:
- 1) The fitting includes the systematic errors.
- 2) When the burst includes telescope slew time periods, the fitting uses an average response file made from multiple 5-s response files through out the slew time plus single time preiod for the non-slew times, and weighted by the total counts in the corresponding time period using addrmf. An average response file is needed becuase a spectral fit using the pre-slew DRM will introduce some errors in both a spectral shape and a normalization if the PHA file contains a lot of the slew/post-slew time interval.
- 3) For fits to more complicated models (e.g. a power-law over a cutoff power-law), the BAT team has decided to require a chi-square improvement of more than 6 for each extra dof.
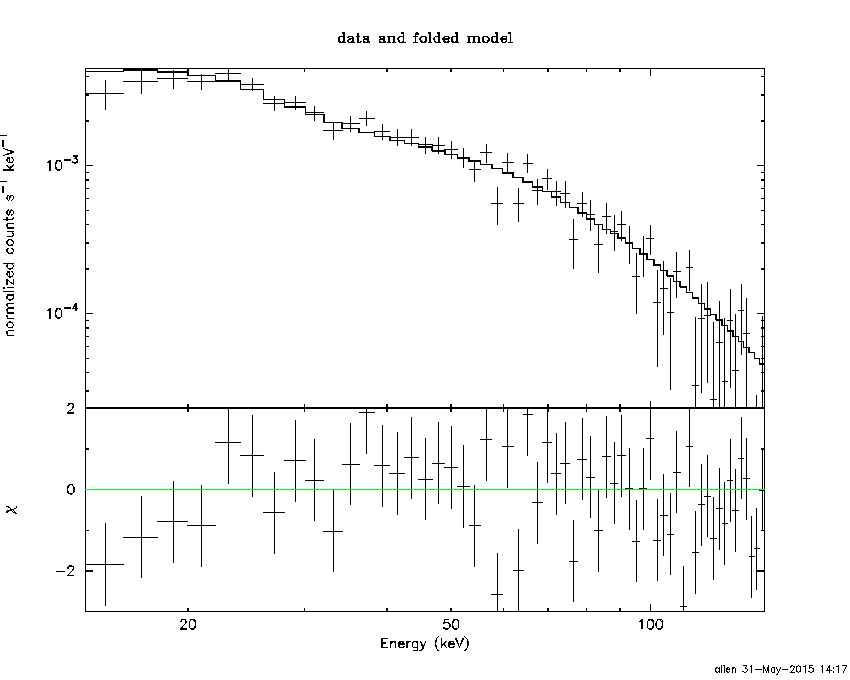
Time averaged spectrum fit using the average DRM
Power-law model

Time interval is from   -0.552 sec. to   13.704 sec.

Spectral model in power-law:
------------------------------------------------------------
Parameters  : value       lower 90%   higher 90%
Photon index: 1.65649     ( -0.0730523   0.0735936 )
Norm@50keV  : 6.64726E-03    ( -0.000277337   0.00027649 )
------------------------------------------------------------
#Fit statistic : Chi-Squared =          68.38 using 59 PHA bins.
# Reduced chi-squared =          1.200 for     57 degrees of freedom
# Null hypothesis probability =   1.437842e-01

Photon flux (15-150 keV)    in 14.26 sec: 0.869835 ( -0.0361648  0.0362259 ) ph/cm2/s
Energy fluence (15-150 keV)             : 8.81017e-07 ( -3.89264e-08  3.90992e-08 ) ergs/cm2
Cutoff power-law model

Time interval is from   -0.552 sec. to   13.704 sec.
Spectral model in the cutoff power-law:
------------------------------------------------------------
Parameters  : value       lower 90%   higher 90%
Photon index: 1.11960     ( -0.317429   0.295842 )
Epeak [keV] : 80.7440      ( -13.9887 38.8297 )
Norm@50keV  : 1.24180E-02    ( -0.00353821   0.00541264 )
------------------------------------------------------------
#Fit statistic : Chi-Squared =          58.21 using 59 PHA bins.
# Reduced chi-squared =          1.039 for     56 degrees of freedom
# Null hypothesis probability =   3.940565e-01

Photon flux (15-150 keV)    in 14.26 sec: 0.842387 ( -0.038856  0.038909 ) ph/cm2/s
Energy fluence (15-150 keV)             : 8.42632e-07 ( -4.41276e-08  4.42345e-08 ) ergs/cm2
Band function

Time interval is from   -0.552 sec. to   13.704 sec.

Spectral model in the Band function:
------------------------------------------------------------
Parameters  : value       lower 90%   higher 90%
alpha       : -1.11958   ( -0.302523   0.296102 )
beta        : -10.0000    ( 10   1.77636e-15 )
Epeak [keV] : 80.7294      ( -13.9811 38.823 )
Norm@50keV   : 1.24171E-02    ( -0.00354036   0.00541229 )
------------------------------------------------------------
#Fit statistic : Chi-Squared =          58.21 using 59 PHA bins.
# Reduced chi-squared =          1.058 for     55 degrees of freedom
# Null hypothesis probability =   3.581525e-01

Photon flux (15-150 keV)    in 14.26 sec: 0.840338 ( 6.15966  -0.03625 ) ph/cm2/s
Energy fluence (15-150 keV)             : 8.50757e-07 ( -8.50657e-07  -4.33918e-08 ) ergs/cm2
Single BB

Spectral model blackbody:
------------------------------------------------------------
Parameters  : value    Lower 90%  Upper 90%
kT [keV]    : 13.8132  (  )
R^2/D10^2   : 0.125449  (   )
(R is the radius in km and D10 is the distance to the source in units of 10 kpc)
------------------------------------------------------------
#Fit statistic : Chi-Squared =         169.81 using 59 PHA bins.
# Reduced chi-squared =         2.9791 for     57 degrees of freedom
# Null hypothesis probability =   3.798307e-13

Energy  Fluence     90% Error
[keV]   [erg/cm2]   [erg/cm2]
15- 25  7.219e-08   5.540e-09
25- 50  2.649e-07   1.241e-08
50-150  3.305e-07   2.823e-08
15-150  6.676e-07   3.194e-08
Thermal bremsstrahlung (OTTB)

Spectral model: thermal bremsstrahlung
------------------------------------------------------------
Parameters  : value         Lower 90%    Upper 90%
kT [keV]    : 145.122       (      )
Norm        : 3.60050       (-0.181285     0.183299)
------------------------------------------------------------
#Fit statistic : Chi-Squared =          58.91 using 59 PHA bins.
# Reduced chi-squared =          1.034 for     57 degrees of freedom
# Null hypothesis probability =   4.053444e-01

Energy  Fluence     90% Error
[keV]   [erg/cm2]   [erg/cm2]
15- 25  1.298e-07   8.556e-09
25- 50  2.411e-07   2.053e-08
50-150  4.794e-07   1.372e-07
15-150  8.503e-07   1.479e-07
Double BB

Spectral model: bbodyrad<1> + bbodyrad<2>
------------------------------------------------------------
Parameters  : value         Lower 90%    Upper 90%
kT1 [keV]   : 6.79082        (-0.928241      1.00309)
R1^2/D10^2  : 1.00493        (-0.36939      0.679068)
kT2 [keV]   : 23.0122        (-2.71913      3.76459)
R2^2/D10^2  : 1.52975E-02    (-0.00678789   0.0098762)
------------------------------------------------------------
#Fit statistic : Chi-Squared =          55.42 using 59 PHA bins.
# Reduced chi-squared =          1.008 for     55 degrees of freedom
# Null hypothesis probability =   4.587337e-01

Energy  Fluence     90% Error
[keV]   [erg/cm2]   [erg/cm2]
15- 25  1.237e-07   1.949e-08
25- 50  2.462e-07   2.538e-08
50-150  4.690e-07   7.807e-08
15-150  8.388e-07   1.037e-07
Peak spectrum fit
Power-law model

Time interval is from    2.188 sec. to    3.188 sec.

Spectral model in power-law:
------------------------------------------------------------
Parameters  : value       lower 90%   higher 90%
Photon index: 1.57464     ( -0.0910211   0.0919445 )
Norm@50keV  : 2.24099E-02    ( -0.00124625   0.00124175 )
------------------------------------------------------------
#Fit statistic : Chi-Squared =          67.03 using 59 PHA bins.
# Reduced chi-squared =          1.176 for     57 degrees of freedom
# Null hypothesis probability =   1.707433e-01

Photon flux (15-150 keV)    in 1 sec: 2.85761 ( -0.155816  0.155964 ) ph/cm2/s
Energy fluence (15-150 keV)             : 2.10257e-07 ( -1.25888e-08  1.2651e-08 ) ergs/cm2
Cutoff power-law model

Time interval is from    2.188 sec. to    3.188 sec.
Spectral model in the cutoff power-law:
------------------------------------------------------------
Parameters  : value       lower 90%   higher 90%
Photon index: 0.908685     ( -0.403668   0.368718 )
Epeak [keV] : 81.7644      ( -14.661 39.9821 )
Norm@50keV  : 4.87048E-02    ( -0.0166469   0.0282783 )
------------------------------------------------------------
#Fit statistic : Chi-Squared =          56.81 using 59 PHA bins.
# Reduced chi-squared =          1.014 for     56 degrees of freedom
# Null hypothesis probability =   4.446123e-01

Photon flux (15-150 keV)    in 1 sec: 2.77708 ( -0.16183  0.16181 ) ph/cm2/s
Energy fluence (15-150 keV)             : 2.01235e-07 ( -1.3602e-08  1.3646e-08 ) ergs/cm2
Band function

Time interval is from    2.188 sec. to    3.188 sec.

Spectral model in the Band function:
------------------------------------------------------------
Parameters  : value       lower 90%   higher 90%
alpha       : -0.908621   ( -0.272336   0.54862 )
beta        : -10.0000    ( 10   7.10543e-15 )
Epeak [keV] : 81.7476      ( -14.6527 39.9797 )
Norm@50keV   : 4.87055E-02    ( -0.0166446   0.028299 )
------------------------------------------------------------
#Fit statistic : Chi-Squared =          56.81 using 59 PHA bins.
# Reduced chi-squared =          1.033 for     55 degrees of freedom
# Null hypothesis probability =   4.073668e-01

Photon flux (15-150 keV)    in 1 sec: 2.78241 ( 4.21759  -0.16572 ) ph/cm2/s
Energy fluence (15-150 keV)             : 2.01143e-07 ( -2.01136e-07  -1.3641e-08 ) ergs/cm2
Single BB

Spectral model blackbody:
------------------------------------------------------------
Parameters  : value    Lower 90%  Upper 90%
kT [keV]    : 14.6052  (  )
R^2/D10^2   : 0.355200  (   )
(R is the radius in km and D10 is the distance to the source in units of 10 kpc)
------------------------------------------------------------
#Fit statistic : Chi-Squared =         117.46 using 59 PHA bins.
# Reduced chi-squared =         2.0606 for     57 degrees of freedom
# Null hypothesis probability =   4.393056e-06

Energy  Fluence     90% Error
[keV]   [erg/cm2]   [erg/cm2]
15- 25  1.593e-08   1.605e-09
25- 50  6.172e-08   4.315e-09
50-150  8.852e-08   9.625e-09
15-150  1.662e-07   1.100e-08
Thermal bremsstrahlung (OTTB)

Spectral model: thermal bremsstrahlung
------------------------------------------------------------
Parameters  : value         Lower 90%    Upper 90%
kT [keV]    : 184.225       (-45.0815      -183.311)
Norm        : 11.7042       (-0.657155     0.719703)
------------------------------------------------------------
#Fit statistic : Chi-Squared =          59.37 using 59 PHA bins.
# Reduced chi-squared =          1.042 for     57 degrees of freedom
# Null hypothesis probability =   3.892909e-01

Energy  Fluence     90% Error
[keV]   [erg/cm2]   [erg/cm2]
15- 25  2.943e-08   2.245e-09
25- 50  5.609e-08   1.052e-08
50-150  1.197e-07   4.338e-08
15-150  2.053e-07   5.025e-08
Double BB

Spectral model: bbodyrad<1> + bbodyrad<2>
------------------------------------------------------------
Parameters  : value         Lower 90%    Upper 90%
kT1 [keV]   : 6.06021        (-1.13644      1.38266)
R1^2/D10^2  : 4.43581        (-2.23038      5.20559)
kT2 [keV]   : 21.3881        (-2.57392      3.65341)
R2^2/D10^2  : 7.46950E-02    (-0.0346984   0.0489532)
------------------------------------------------------------
#Fit statistic : Chi-Squared =          54.08 using 59 PHA bins.
# Reduced chi-squared =         0.9833 for     55 degrees of freedom
# Null hypothesis probability =   5.097850e-01

Energy  Fluence     90% Error
[keV]   [erg/cm2]   [erg/cm2]
15- 25  2.836e-08   7.350e-09
25- 50  5.567e-08   7.525e-09
50-150  1.158e-07   2.256e-08
15-150  1.998e-07   3.840e-08
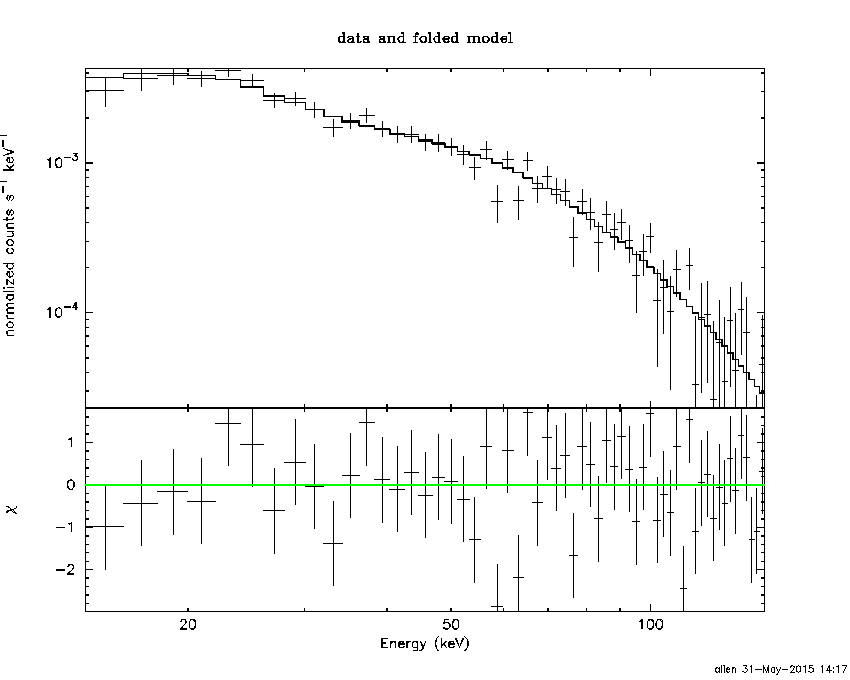
Pre-slew spectrum (Pre-slew PHA with pre-slew DRM)
Power-law model
Spectral model in power-law:
------------------------------------------------------------
Parameters  : value       lower 90%   higher 90%
Photon index: 1.66988     ( -0.0708403   0.0713515 )
Norm@50keV  : 7.46758E-03    ( -0.000301092   0.000300186 )
------------------------------------------------------------
#Fit statistic : Chi-Squared =          68.38 using 59 PHA bins.
# Reduced chi-squared =          1.200 for     57 degrees of freedom
# Null hypothesis probability =   1.436841e-01

Photon flux (15-150 keV)    in 12.58 sec: 0.981569 ( -0.039543  0.0396139 ) ph/cm2/s
Energy fluence (15-150 keV)             : 8.72031e-07 ( -3.71016e-08  3.72558e-08 ) ergs/cm2
Cutoff power-law model

Spectral model in the cutoff power-law:
------------------------------------------------------------
Parameters  : value       lower 90%   higher 90%
Photon index: 1.17505     ( -0.306215   0.285941 )
Epeak [keV] : 81.8963      ( -14.7893 44.539 )
Norm@50keV  : 1.33003E-02    ( -0.00368931   0.00557069 )
------------------------------------------------------------
#Fit statistic : Chi-Squared =          59.21 using 59 PHA bins.
# Reduced chi-squared =          1.057 for     56 degrees of freedom
# Null hypothesis probability =   3.593539e-01

Photon flux (15-150 keV)    in 12.58 sec: 0.952751 ( -0.042548  0.0426 ) ph/cm2/s
Energy fluence (15-150 keV)             : 8.36622e-07 ( -4.22826e-08  4.23355e-08 ) ergs/cm2
Band function
Spectral model in the Band function:
------------------------------------------------------------
Parameters  : value       lower 90%   higher 90%
alpha       : -1.17503   ( -0.238028   0.344586 )
beta        : -10.0000    ( 10   0 )
Epeak [keV] : 81.8809      ( -11.5797 44.441 )
Norm@50keV   : 1.32992E-02    ( -0.00369112   0.00557009 )
------------------------------------------------------------
#Fit statistic : Chi-Squared =          59.21 using 59 PHA bins.
# Reduced chi-squared =          1.076 for     55 degrees of freedom
# Null hypothesis probability =   3.247191e-01

Photon flux (15-150 keV)    in 12.58 sec: 0.956275 (    ) ph/cm2/s
Energy fluence (15-150 keV)             : 8.43498e-07 ( -8.4341e-07  -4.10901e-08 ) ergs/cm2
S(25-50 keV) vs. S(50-100 keV) plot

S(25-50 keV)  = 2.34e-07
S(50-100 keV) = 2.97e-07
T90 vs. Hardness ratio plot

T90                                   = 7.55199998617172 sec.
Hardness ratio (energy fluence ratio) = 1.26923
Color vs. Color plot

Count Ratio  (25-50 keV) / (15-25 keV) = 1.27172
Count Ratio (50-100 keV) / (15-25 keV) = 0.831391
Mask shadow pattern

IMX = -1.324393011074071E-01, IMY = -1.312938220606079E-01
TIME vs. PHA plot around the trigger time

Blue+Cyan dotted lines: Time interval of the scaled map
From 0.000000 to 0.512000
TIME vs. DetID plot around the trigger time

Blue+Cyan dotted lines: Time interval of the scaled map
From 0.000000 to 0.512000
100 us light curve (15-350 keV)

Blue+Cyan dotted lines: Time interval of the scaled map
From 0.000000 to 0.512000
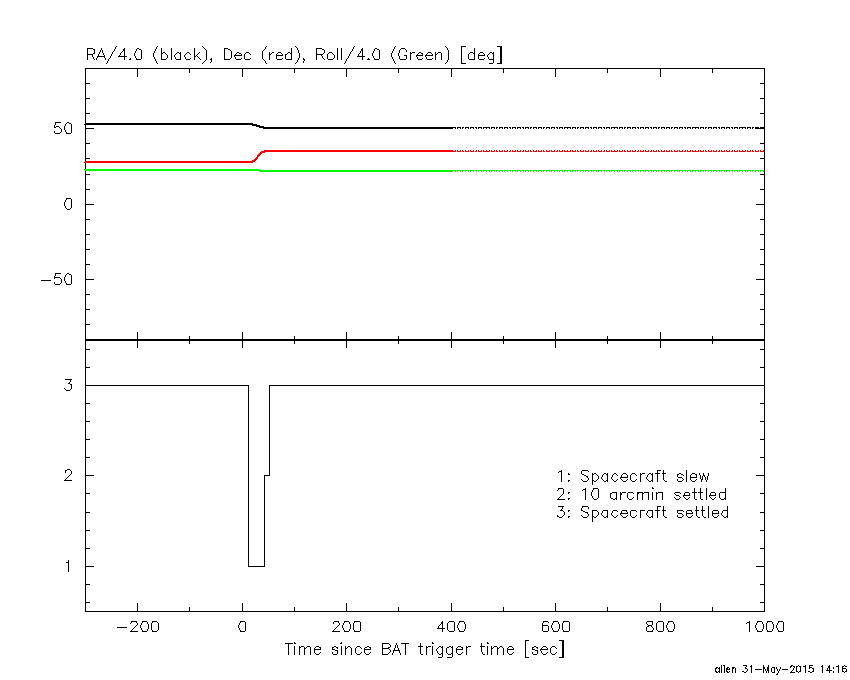
Spacecraft aspect plot
Bright source in the pre-burst/pre-slew/post-slew images
Pre-burst image of 15-350 keV band
Time interval of the image:
-299.272000 -0.552000

# RAcent  DECcent POSerr Theta    Phi  PeakCts   SNR AngSep     Name
#  [deg]    [deg]    ['] [deg]  [deg]                   [']
254.4658  35.4832    6.0  36.9 -114.5   0.7247   1.9    8.5	Her X-1
184.3975  21.9940    2.2  25.4   81.9   1.2385   5.3 ------	UNKNOWN
168.1591  66.2678    2.5  46.9  156.3   2.3262   4.6 ------	UNKNOWN
195.4492  61.4398    2.1  35.5  165.3   1.3211   5.5 ------	UNKNOWN
266.9563  76.9512    2.5  55.5 -168.4   3.0460   4.6 ------	UNKNOWN
Pre-slew background subtracted image of 15-350 keV band
Time interval of the image:
-0.552000 12.028590

# RAcent  DECcent POSerr Theta    Phi  PeakCts   SNR AngSep     Name
#  [deg]    [deg]    ['] [deg]  [deg]                   [']
254.5612  35.1501    0.0  37.0 -114.0  -0.0959  -1.3   12.6	Her X-1
202.9263  35.0487    0.2  10.6  135.2   1.5970  46.8 ------	UNKNOWN
257.5195  25.0380    2.1  40.8  -98.5   0.8224   5.4 ------	UNKNOWN
Post-slew image of 15-350 keV band
Time interval of the image:
42.028590 302.768000

# RAcent  DECcent POSerr Theta    Phi  PeakCts   SNR AngSep     Name
#  [deg]    [deg]    ['] [deg]  [deg]                   [']
254.3311  35.2731   16.1  41.5 -103.9  -2.8887  -0.7    7.5	Her X-1
173.8383   6.3951    2.2  39.2   51.8  10.7148   5.2 ------	UNKNOWN
214.2829 -21.7469    2.4  57.8  -10.6  25.9647   4.8 ------	UNKNOWN
Plot creation:
Sun May 31 14:18:04 EDT 2015