Special notes of this burst
Image
Pre-slew 15.0-350.0 keV image (Event data)

#   RAcent    DECcent   POSerr    Theta     Phi              Peak Cts       SNR   Name
   57.7255    27.0168   0.0067    44.1510   178.6306         3.1474948     28.979 TRIG_00180977

Foreground time interval of the image:
-21.115  15.485 (delta_t =  36.600 [sec])
Background time interval of the image:
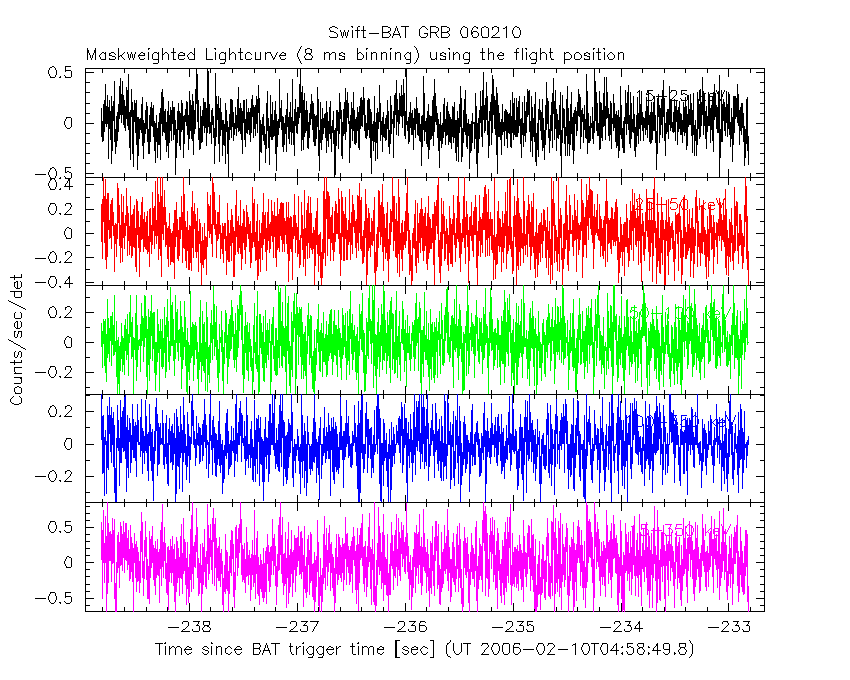
Lightcurves
Notes:
- 1) The mask-weighted light curves are using the flight position.
- 2) Multiple plots of different time binning/intervals are shown to cover all scenarios of short/long GRBs, rate/image triggers, and real/false positives.
- 3) For all the mask-weighted lightcurves, the y-axis units are counts/sec/det where a det is 0.4 x 0.4 = 0.16 sq cm.
- 4) The verticle lines correspond to following: green dotted lines are T50 interval, black dotted lines are T90 interval, blue solid line(s) is a spacecraft slew start time, and orange solid line(s) is a spacecraft slew end time.
- 5) Time of each bin is in the middle of the bin.
1 s binning
From T0-310 s to T0+310 s

From T100_start - 20 s to T100_end + 30 s

Full time interval

64 ms binning
Full time interval

From T100_start to T100_end

From T0-5 sec to T0+5 sec

16 ms binning
From T100_start-5 s to T100_start+5 s

Blue+Cyan dotted lines: Time interval of the scaled map
From 0.000000 to 1.024000
8 ms binning
From T100_start-3 s to T100_start+3 s
Blue+Cyan dotted lines: Time interval of the scaled map
From 0.000000 to 1.024000
2 ms binning
From T100_start-1 s to T100_start+1 s

Blue+Cyan dotted lines: Time interval of the scaled map
From 0.000000 to 1.024000
SN=5 or 10 sec. binning (whichever binning is satisfied first)

SN=5 or 10 sec. binning (T < 200 sec)

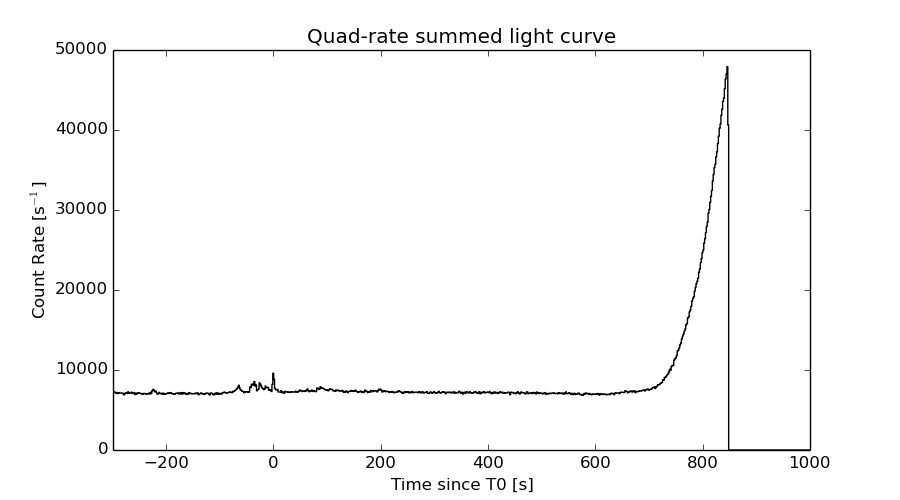
Quad-rate summed light curves (from T0-300s to T0+1000s)
Spectral Evolution

Spectra
Notes:
- 1) The fitting includes the systematic errors.
- 2) When the burst includes telescope slew time periods, the fitting uses an average response file made from multiple 5-s response files through out the slew time plus single time preiod for the non-slew times, and weighted by the total counts in the corresponding time period using addrmf. An average response file is needed becuase a spectral fit using the pre-slew DRM will introduce some errors in both a spectral shape and a normalization if the PHA file contains a lot of the slew/post-slew time interval.
- 3) For fits to more complicated models (e.g. a power-law over a cutoff power-law), the BAT team has decided to require a chi-square improvement of more than 6 for each extra dof.
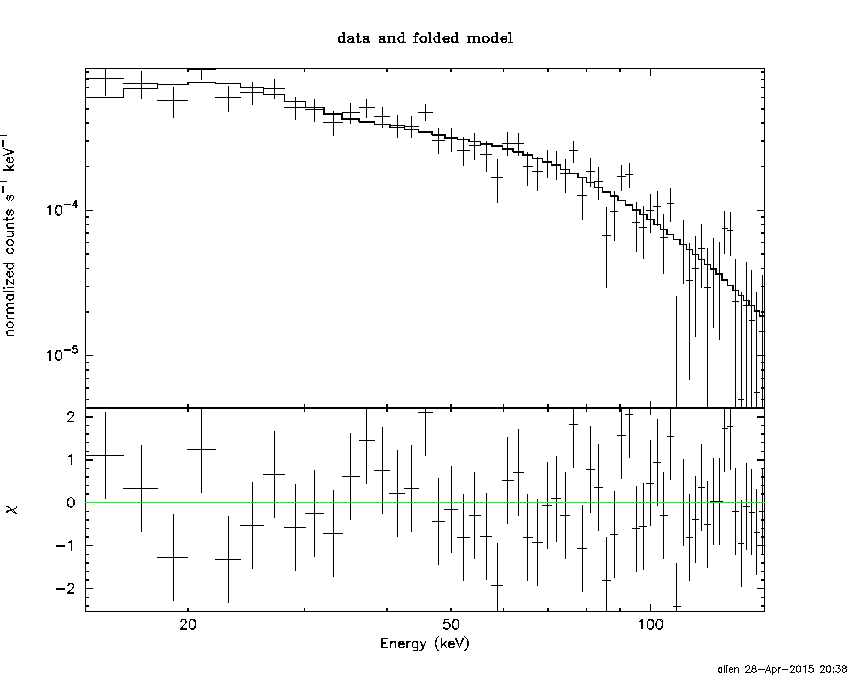
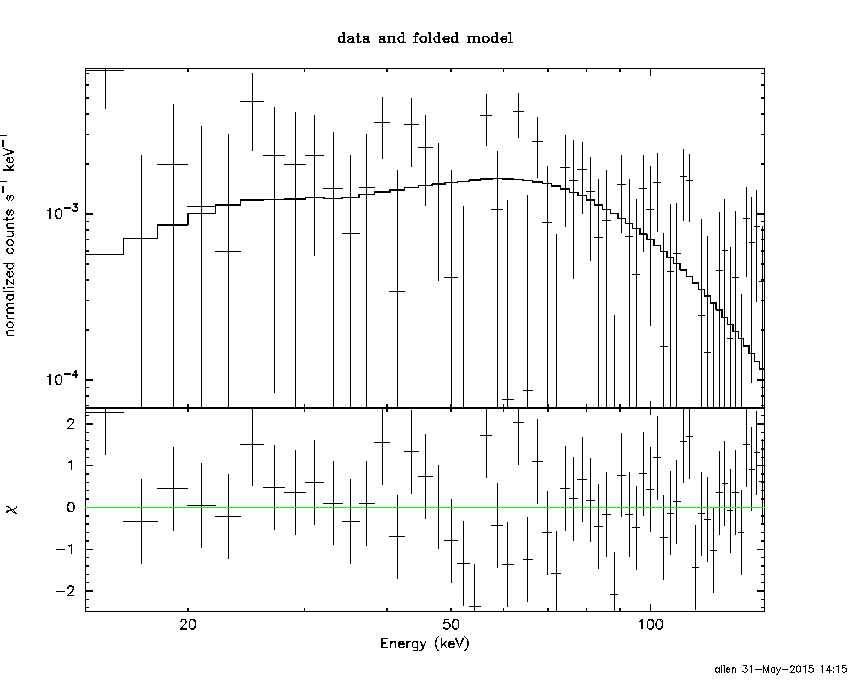
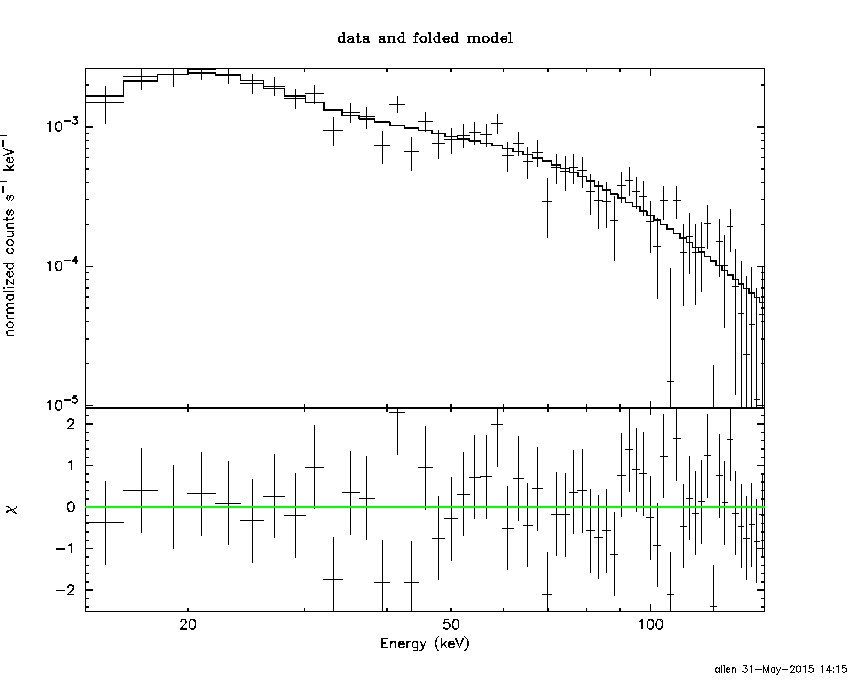
Time averaged spectrum fit using the average DRM
Power-law model

Time interval is from -235.816 sec. to  132.184 sec.

Spectral model in power-law:
------------------------------------------------------------
Parameters  : value       lower 90%   higher 90%
Photon index: 1.48280     ( -0.0904218   0.0903864 )
Norm@50keV  : 2.19363E-03    ( -0.000111705   0.000111694 )
------------------------------------------------------------
#Fit statistic : Chi-Squared =          59.70 using 59 PHA bins.
# Reduced chi-squared =          1.047 for     57 degrees of freedom
# Null hypothesis probability =   3.779412e-01

Photon flux (15-150 keV)    in 368 sec: 0.272604 ( -0.0150885  0.0151405 ) ph/cm2/s
Energy fluence (15-150 keV)             : 7.68005e-06 ( -4.11744e-07  4.12502e-07 ) ergs/cm2
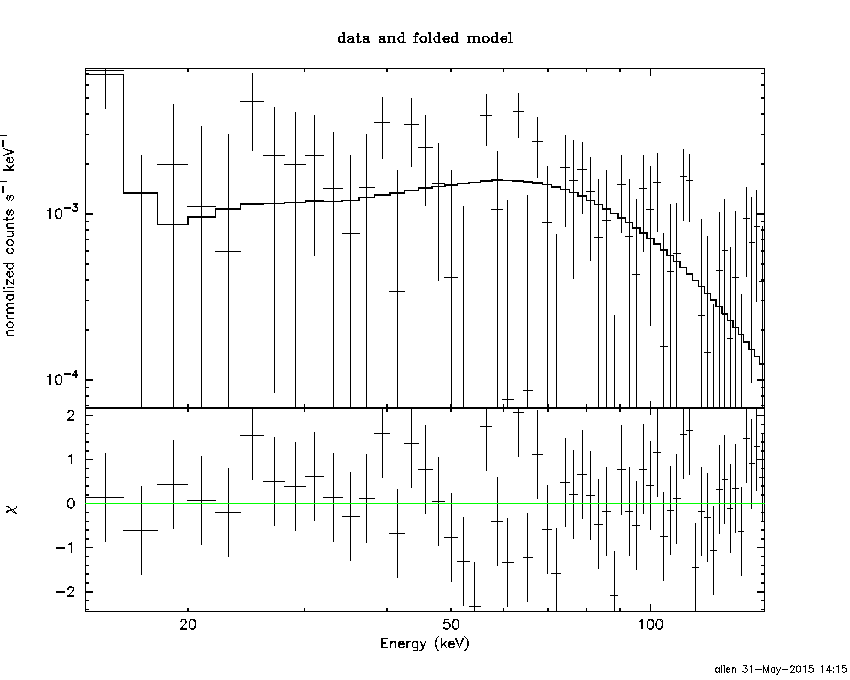
Cutoff power-law model
Time interval is from -235.816 sec. to  132.184 sec.
Spectral model in the cutoff power-law:
------------------------------------------------------------
Parameters  : value       lower 90%   higher 90%
Photon index: 1.18599     ( -0.38423   0.331217 )
Epeak [keV] : 150.080      ( -58.6749 -150.08 )
Norm@50keV  : 3.01663E-03    ( -0.000872135   0.00148979 )
------------------------------------------------------------
#Fit statistic : Chi-Squared =          57.69 using 59 PHA bins.
# Reduced chi-squared =          1.030 for     56 degrees of freedom
# Null hypothesis probability =   4.126975e-01

Photon flux (15-150 keV)    in 368 sec: 0.268027 ( -0.01597  0.016049 ) ph/cm2/s
Energy fluence (15-150 keV)             : 7.56656e-06 ( -4.39686e-07  4.37258e-07 ) ergs/cm2
Band function

Time interval is from -235.816 sec. to  132.184 sec.

Spectral model in the Band function:
------------------------------------------------------------
Parameters  : value       lower 90%   higher 90%
alpha       : -0.788969   ( 0.85747   4.17533 )
beta        : -1.61040    ( 1.60867   0.160365 )
Epeak [keV] : 73.5050      ( -73.9129 585.321 )
Norm@50keV   : 5.26574E-03    ( -0.00317774   0 )
------------------------------------------------------------
#Fit statistic : Chi-Squared =          57.35 using 59 PHA bins.
# Reduced chi-squared =          1.043 for     55 degrees of freedom
# Null hypothesis probability =   3.879357e-01

Photon flux (15-150 keV)    in 368 sec: 0.266164 (    ) ph/cm2/s
Energy fluence (15-150 keV)             : 0 ( 0  0 ) ergs/cm2
Single BB

Spectral model blackbody:
------------------------------------------------------------
Parameters  : value    Lower 90%  Upper 90%
kT [keV]    : 16.7705  (  )
R^2/D10^2   : 2.08290E-02  (   )
(R is the radius in km and D10 is the distance to the source in units of 10 kpc)
------------------------------------------------------------
#Fit statistic : Chi-Squared =         137.27 using 59 PHA bins.
# Reduced chi-squared =         2.4083 for     57 degrees of freedom
# Null hypothesis probability =   1.426660e-08

Energy  Fluence     90% Error
[keV]   [erg/cm2]   [erg/cm2]
15- 25  4.407e-07   4.508e-08
25- 50  1.929e-06   1.417e-07
50-150  3.856e-06   3.338e-07
15-150  6.225e-06   3.882e-07
Thermal bremsstrahlung (OTTB)

Spectral model: thermal bremsstrahlung
------------------------------------------------------------
Parameters  : value         Lower 90%    Upper 90%
kT [keV]    : 200.000       (      )
Norm        : 1.12741       (-0.0574183     0.0574146)
------------------------------------------------------------
#Fit statistic : Chi-Squared =          60.98 using 59 PHA bins.
# Reduced chi-squared =          1.070 for     57 degrees of freedom
# Null hypothesis probability =   3.347932e-01

Energy  Fluence     90% Error
[keV]   [erg/cm2]   [erg/cm2]
15- 25  1.033e-06   6.017e-08
25- 50  1.987e-06   1.205e-07
50-150  4.359e-06   3.183e-07
15-150  7.380e-06   4.416e-07
Double BB
Spectral model: bbodyrad<1> + bbodyrad<2>
------------------------------------------------------------
Parameters  : value         Lower 90%    Upper 90%
kT1 [keV]   : 8.25404        (-1.43676      1.53226)
R1^2/D10^2  : 0.156030        (-0.0639172      0.135105)
kT2 [keV]   : 29.9424        (-5.15728      8.98199)
R2^2/D10^2  : 2.13801E-03    (-0.00126343   0.00216767)
------------------------------------------------------------
#Fit statistic : Chi-Squared =          59.45 using 59 PHA bins.
# Reduced chi-squared =          1.081 for     55 degrees of freedom
# Null hypothesis probability =   3.167817e-01

Energy  Fluence     90% Error
[keV]   [erg/cm2]   [erg/cm2]
15- 25  8.338e-07   1.754e-07
25- 50  2.017e-06   3.091e-07
50-150  4.705e-06   1.292e-06
15-150  7.555e-06   1.419e-06
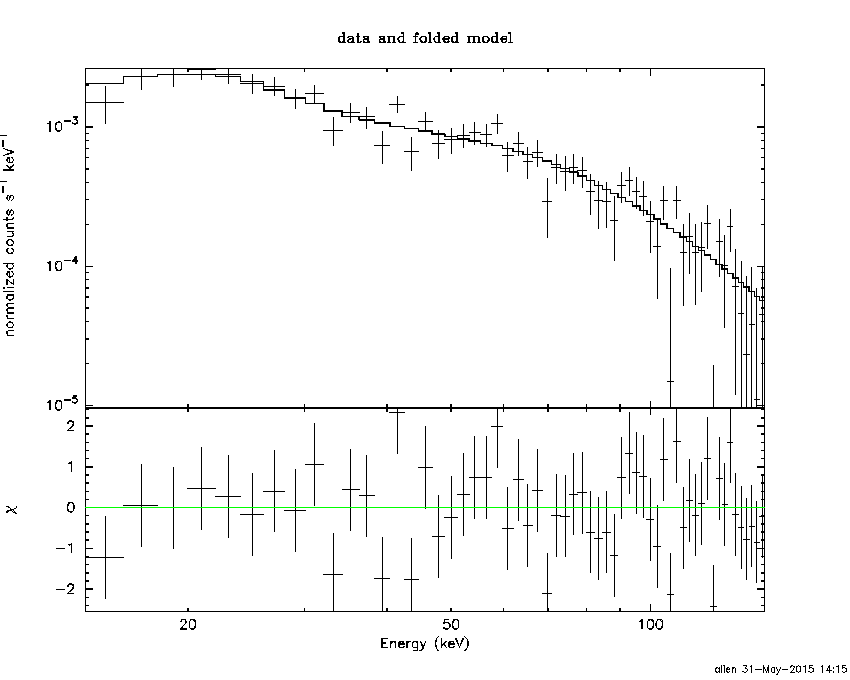
Peak spectrum fit
Power-law model
Time interval is from  -36.316 sec. to  -35.316 sec.

Spectral model in power-law:
------------------------------------------------------------
Parameters  : value       lower 90%   higher 90%
Photon index: 0.900204     ( -0.457586   0.401352 )
Norm@50keV  : 1.04834E-02    ( -0.00276643   0.00259711 )
------------------------------------------------------------
#Fit statistic : Chi-Squared =          56.70 using 59 PHA bins.
# Reduced chi-squared =         0.9947 for     57 degrees of freedom
# Null hypothesis probability =   4.863158e-01

Photon flux (15-150 keV)    in 1 sec: 1.20321 ( -0.30323  0.309493 ) ph/cm2/s
Energy fluence (15-150 keV)             : 1.17644e-07 ( -2.59651e-08  2.59934e-08 ) ergs/cm2
Cutoff power-law model

Time interval is from  -36.316 sec. to  -35.316 sec.
Spectral model in the cutoff power-law:
------------------------------------------------------------
Parameters  : value       lower 90%   higher 90%
Photon index: 0.903490     ( -0.881013   0.396792 )
Epeak [keV] : 9999.16      ( -9999.35 -9999.35 )
Norm@50keV  : 1.05754E-02    ( -0.00256284   0.0317052 )
------------------------------------------------------------
#Fit statistic : Chi-Squared =          56.70 using 59 PHA bins.
# Reduced chi-squared =          1.013 for     56 degrees of freedom
# Null hypothesis probability =   4.485585e-01

Photon flux (15-150 keV)    in 1 sec: 1.20730 ( -0.308407  0.30434 ) ph/cm2/s
Energy fluence (15-150 keV)             : 1.17587e-07 ( -2.56983e-08  2.6025e-08 ) ergs/cm2
Band function

Time interval is from  -36.316 sec. to  -35.316 sec.

Spectral model in the Band function:
------------------------------------------------------------
Parameters  : value       lower 90%   higher 90%
alpha       : -0.769936   ( 0.769936   0.769936 )
beta        : -0.900222    ( -0.401426   0.457296 )
Epeak [keV] : 33.5848      ( -33.5848 -33.5848 )
Norm@50keV   : 1.68515E-02    ( -0.00871308   32210.4 )
------------------------------------------------------------
#Fit statistic : Chi-Squared =          56.70 using 59 PHA bins.
# Reduced chi-squared =          1.031 for     55 degrees of freedom
# Null hypothesis probability =   4.114399e-01

Photon flux (15-150 keV)    in 1 sec:  (    ) ph/cm2/s
Energy fluence (15-150 keV)             : 0 ( 0  0 ) ergs/cm2
Single BB
Spectral model blackbody:
------------------------------------------------------------
Parameters  : value    Lower 90%  Upper 90%
kT [keV]    : 28.2937  (-7.68032  14.2676)
R^2/D10^2   : 2.02698E-02  (-0.0140894   0.0348369)
(R is the radius in km and D10 is the distance to the source in units of 10 kpc)
------------------------------------------------------------
#Fit statistic : Chi-Squared =          60.53 using 59 PHA bins.
# Reduced chi-squared =          1.062 for     57 degrees of freedom
# Null hypothesis probability =   3.498222e-01

Energy  Fluence     90% Error
[keV]   [erg/cm2]   [erg/cm2]
15- 25  2.630e-09   1.364e-09
25- 50  1.582e-08   6.603e-09
50-150  9.133e-08   4.219e-08
15-150  1.098e-07   4.888e-08
Thermal bremsstrahlung (OTTB)

Spectral model: thermal bremsstrahlung
------------------------------------------------------------
Parameters  : value         Lower 90%    Upper 90%
kT [keV]    : 200.000       (      )
Norm        : 5.32034       (-1.25665     1.25622)
------------------------------------------------------------
#Fit statistic : Chi-Squared =          64.81 using 59 PHA bins.
# Reduced chi-squared =          1.137 for     57 degrees of freedom
# Null hypothesis probability =   2.229869e-01

Energy  Fluence     90% Error
[keV]   [erg/cm2]   [erg/cm2]
15- 25  1.326e-08   7.955e-09
25- 50  2.551e-08   1.491e-08
50-150  5.595e-08   3.344e-08
15-150  9.473e-08   5.510e-08
Double BB
R1^2/D10^2  : 1.57577E+08        (      )
kT2 [keV]   : 29.2856        (-8.32065      15.6388)
R2^2/D10^2  : 1.80890E-02    (-0.0118027   0.0189885)
------------------------------------------------------------
#Fit statistic : Chi-Squared =          56.79 using 59 PHA bins.
#Fit statistic : Chi-Squared =          56.19 using 59 PHA bins.
#Fit statistic : Chi-Squared =          55.88 using 59 PHA bins.
# Reduced chi-squared =          1.032 for     55 degrees of freedom
# Reduced chi-squared =          1.022 for     55 degrees of freedom
# Reduced chi-squared =          1.016 for     55 degrees of freedom
# Null hypothesis probability =   4.082479e-01
# Null hypothesis probability =   4.300562e-01
# Null hypothesis probability =   4.415828e-01

Energy  Fluence     90% Error
[keV]   [erg/cm2]   [erg/cm2]
15- 25  7.364e-09   4.754e-09
25- 50  2.114e-08   1.166e-08
50-150  9.120e-08   5.035e-08
15-150  1.197e-07   6.120e-08
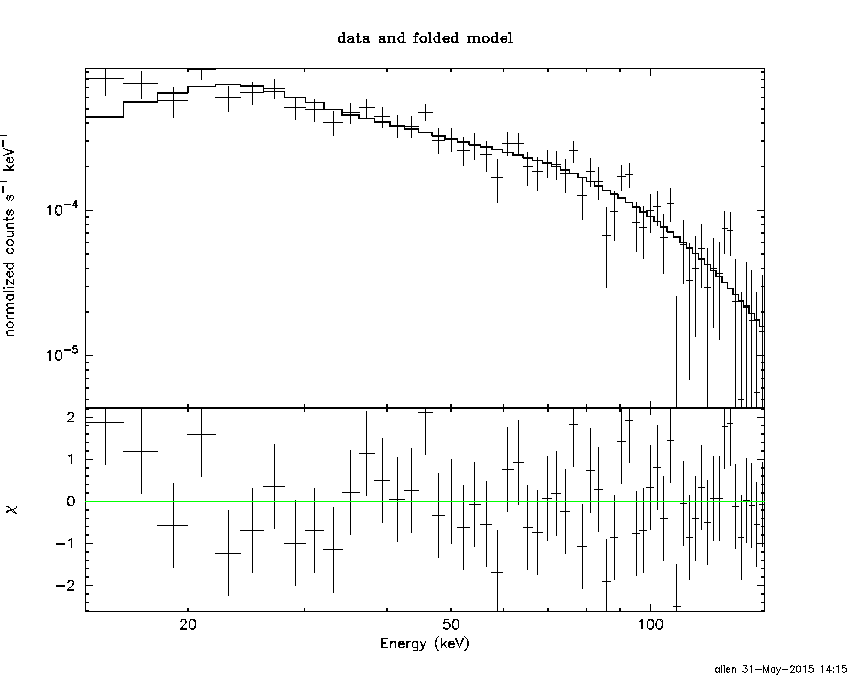
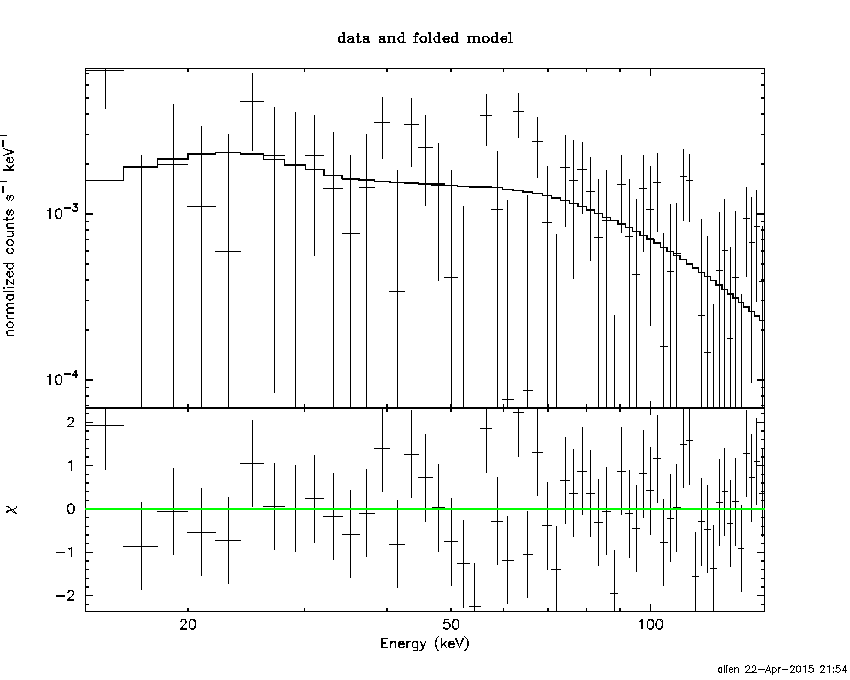
Pre-slew spectrum (Pre-slew PHA with pre-slew DRM)
Power-law model
Spectral model in power-law:
------------------------------------------------------------
Parameters  : value       lower 90%   higher 90%
Photon index: 1.55718     ( -0.0926954   0.0929215 )
Norm@50keV  : 6.04973E-03    ( -0.000316263   0.000315816 )
------------------------------------------------------------
#Fit statistic : Chi-Squared =          58.75 using 59 PHA bins.
# Reduced chi-squared =          1.031 for     57 degrees of freedom
# Null hypothesis probability =   4.112053e-01

Photon flux (15-150 keV)    in 36.6 sec: 0.767459 ( -0.0427601  0.0428773 ) ph/cm2/s
Energy fluence (15-150 keV)             : 2.08236e-06 ( -1.15069e-07  1.15341e-07 ) ergs/cm2
Cutoff power-law model

Spectral model in the cutoff power-law:
------------------------------------------------------------
Parameters  : value       lower 90%   higher 90%
Photon index: 1.44008     ( -0.362095   0.198434 )
Epeak [keV] : 254.146      ( -254.146 -254.146 )
Norm@50keV  : 6.88768E-03    ( -0.00111582   0.00327823 )
------------------------------------------------------------
#Fit statistic : Chi-Squared =          58.41 using 59 PHA bins.
# Reduced chi-squared =          1.043 for     56 degrees of freedom
# Null hypothesis probability =   3.870210e-01

Photon flux (15-150 keV)    in 36.6 sec: 0.762556 ( -0.044888  0.044822 ) ph/cm2/s
Energy fluence (15-150 keV)             : 2.06965e-06 ( -1.2239e-07  1.21549e-07 ) ergs/cm2
Band function
Spectral model in the Band function:
------------------------------------------------------------
Parameters  : value       lower 90%   higher 90%
alpha       : 4.94482   ( -4.94482   -4.94482 )
beta        : -1.58366    ( -0.099154   0.0975176 )
Epeak [keV] : 21.7717      ( -21.7717 4.12943 )
Norm@50keV   : 1420.42    ( -73.5652   2.96171e+06 )
------------------------------------------------------------
#Fit statistic : Chi-Squared =          57.39 using 59 PHA bins.
# Reduced chi-squared =          1.044 for     55 degrees of freedom
# Null hypothesis probability =   3.865097e-01

Photon flux (15-150 keV)    in 36.6 sec:  (    ) ph/cm2/s
Energy fluence (15-150 keV)             : 0 ( 0  0 ) ergs/cm2
S(25-50 keV) vs. S(50-100 keV) plot

S(25-50 keV)  = 1.88e-06
S(50-100 keV) = 2.70e-06
T90 vs. Hardness ratio plot
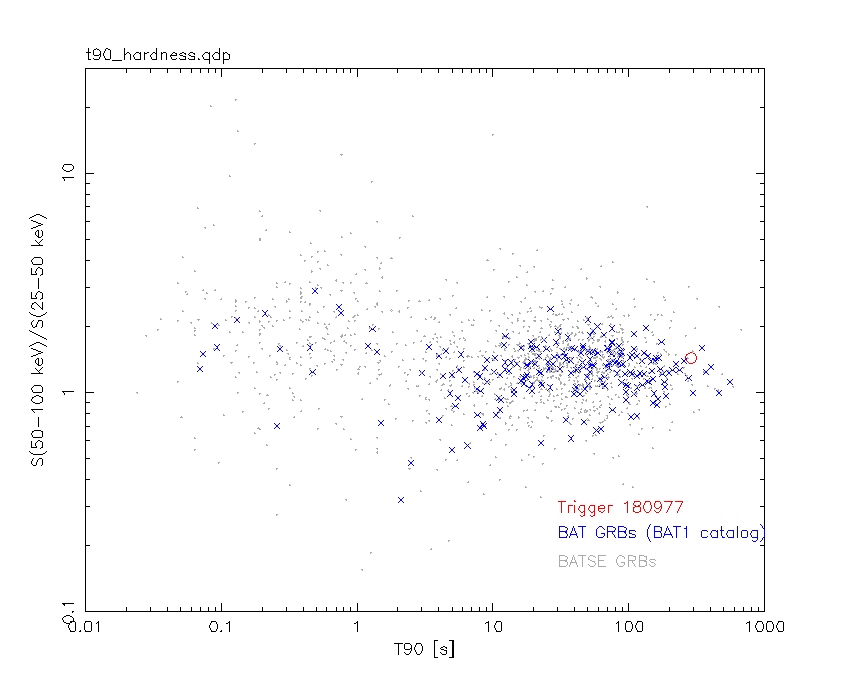
T90                                   = 288 sec.
Hardness ratio (energy fluence ratio) = 1.43617
Color vs. Color plot

Count Ratio  (25-50 keV) / (15-25 keV) = 1.57841
Count Ratio (50-100 keV) / (15-25 keV) = 1.28409
Mask shadow pattern
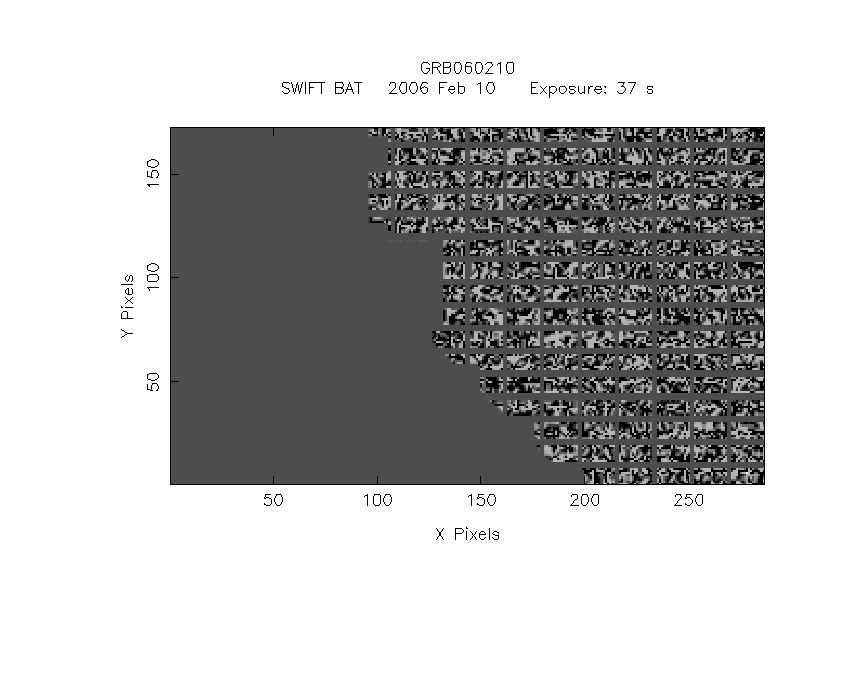
IMX = -9.705164329411058E-01, IMY = -2.319986671718222E-02
TIME vs. PHA plot around the trigger time

Blue+Cyan dotted lines: Time interval of the scaled map
From 0.000000 to 1.024000
TIME vs. DetID plot around the trigger time
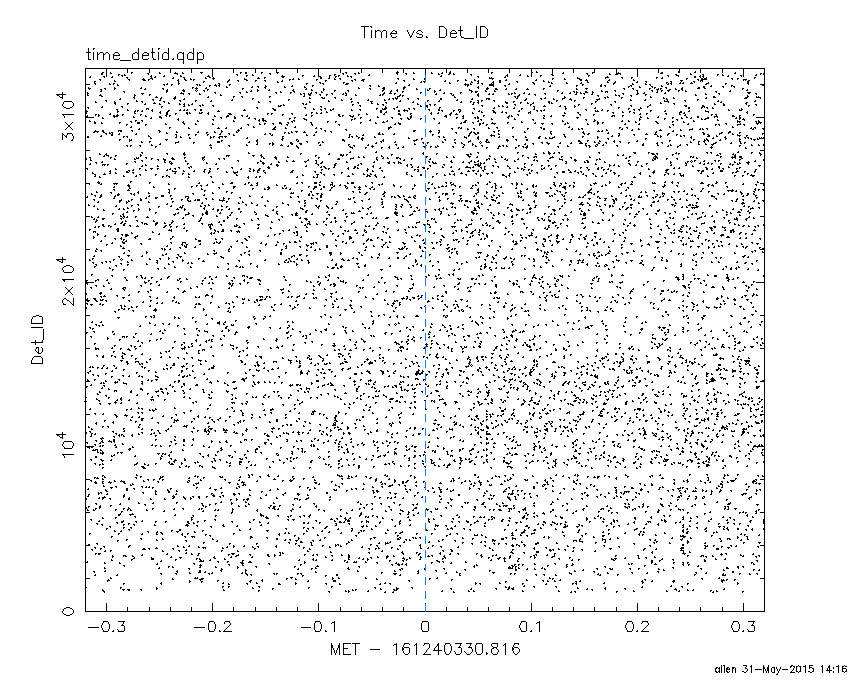
Blue+Cyan dotted lines: Time interval of the scaled map
From 0.000000 to 1.024000
100 us light curve (15-350 keV)
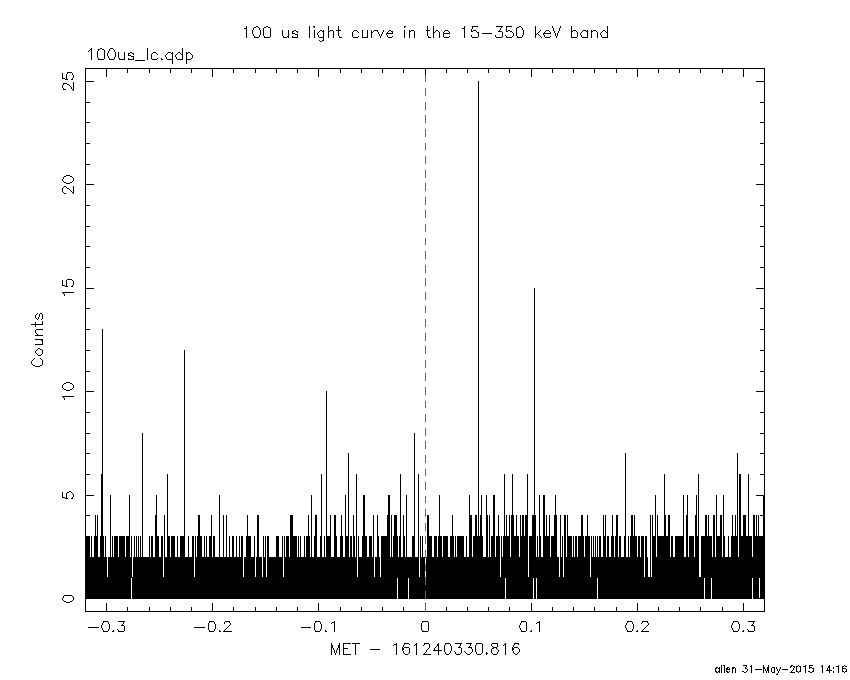
Blue+Cyan dotted lines: Time interval of the scaled map
From 0.000000 to 1.024000
Spacecraft aspect plot

Bright source in the pre-burst/pre-slew/post-slew images
Pre-burst image of 15-350 keV band
Time interval of the image:
Pre-slew background subtracted image of 15-350 keV band
Time interval of the image:
-21.115400 15.484620

# RAcent  DECcent POSerr Theta    Phi  PeakCts   SNR AngSep     Name
#  [deg]    [deg]    ['] [deg]  [deg]                   [']
 83.6244  22.0007    1.8  47.9  145.4   1.6389   6.5    1.0	Crab
 94.9767  34.5735    2.3  36.5  128.4   0.6465   5.0 ------	UNKNOWN
160.9559  62.5085    2.4  31.9   33.9   0.4132   4.8 ------	UNKNOWN
 57.7255  27.0168    0.4  44.2  178.6   3.1475  29.0 ------	UNKNOWN
 50.0710  52.2664    2.5  21.4 -156.9   0.2614   4.6 ------	UNKNOWN
 33.2657  78.2816    2.4  14.2  -61.3   0.2959   4.7 ------	UNKNOWN
283.9887  58.1034    2.2  50.7  -44.4   1.6611   5.2 ------	UNKNOWN
  3.7843  44.6888    3.0  43.1 -112.1   1.0147   3.9 ------	UNKNOWN
Post-slew image of 15-350 keV band
Time interval of the image:
81.084590 302.238700

# RAcent  DECcent POSerr Theta    Phi  PeakCts   SNR AngSep     Name
#  [deg]    [deg]    ['] [deg]  [deg]                   [']
 83.6363  22.0115    0.3  24.1  107.6  10.1075  44.4    0.2	Crab
 75.9270  10.7949    2.1  23.6  141.2   1.0297   5.4 ------	UNKNOWN
 57.7543  27.0121    1.3   0.0  131.9   1.5268   9.2 ------	UNKNOWN
 54.3375 -11.7511    2.5  38.9 -163.5   1.1749   4.7 ------	UNKNOWN
354.4429  66.1135    3.0  54.7  -15.1   2.0799   3.8 ------	UNKNOWN
 49.3789 -19.8446    2.4  47.6 -158.1   1.6976   4.8 ------	UNKNOWN
 42.9917 -20.2067    3.1  49.3 -150.5   1.6177   3.7 ------	UNKNOWN
357.5497  42.5218    3.9  50.7  -44.5   3.0284   2.9 ------	UNKNOWN
Plot creation:
Sun May 31 14:16:11 EDT 2015