Click here for the BAT GCN circular template
Image
Pre-slew 15.0-350.0 keV image (Event data)
#   RAcent    DECcent   POSerr    Theta     Phi              Peak Cts       SNR   Name
   75.0874    14.9566   0.0158    17.1565   121.5554         0.7351997     12.114 TRIG_00181156

Foreground time interval of the image:
-10.596  19.160 (delta_t =  29.756 [sec])
Background time interval of the image:
-299.776 -10.596 (delta_t = 289.180 [sec])
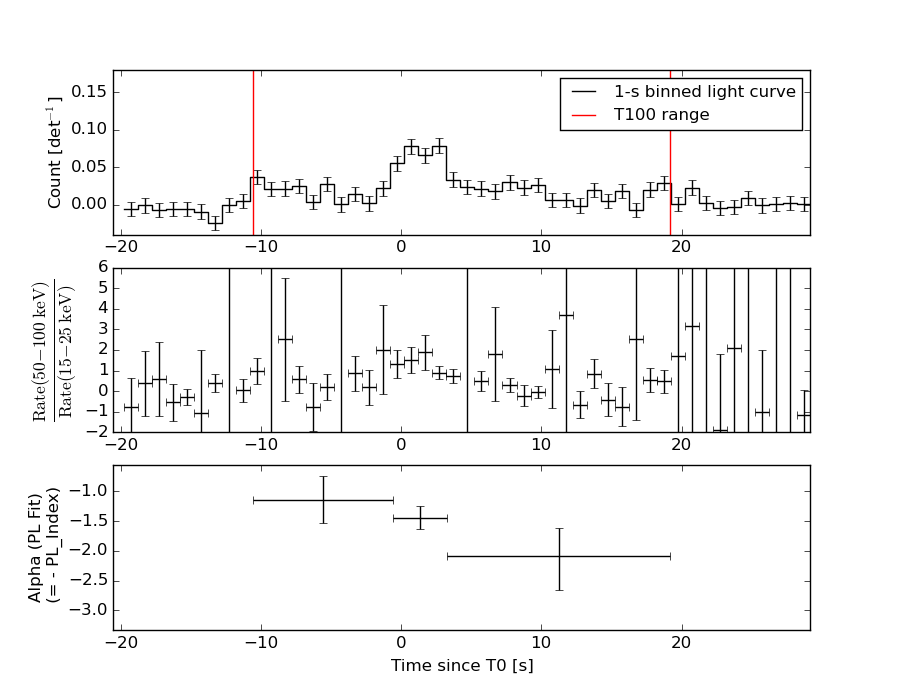
Lightcurves
Notes:
- 1) The mask-weighted light curves are using the flight position.
- 2) Multiple plots of different time binning/intervals are shown to cover all scenarios of short/long GRBs, rate/image triggers, and real/false positives.
- 3) For all the mask-weighted lightcurves, the y-axis units are counts/sec/det where a det is 0.4 x 0.4 = 0.16 sq cm.
- 4) The verticle lines correspond to following: green dotted lines are T50 interval, black dotted lines are T90 interval, blue solid line(s) is a spacecraft slew start time, and orange solid line(s) is a spacecraft slew end time.
- 5) Time of each bin is in the middle of the bin.
1 s binning
From T0-310 s to T0+310 s
From T100_start - 20 s to T100_end + 30 s
Full time interval

64 ms binning
Full time interval

From T100_start to T100_end

From T0-5 sec to T0+5 sec
16 ms binning
From T100_start-5 s to T100_start+5 s
Blue+Cyan dotted lines: Time interval of the scaled map
From 0.000000 to 2.048000
8 ms binning
From T100_start-3 s to T100_start+3 s
Blue+Cyan dotted lines: Time interval of the scaled map
From 0.000000 to 2.048000
2 ms binning
From T100_start-1 s to T100_start+1 s
Blue+Cyan dotted lines: Time interval of the scaled map
From 0.000000 to 2.048000
SN=5 or 10 sec. binning (whichever binning is satisfied first)
SN=5 or 10 sec. binning (T < 200 sec)
Quad-rate summed light curves (from T0-300s to T0+1000s)

Spectral Evolution
Spectra
Notes:
- 1) The fitting includes the systematic errors.
- 2) When the burst includes telescope slew time periods, the fitting uses an average response file made from multiple 5-s response files through out the slew time plus single time preiod for the non-slew times, and weighted by the total counts in the corresponding time period using addrmf. An average response file is needed becuase a spectral fit using the pre-slew DRM will introduce some errors in both a spectral shape and a normalization if the PHA file contains a lot of the slew/post-slew time interval.
- 3) For fits to more complicated models (e.g. a power-law over a cutoff power-law), the BAT team has decided to require a chi-square improvement of more than 6 for each extra dof.
Time averaged spectrum fit using the average DRM
Power-law model
Time interval is from  -10.596 sec. to   19.160 sec.

Spectral model in power-law:
------------------------------------------------------------
Parameters  : value       lower 90%   higher 90%
Photon index: 1.52947     ( -0.203657   0.207509 )
Norm@50keV  : 1.58174E-03    ( -0.000193943   0.00019165 )
------------------------------------------------------------
#Fit statistic : Chi-Squared =          44.27 using 59 PHA bins.
# Reduced chi-squared =         0.7766 for     57 degrees of freedom
# Null hypothesis probability =   8.909251e-01

Photon flux (15-150 keV)    in 29.76 sec: 0.199069 ( -0.0230708  0.0230877 ) ph/cm2/s
Energy fluence (15-150 keV)             : 4.44486e-07 ( -5.96057e-08  6.05661e-08 ) ergs/cm2
Cutoff power-law model

Time interval is from  -10.596 sec. to   19.160 sec.
Spectral model in the cutoff power-law:
------------------------------------------------------------
Parameters  : value       lower 90%   higher 90%
Photon index: 1.19403     ( -0.848363   0.508548 )
Epeak [keV] : 116.966      ( -116.966 -116.966 )
Norm@50keV  : 2.36017E-03    (     )
------------------------------------------------------------
#Fit statistic : Chi-Squared =          43.66 using 59 PHA bins.
# Reduced chi-squared =         0.7797 for     56 degrees of freedom
# Null hypothesis probability =   8.849915e-01

Photon flux (15-150 keV)    in 29.76 sec: 0.196143 ( -0.023959  0.02391 ) ph/cm2/s
Energy fluence (15-150 keV)             : 4.32204e-07 ( -6.53559e-08  6.58232e-08 ) ergs/cm2
Band function
Time interval is from  -10.596 sec. to   19.160 sec.

Spectral model in the Band function:
------------------------------------------------------------
Parameters  : value       lower 90%   higher 90%
alpha       : -1.19506   ( -0.427189   0.641548 )
beta        : -10.00000    ( 10   20 )
Epeak [keV] : 117.170      ( -48.4958 -117.17 )
Norm@50keV   : 2.35694E-03    ( -0.000270001   0.00395759 )
------------------------------------------------------------
#Fit statistic : Chi-Squared =          43.66 using 59 PHA bins.
# Reduced chi-squared =         0.7938 for     55 degrees of freedom
# Null hypothesis probability =   8.645748e-01

Photon flux (15-150 keV)    in 29.76 sec:  (    ) ph/cm2/s
Energy fluence (15-150 keV)             : 0 ( 0  0 ) ergs/cm2
Single BB
Spectral model blackbody:
------------------------------------------------------------
Parameters  : value    Lower 90%  Upper 90%
kT [keV]    : 14.6048  (-2.19203  2.61542)
R^2/D10^2   : 2.44436E-02  (-0.0106363   0.0188265)
(R is the radius in km and D10 is the distance to the source in units of 10 kpc)
------------------------------------------------------------
#Fit statistic : Chi-Squared =          61.44 using 59 PHA bins.
# Reduced chi-squared =          1.078 for     57 degrees of freedom
# Null hypothesis probability =   3.201382e-01

Energy  Fluence     90% Error
[keV]   [erg/cm2]   [erg/cm2]
15- 25  3.262e-08   7.501e-09
25- 50  1.264e-07   2.168e-08
50-150  1.813e-07   4.857e-08
15-150  3.403e-07   5.788e-08
Thermal bremsstrahlung (OTTB)
Spectral model: thermal bremsstrahlung
------------------------------------------------------------
Parameters  : value         Lower 90%    Upper 90%
kT [keV]    : 199.363       (-84.5855      -199.363)
Norm        : 0.812176       (-0.09305     0.0931396)
------------------------------------------------------------
#Fit statistic : Chi-Squared =          43.74 using 59 PHA bins.
# Reduced chi-squared =         0.7673 for     57 degrees of freedom
# Null hypothesis probability =   9.015758e-01

Energy  Fluence     90% Error
[keV]   [erg/cm2]   [erg/cm2]
15- 25  6.019e-08   3.358e-08
25- 50  1.158e-07   6.358e-08
50-150  2.539e-07   1.383e-07
15-150  4.299e-07   2.357e-07
Double BB
Spectral model: bbodyrad<1> + bbodyrad<2>
------------------------------------------------------------
Parameters  : value         Lower 90%    Upper 90%
kT1 [keV]   : 5.83864        (-2.03721      2.54085)
R1^2/D10^2  : 0.376436        (-0.267531      1.7385)
kT2 [keV]   : 22.9193        (-5.34609      10.5984)
R2^2/D10^2  : 4.21567E-03    (-0.00312287   0.00468863)
------------------------------------------------------------
#Fit statistic : Chi-Squared =          42.73 using 59 PHA bins.
# Reduced chi-squared =         0.7769 for     55 degrees of freedom
# Null hypothesis probability =   8.859621e-01

Energy  Fluence     90% Error
[keV]   [erg/cm2]   [erg/cm2]
15- 25  6.071e-08   3.253e-08
25- 50  1.106e-07   4.938e-08
50-150  2.580e-07   1.437e-07
15-150  4.292e-07   1.941e-07
Peak spectrum fit
Power-law model

Time interval is from    1.836 sec. to    2.836 sec.

Spectral model in power-law:
------------------------------------------------------------
Parameters  : value       lower 90%   higher 90%
Photon index: 1.40603     ( -0.279816   0.281171 )
Norm@50keV  : 6.06050E-03    ( -0.00105046   0.00104335 )
------------------------------------------------------------
#Fit statistic : Chi-Squared =          42.41 using 59 PHA bins.
# Reduced chi-squared =         0.7440 for     57 degrees of freedom
# Null hypothesis probability =   9.251758e-01

Photon flux (15-150 keV)    in 1 sec: 0.739069 ( -0.125905  0.12606 ) ph/cm2/s
Energy fluence (15-150 keV)             : 5.84895e-08 ( -1.11465e-08  1.1355e-08 ) ergs/cm2
Cutoff power-law model
Time interval is from    1.836 sec. to    2.836 sec.
Spectral model in the cutoff power-law:
------------------------------------------------------------
Parameters  : value       lower 90%   higher 90%
Photon index: 0.606054     ( -1.39214   0.929722 )
Epeak [keV] : 84.4209      ( -30.7367 -84.421 )
Norm@50keV  : 1.58190E-02    ( -0.0158189   0.0658649 )
------------------------------------------------------------
#Fit statistic : Chi-Squared =          40.84 using 59 PHA bins.
# Reduced chi-squared =         0.7292 for     56 degrees of freedom
# Null hypothesis probability =   9.360799e-01

Photon flux (15-150 keV)    in 1 sec: 0.719077 ( -0.125476  0.065161 ) ph/cm2/s
Energy fluence (15-150 keV)             : 5.48517e-08 ( -1.21014e-08  1.24396e-08 ) ergs/cm2
Band function

Time interval is from    1.836 sec. to    2.836 sec.

Spectral model in the Band function:
------------------------------------------------------------
Parameters  : value       lower 90%   higher 90%
alpha       : 4.91825   ( -4.91825   -4.91825 )
beta        : -1.71323    ( -0.598854   0.389029 )
Epeak [keV] : 31.4471      ( -31.4471 7.89572 )
Norm@50keV   : 141.868    ( -23.5756   2.04701e+06 )
------------------------------------------------------------
#Fit statistic : Chi-Squared =          39.74 using 59 PHA bins.
# Reduced chi-squared =         0.7226 for     55 degrees of freedom
# Null hypothesis probability =   9.395733e-01

Photon flux (15-150 keV)    in 1 sec: 0.722029 ( 6.27797  -0.127473 ) ph/cm2/s
Energy fluence (15-150 keV)             : 0 ( 0  0 ) ergs/cm2
Single BB

Spectral model blackbody:
------------------------------------------------------------
Parameters  : value    Lower 90%  Upper 90%
kT [keV]    : 15.1080  (-3.02268  3.8668)
R^2/D10^2   : 8.49900E-02  (-0.0463502   0.0998724)
(R is the radius in km and D10 is the distance to the source in units of 10 kpc)
------------------------------------------------------------
#Fit statistic : Chi-Squared =          46.21 using 59 PHA bins.
# Reduced chi-squared =         0.8106 for     57 degrees of freedom
# Null hypothesis probability =   8.459871e-01

Energy  Fluence     90% Error
[keV]   [erg/cm2]   [erg/cm2]
15- 25  4.057e-09   1.370e-09
25- 50  1.623e-08   4.289e-09
50-150  2.528e-08   9.500e-09
15-150  4.557e-08   1.231e-08
Thermal bremsstrahlung (OTTB)
Spectral model: thermal bremsstrahlung
------------------------------------------------------------
Parameters  : value         Lower 90%    Upper 90%
kT [keV]    : 199.363       (-87.4912      -199.363)
Norm        : 3.05206       (-0.513517     0.513517)
------------------------------------------------------------
#Fit statistic : Chi-Squared =          42.11 using 59 PHA bins.
# Reduced chi-squared =         0.7389 for     57 degrees of freedom
# Null hypothesis probability =   9.297911e-01

Energy  Fluence     90% Error
[keV]   [erg/cm2]   [erg/cm2]
15- 25  7.600e-09   4.370e-09
25- 50  1.462e-08   8.240e-09
50-150  3.206e-08   1.840e-08
15-150  5.428e-08   3.065e-08
Double BB

Spectral model: bbodyrad<1> + bbodyrad<2>
------------------------------------------------------------
Parameters  : value         Lower 90%    Upper 90%
kT1 [keV]   : 7.50217        (-2.99944      4.62432)
R1^2/D10^2  : 0.551900        (-0.417798      2.40885)
kT2 [keV]   : 25.0146        (-20.3796      60.3082)
R2^2/D10^2  : 1.12793E-02    (-0.0112495   0.02546)
------------------------------------------------------------
#Fit statistic : Chi-Squared =          39.71 using 59 PHA bins.
# Reduced chi-squared =         0.7220 for     55 degrees of freedom
# Null hypothesis probability =   9.400400e-01

Energy  Fluence     90% Error
[keV]   [erg/cm2]   [erg/cm2]
15- 25  6.558e-09   3.835e-09
25- 50  1.528e-08   8.130e-09
50-150  3.403e-08   1.936e-08
15-150  5.587e-08   2.955e-08
Pre-slew spectrum (Pre-slew PHA with pre-slew DRM)
Power-law model

Spectral model in power-law:
------------------------------------------------------------
Parameters  : value       lower 90%   higher 90%
Photon index: 1.52947     ( -0.203657   0.207509 )
Norm@50keV  : 1.58174E-03    ( -0.000193943   0.00019165 )
------------------------------------------------------------
#Fit statistic : Chi-Squared =          44.27 using 59 PHA bins.
# Reduced chi-squared =         0.7766 for     57 degrees of freedom
# Null hypothesis probability =   8.909251e-01

Photon flux (15-150 keV)    in 29.76 sec: 0.199069 ( -0.0230708  0.0230877 ) ph/cm2/s
Energy fluence (15-150 keV)             : 4.44486e-07 ( -5.96057e-08  6.05661e-08 ) ergs/cm2
Cutoff power-law model

Spectral model in the cutoff power-law:
------------------------------------------------------------
Parameters  : value       lower 90%   higher 90%
Photon index: 1.19403     ( -0.848363   0.508548 )
Epeak [keV] : 116.966      ( -116.966 -116.966 )
Norm@50keV  : 2.36017E-03    (     )
------------------------------------------------------------
#Fit statistic : Chi-Squared =          43.66 using 59 PHA bins.
# Reduced chi-squared =         0.7797 for     56 degrees of freedom
# Null hypothesis probability =   8.849915e-01

Photon flux (15-150 keV)    in 29.76 sec: 0.196143 ( -0.023959  0.02391 ) ph/cm2/s
Energy fluence (15-150 keV)             : 4.32204e-07 ( -6.53559e-08  6.58232e-08 ) ergs/cm2
Band function

Spectral model in the Band function:
------------------------------------------------------------
Parameters  : value       lower 90%   higher 90%
alpha       : -1.19506   ( -0.427189   0.641548 )
beta        : -10.00000    ( 10   20 )
Epeak [keV] : 117.170      ( -48.4958 -117.17 )
Norm@50keV   : 2.35694E-03    ( -0.000270001   0.00395759 )
------------------------------------------------------------
#Fit statistic : Chi-Squared =          43.66 using 59 PHA bins.
# Reduced chi-squared =         0.7938 for     55 degrees of freedom
# Null hypothesis probability =   8.645748e-01

Photon flux (15-150 keV)    in 29.76 sec:  (    ) ph/cm2/s
Energy fluence (15-150 keV)             : 0 ( 0  0 ) ergs/cm2
S(25-50 keV) vs. S(50-100 keV) plot
S(25-50 keV)  = 1.12e-07
S(50-100 keV) = 1.55e-07
T90 vs. Hardness ratio plot

T90                                   = 27.7319999933243 sec.
Hardness ratio (energy fluence ratio) = 1.38393
Color vs. Color plot
Count Ratio  (25-50 keV) / (15-25 keV) = 1.50139
Count Ratio (50-100 keV) / (15-25 keV) = 1.10538
Mask shadow pattern
IMX = -1.615595728491372E-01, IMY = -2.630701998202375E-01
TIME vs. PHA plot around the trigger time
Blue+Cyan dotted lines: Time interval of the scaled map
From 0.000000 to 2.048000
TIME vs. DetID plot around the trigger time

Blue+Cyan dotted lines: Time interval of the scaled map
From 0.000000 to 2.048000
100 us light curve (15-350 keV)
Blue+Cyan dotted lines: Time interval of the scaled map
From 0.000000 to 2.048000
Spacecraft aspect plot
Bright source in the pre-burst/pre-slew/post-slew images
Pre-burst image of 15-350 keV band
Time interval of the image:
-299.776000 -10.596000

# RAcent  DECcent POSerr Theta    Phi  PeakCts   SNR AngSep     Name
#  [deg]    [deg]    ['] [deg]  [deg]                   [']
 83.6433  22.0222    0.3  23.4   95.9  11.9561  44.8    0.7	Crab
 99.6132  57.8483    2.8  46.9   40.6   3.7603   4.2 ------	UNKNOWN
 56.3156 -37.4762    3.2  59.0 -166.2   4.6126   3.6 ------	UNKNOWN
  2.2546  39.0918    4.3  50.7  -44.5   3.2389   2.7 ------	UNKNOWN
 29.4724 -17.6625    2.7  48.3 -130.0   4.1272   4.2 ------	UNKNOWN
 18.8851   6.7559    3.3  40.9  -93.3   4.0025   3.5 ------	UNKNOWN
Pre-slew background subtracted image of 15-350 keV band
Time interval of the image:
-10.596000 19.160000

# RAcent  DECcent POSerr Theta    Phi  PeakCts   SNR AngSep     Name
#  [deg]    [deg]    ['] [deg]  [deg]                   [']
 83.4775  22.1363    6.2  23.3   95.7  -0.1300  -1.9   11.3	Crab
 83.7271  52.2945    2.2  36.5   38.1   0.5393   5.3 ------	UNKNOWN
 75.0874  14.9566    0.9  17.2  121.6   0.7353  12.1 ------	UNKNOWN
 54.1638  66.2189    2.0  44.8    9.5   0.6111   5.7 ------	UNKNOWN
 52.3324  27.4198    2.3   8.1  -29.8   0.2589   5.1 ------	UNKNOWN
 44.7379 -21.4179    2.8  44.9 -150.0   0.3737   4.1 ------	UNKNOWN
Post-slew image of 15-350 keV band
Time interval of the image:
67.324600 302.269900

# RAcent  DECcent POSerr Theta    Phi  PeakCts   SNR AngSep     Name
#  [deg]    [deg]    ['] [deg]  [deg]                   [']
 83.6348  22.0211    0.2  10.8   57.0  10.2718  60.9    0.4	Crab
 65.4606  42.5598    4.4  28.8   -5.6   0.5004   2.6 ------	UNKNOWN
 73.2125 -41.8642    2.8  56.9 -169.2   3.1058   4.2 ------	UNKNOWN
 28.1410  60.2034    2.6  56.5  -16.6   3.4306   4.4 ------	UNKNOWN
 34.3163  49.6594    2.8  47.9  -25.5   1.6742   4.1 ------	UNKNOWN
 23.4614  37.2391    3.1  50.6  -44.6   3.7556   4.2 ------	UNKNOWN
 23.2795  37.4221    3.9  50.8  -44.4   3.5611   4.0 ------	UNKNOWN
Plot creation:
Sun May 31 14:12:10 EDT 2015