Special notes of this burst
Image
Pre-slew 15.0-350.0 keV image (Event data)
#   RAcent    DECcent   POSerr    Theta     Phi              Peak Cts       SNR   Name
   55.1955   -17.1350   0.0080    34.3504   178.6801         1.0874325     23.866 TRIG_00192059

Foreground time interval of the image:
 -2.924  10.032 (delta_t =  12.956 [sec])
Background time interval of the image:
-299.960  -2.924 (delta_t = 297.036 [sec])
Lightcurves
Notes:
- 1) The mask-weighted light curves are using the flight position.
- 2) Multiple plots of different time binning/intervals are shown to cover all scenarios of short/long GRBs, rate/image triggers, and real/false positives.
- 3) For all the mask-weighted lightcurves, the y-axis units are counts/sec/det where a det is 0.4 x 0.4 = 0.16 sq cm.
- 4) The verticle lines correspond to following: green dotted lines are T50 interval, black dotted lines are T90 interval, blue solid line(s) is a spacecraft slew start time, and orange solid line(s) is a spacecraft slew end time.
- 5) Time of each bin is in the middle of the bin.
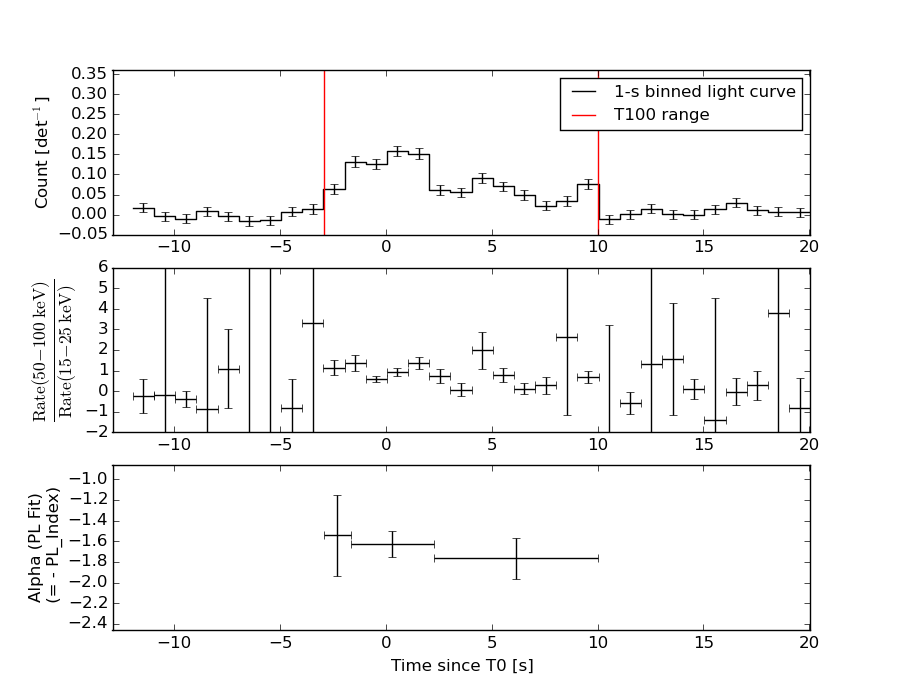
1 s binning
From T0-310 s to T0+310 s

From T100_start - 20 s to T100_end + 30 s
Full time interval
64 ms binning
Full time interval
From T100_start to T100_end
From T0-5 sec to T0+5 sec
16 ms binning
From T100_start-5 s to T100_start+5 s
Blue+Cyan dotted lines: Time interval of the scaled map
From 0.000000 to 1.024000
8 ms binning
From T100_start-3 s to T100_start+3 s

Blue+Cyan dotted lines: Time interval of the scaled map
From 0.000000 to 1.024000
2 ms binning
From T100_start-1 s to T100_start+1 s
Blue+Cyan dotted lines: Time interval of the scaled map
From 0.000000 to 1.024000
SN=5 or 10 sec. binning (whichever binning is satisfied first)

SN=5 or 10 sec. binning (T < 200 sec)
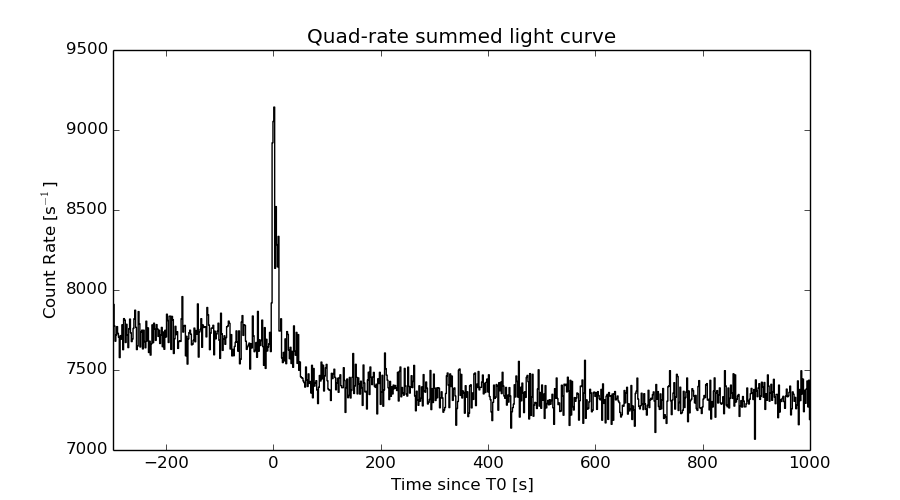
Quad-rate summed light curves (from T0-300s to T0+1000s)
Spectral Evolution
Spectra
Notes:
- 1) The fitting includes the systematic errors.
- 2) When the burst includes telescope slew time periods, the fitting uses an average response file made from multiple 5-s response files through out the slew time plus single time preiod for the non-slew times, and weighted by the total counts in the corresponding time period using addrmf. An average response file is needed becuase a spectral fit using the pre-slew DRM will introduce some errors in both a spectral shape and a normalization if the PHA file contains a lot of the slew/post-slew time interval.
- 3) For fits to more complicated models (e.g. a power-law over a cutoff power-law), the BAT team has decided to require a chi-square improvement of more than 6 for each extra dof.
Time averaged spectrum fit using the average DRM
Power-law model
Time interval is from   -2.924 sec. to   10.032 sec.

Spectral model in power-law:
------------------------------------------------------------
Parameters  : value       lower 90%   higher 90%
Photon index: 1.68877     ( -0.11121   0.112703 )
Norm@50keV  : 5.61429E-03    ( -0.000386295   0.000383814 )
------------------------------------------------------------
#Fit statistic : Chi-Squared =          59.81 using 59 PHA bins.
# Reduced chi-squared =          1.049 for     57 degrees of freedom
# Null hypothesis probability =   3.741043e-01

Photon flux (15-150 keV)    in 12.96 sec: 0.742739 ( -0.0487896  0.0488432 ) ph/cm2/s
Energy fluence (15-150 keV)             : 6.74298e-07 ( -4.86407e-08  4.89775e-08 ) ergs/cm2
Cutoff power-law model

Time interval is from   -2.924 sec. to   10.032 sec.
Spectral model in the cutoff power-law:
------------------------------------------------------------
Parameters  : value       lower 90%   higher 90%
Photon index: 1.05340     ( -0.522716   0.462972 )
Epeak [keV] : 69.8693      ( -14.0444 60.3379 )
Norm@50keV  : 1.22066E-02    ( -0.00517871   0.0106881 )
------------------------------------------------------------
#Fit statistic : Chi-Squared =          54.09 using 59 PHA bins.
# Reduced chi-squared =         0.9659 for     56 degrees of freedom
# Null hypothesis probability =   5.475183e-01

Photon flux (15-150 keV)    in 12.96 sec: 0.722443 ( -0.050994  0.05096 ) ph/cm2/s
Energy fluence (15-150 keV)             : 6.39522e-07 ( -5.46575e-08  5.50476e-08 ) ergs/cm2
Band function

Time interval is from   -2.924 sec. to   10.032 sec.

Spectral model in the Band function:
------------------------------------------------------------
Parameters  : value       lower 90%   higher 90%
alpha       : -0.357688   ( -1.12704   0.344445 )
beta        : -1.94816    ( 1.94666   0.225159 )
Epeak [keV] : 45.3778      ( -19.1069 44.8556 )
Norm@50keV   : 3.60051E-02    ( -0.0389763   247.069 )
------------------------------------------------------------
#Fit statistic : Chi-Squared =          53.11 using 59 PHA bins.
# Reduced chi-squared =         0.9657 for     55 degrees of freedom
# Null hypothesis probability =   5.471075e-01

Photon flux (15-150 keV)    in 12.96 sec:  (    ) ph/cm2/s
Energy fluence (15-150 keV)             : 6.49834e-07 ( -6.49743e-07  -5.17545e-08 ) ergs/cm2
Single BB
Spectral model blackbody:
------------------------------------------------------------
Parameters  : value    Lower 90%  Upper 90%
kT [keV]    : 12.8230  (-0.983025  1.07556)
R^2/D10^2   : 0.142457  (-0.0364766   0.0485832)
(R is the radius in km and D10 is the distance to the source in units of 10 kpc)
------------------------------------------------------------
#Fit statistic : Chi-Squared =          95.59 using 59 PHA bins.
# Reduced chi-squared =          1.677 for     57 degrees of freedom
# Null hypothesis probability =   1.037561e-03

Energy  Fluence     90% Error
[keV]   [erg/cm2]   [erg/cm2]
15- 25  6.439e-08   7.122e-09
25- 50  2.185e-07   1.704e-08
50-150  2.253e-07   3.331e-08
15-150  5.082e-07   3.862e-08
Thermal bremsstrahlung (OTTB)

Spectral model: thermal bremsstrahlung
------------------------------------------------------------
Parameters  : value         Lower 90%    Upper 90%
kT [keV]    : 134.886       (-34.4012      47.4825)
Norm        : 3.08389       (-0.23668     0.282066)
------------------------------------------------------------
#Fit statistic : Chi-Squared =          54.75 using 59 PHA bins.
# Reduced chi-squared =         0.9605 for     57 degrees of freedom
# Null hypothesis probability =   5.599320e-01

Energy  Fluence     90% Error
[keV]   [erg/cm2]   [erg/cm2]
15- 25  1.035e-07   9.934e-09
25- 50  1.887e-07   1.970e-08
50-150  3.558e-07   1.316e-07
15-150  6.480e-07   1.372e-07
Double BB
Spectral model: bbodyrad<1> + bbodyrad<2>
------------------------------------------------------------
Parameters  : value         Lower 90%    Upper 90%
kT1 [keV]   : 7.21217        (-1.57113      1.70993)
R1^2/D10^2  : 0.745628        (-0.353496      0.903074)
kT2 [keV]   : 23.2885        (-4.99612      10.5555)
R2^2/D10^2  : 1.14352E-02    (-0.00860953   0.0113197)
------------------------------------------------------------
#Fit statistic : Chi-Squared =          53.77 using 59 PHA bins.
# Reduced chi-squared =         0.9777 for     55 degrees of freedom
# Null hypothesis probability =   5.215342e-01

Energy  Fluence     90% Error
[keV]   [erg/cm2]   [erg/cm2]
15- 25  9.768e-08   2.611e-08
25- 50  1.998e-07   4.495e-08
50-150  3.425e-07   1.613e-07
15-150  6.400e-07   2.087e-07
Peak spectrum fit
Power-law model
Time interval is from    0.076 sec. to    1.076 sec.

Spectral model in power-law:
------------------------------------------------------------
Parameters  : value       lower 90%   higher 90%
Photon index: 1.57879     ( -0.214823   0.219988 )
Norm@50keV  : 1.05963E-02    ( -0.00142255   0.00140453 )
------------------------------------------------------------
#Fit statistic : Chi-Squared =          58.63 using 59 PHA bins.
# Reduced chi-squared =          1.029 for     57 degrees of freedom
# Null hypothesis probability =   4.153679e-01

Photon flux (15-150 keV)    in 1 sec: 1.35288 ( -0.171856  0.171998 ) ph/cm2/s
Energy fluence (15-150 keV)             : 9.93636e-08 ( -1.43159e-08  1.45094e-08 ) ergs/cm2
Cutoff power-law model
Time interval is from    0.076 sec. to    1.076 sec.
Spectral model in the cutoff power-law:
------------------------------------------------------------
Parameters  : value       lower 90%   higher 90%
Photon index: 1.25074     ( -0.993838   0.527452 )
Epeak [keV] : 108.629      ( -82.6929 -108.65 )
Norm@50keV  : 1.58342E-02    ( -0.0158322   0.037015 )
------------------------------------------------------------
#Fit statistic : Chi-Squared =          58.18 using 59 PHA bins.
# Reduced chi-squared =          1.039 for     56 degrees of freedom
# Null hypothesis probability =   3.950229e-01

Photon flux (15-150 keV)    in 1 sec: 1.33751 ( -0.17668  0.17617 ) ph/cm2/s
Energy fluence (15-150 keV)             : 9.67645e-08 ( -1.60761e-08  1.57515e-08 ) ergs/cm2
Band function

Time interval is from    0.076 sec. to    1.076 sec.

Spectral model in the Band function:
------------------------------------------------------------
Parameters  : value       lower 90%   higher 90%
alpha       : -0.603743   ( 0.699935   5.60962 )
beta        : -1.76997    ( 1.76904   0.362344 )
Epeak [keV] : 52.5089      ( -52.5923 559.187 )
Norm@50keV   : 4.16825E-02    ( -0.042923   547.576 )
------------------------------------------------------------
#Fit statistic : Chi-Squared =          57.65 using 59 PHA bins.
# Reduced chi-squared =          1.048 for     55 degrees of freedom
# Null hypothesis probability =   3.775881e-01

Photon flux (15-150 keV)    in 1 sec:  (    ) ph/cm2/s
Energy fluence (15-150 keV)             : 9.68093e-08 ( 0  0 ) ergs/cm2
Single BB
Spectral model blackbody:
------------------------------------------------------------
Parameters  : value    Lower 90%  Upper 90%
kT [keV]    : 13.1362  (-1.97752  2.40164)
R^2/D10^2   : 0.242784  (-0.109598   0.192828)
(R is the radius in km and D10 is the distance to the source in units of 10 kpc)
------------------------------------------------------------
#Fit statistic : Chi-Squared =          71.57 using 59 PHA bins.
# Reduced chi-squared =          1.256 for     57 degrees of freedom
# Null hypothesis probability =   9.269649e-02

Energy  Fluence     90% Error
[keV]   [erg/cm2]   [erg/cm2]
15- 25  8.884e-09   2.069e-09
25- 50  3.094e-08   5.240e-09
50-150  3.396e-08   9.795e-09
15-150  7.378e-08   1.464e-08
Thermal bremsstrahlung (OTTB)
Spectral model: thermal bremsstrahlung
------------------------------------------------------------
Parameters  : value         Lower 90%    Upper 90%
kT [keV]    : 183.836       (-83.9299      -182.602)
Norm        : 5.53456       (-0.714447     0.856759)
------------------------------------------------------------
#Fit statistic : Chi-Squared =          58.15 using 59 PHA bins.
# Reduced chi-squared =          1.020 for     57 degrees of freedom
# Null hypothesis probability =   4.327200e-01

Energy  Fluence     90% Error
[keV]   [erg/cm2]   [erg/cm2]
15- 25  1.392e-08   7.840e-09
25- 50  2.652e-08   1.441e-08
50-150  5.658e-08   3.137e-08
15-150  9.702e-08   5.335e-08
Double BB

Spectral model: bbodyrad<1> + bbodyrad<2>
------------------------------------------------------------
Parameters  : value         Lower 90%    Upper 90%
kT1 [keV]   : 8.59754        (-3.19457      2.66673)
R1^2/D10^2  : 0.835706        (-0.469765      0.720295)
kT2 [keV]   : 36.2461        (-30.9332      -36.3385)
R2^2/D10^2  : 4.88118E-03    (-0.00473141   0.0489086)
------------------------------------------------------------
#Fit statistic : Chi-Squared =          57.94 using 59 PHA bins.
# Reduced chi-squared =          1.053 for     55 degrees of freedom
# Null hypothesis probability =   3.674851e-01

Energy  Fluence     90% Error
[keV]   [erg/cm2]   [erg/cm2]
15- 25  1.261e-08   6.849e-09
25- 50  2.903e-08   1.424e-08
50-150  5.703e-08   3.004e-08
15-150  9.867e-08   4.521e-08
Pre-slew spectrum (Pre-slew PHA with pre-slew DRM)
Power-law model

Spectral model in power-law:
------------------------------------------------------------
Parameters  : value       lower 90%   higher 90%
Photon index: 1.68877     ( -0.11121   0.112703 )
Norm@50keV  : 5.61429E-03    ( -0.000386295   0.000383814 )
------------------------------------------------------------
#Fit statistic : Chi-Squared =          59.81 using 59 PHA bins.
# Reduced chi-squared =          1.049 for     57 degrees of freedom
# Null hypothesis probability =   3.741043e-01

Photon flux (15-150 keV)    in 12.96 sec: 0.742739 ( -0.0487896  0.0488432 ) ph/cm2/s
Energy fluence (15-150 keV)             : 6.74298e-07 ( -4.86407e-08  4.89775e-08 ) ergs/cm2
Cutoff power-law model
Spectral model in the cutoff power-law:
------------------------------------------------------------
Parameters  : value       lower 90%   higher 90%
Photon index: 1.05340     ( -0.522716   0.462972 )
Epeak [keV] : 69.8693      ( -14.0444 60.3379 )
Norm@50keV  : 1.22066E-02    ( -0.00517871   0.0106881 )
------------------------------------------------------------
#Fit statistic : Chi-Squared =          54.09 using 59 PHA bins.
# Reduced chi-squared =         0.9659 for     56 degrees of freedom
# Null hypothesis probability =   5.475183e-01

Photon flux (15-150 keV)    in 12.96 sec: 0.722443 ( -0.050994  0.05096 ) ph/cm2/s
Energy fluence (15-150 keV)             : 6.39522e-07 ( -5.46575e-08  5.50476e-08 ) ergs/cm2
Band function
Spectral model in the Band function:
------------------------------------------------------------
Parameters  : value       lower 90%   higher 90%
alpha       : -0.357688   ( -1.12704   0.344445 )
beta        : -1.94816    ( 1.94666   0.225159 )
Epeak [keV] : 45.3778      ( -19.1069 44.8556 )
Norm@50keV   : 3.60051E-02    ( -0.0389763   247.069 )
------------------------------------------------------------
#Fit statistic : Chi-Squared =          53.11 using 59 PHA bins.
# Reduced chi-squared =         0.9657 for     55 degrees of freedom
# Null hypothesis probability =   5.471075e-01

Photon flux (15-150 keV)    in 12.96 sec:  (    ) ph/cm2/s
Energy fluence (15-150 keV)             : 6.49834e-07 ( -6.49743e-07  -5.17545e-08 ) ergs/cm2
S(25-50 keV) vs. S(50-100 keV) plot
S(25-50 keV)  = 1.82e-07
S(50-100 keV) = 2.25e-07
T90 vs. Hardness ratio plot

T90                                   = 11.3200000226498 sec.
Hardness ratio (energy fluence ratio) = 1.23626
Color vs. Color plot
Count Ratio  (25-50 keV) / (15-25 keV) = 1.3757
Count Ratio (50-100 keV) / (15-25 keV) = 0.878035
Mask shadow pattern
IMX = -6.832624245448796E-01, IMY = -1.574307026352405E-02
TIME vs. PHA plot around the trigger time
Blue+Cyan dotted lines: Time interval of the scaled map
From 0.000000 to 1.024000
TIME vs. DetID plot around the trigger time

Blue+Cyan dotted lines: Time interval of the scaled map
From 0.000000 to 1.024000
100 us light curve (15-350 keV)
Blue+Cyan dotted lines: Time interval of the scaled map
From 0.000000 to 1.024000
Spacecraft aspect plot
Bright source in the pre-burst/pre-slew/post-slew images
Pre-burst image of 15-350 keV band
Time interval of the image:
-299.960000 -2.924000

# RAcent  DECcent POSerr Theta    Phi  PeakCts   SNR AngSep     Name
#  [deg]    [deg]    ['] [deg]  [deg]                   [']
 83.6193  22.0333    0.6  31.7   82.1  11.4833  19.5    1.4	Crab
 83.4875 -15.5563    2.4  46.0  139.9   4.5135   4.7 ------	UNKNOWN
 49.0711   5.7897    2.5  11.2 -166.4   1.2923   4.6 ------	UNKNOWN
 45.9057 -41.6784    3.1  58.7 -169.2   5.2801   3.7 ------	UNKNOWN
 32.7019 -28.8093    2.3  48.8 -152.4   2.8944   4.9 ------	UNKNOWN
  0.6228  54.9827    2.4  53.7  -26.1   3.8616   4.7 ------	UNKNOWN
  5.3909  22.2703    2.8  42.6  -68.4   3.8843   4.1 ------	UNKNOWN
Pre-slew background subtracted image of 15-350 keV band
Time interval of the image:
-2.924000 10.032000

# RAcent  DECcent POSerr Theta    Phi  PeakCts   SNR AngSep     Name
#  [deg]    [deg]    ['] [deg]  [deg]                   [']
 83.6345  22.1216    6.2  31.7   81.9   0.1233   1.9    6.4	Crab
 55.1947 -17.1353    0.5  34.4  178.7   1.0982  24.1 ------	UNKNOWN
 10.4409  68.0626    2.6  57.1   -9.8   0.7382   4.5 ------	UNKNOWN
359.7046  61.5769    2.4  57.0  -19.2   0.6855   4.9 ------	UNKNOWN
Post-slew image of 15-350 keV band
Time interval of the image:
69.940600 302.111700

# RAcent  DECcent POSerr Theta    Phi  PeakCts   SNR AngSep     Name
#  [deg]    [deg]    ['] [deg]  [deg]                   [']
 87.8213  11.2216    2.8  42.9   57.3   4.2017   4.1 ------	UNKNOWN
 88.3087 -36.3918    2.3  35.0  136.3   1.9747   5.1 ------	UNKNOWN
 67.1089 -44.5274    3.0  29.2  168.8   0.9823   3.9 ------	UNKNOWN
 61.7247 -75.2178    2.9  58.2 -175.6   4.9000   4.0 ------	UNKNOWN
 31.1880 -42.1362    2.6  32.3 -139.3   1.1396   4.4 ------	UNKNOWN
 26.2761 -74.1190    2.3  59.2 -164.8   6.0172   5.0 ------	UNKNOWN
 20.1637 -56.9049    2.6  47.6 -148.5   2.0806   4.4 ------	UNKNOWN
Plot creation:
Sun May 31 14:07:08 EDT 2015