Special notes of this burst
Image
Pre-slew 15.0-350.0 keV image (Event data)
#   RAcent    DECcent   POSerr    Theta     Phi              Peak Cts       SNR   Name
  254.2420   -30.8131   0.0041    27.1172    27.0588         2.6306663     47.362 TRIG_00192152

Foreground time interval of the image:
 -7.000   5.524 (delta_t =  12.524 [sec])
Background time interval of the image:
-254.019  -7.000 (delta_t = 247.019 [sec])
Lightcurves
Notes:
- 1) The mask-weighted light curves are using the flight position.
- 2) Multiple plots of different time binning/intervals are shown to cover all scenarios of short/long GRBs, rate/image triggers, and real/false positives.
- 3) For all the mask-weighted lightcurves, the y-axis units are counts/sec/det where a det is 0.4 x 0.4 = 0.16 sq cm.
- 4) The verticle lines correspond to following: green dotted lines are T50 interval, black dotted lines are T90 interval, blue solid line(s) is a spacecraft slew start time, and orange solid line(s) is a spacecraft slew end time.
- 5) Time of each bin is in the middle of the bin.
1 s binning
From T0-310 s to T0+310 s
From T100_start - 20 s to T100_end + 30 s
Full time interval
64 ms binning
Full time interval
From T100_start to T100_end
From T0-5 sec to T0+5 sec
16 ms binning
From T100_start-5 s to T100_start+5 s
Blue+Cyan dotted lines: Time interval of the scaled map
From 0.000000 to 1.024000
8 ms binning
From T100_start-3 s to T100_start+3 s
Blue+Cyan dotted lines: Time interval of the scaled map
From 0.000000 to 1.024000
2 ms binning
From T100_start-1 s to T100_start+1 s
Blue+Cyan dotted lines: Time interval of the scaled map
From 0.000000 to 1.024000
SN=5 or 10 sec. binning (whichever binning is satisfied first)
SN=5 or 10 sec. binning (T < 200 sec)
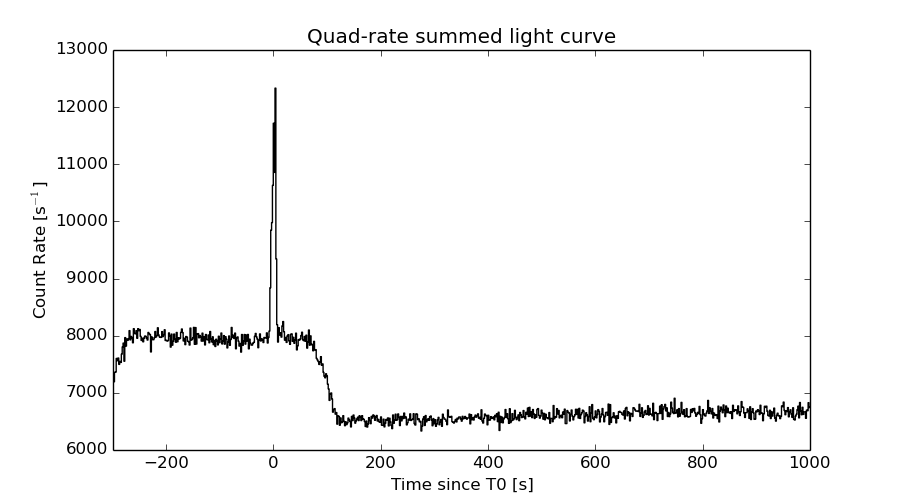
Quad-rate summed light curves (from T0-300s to T0+1000s)
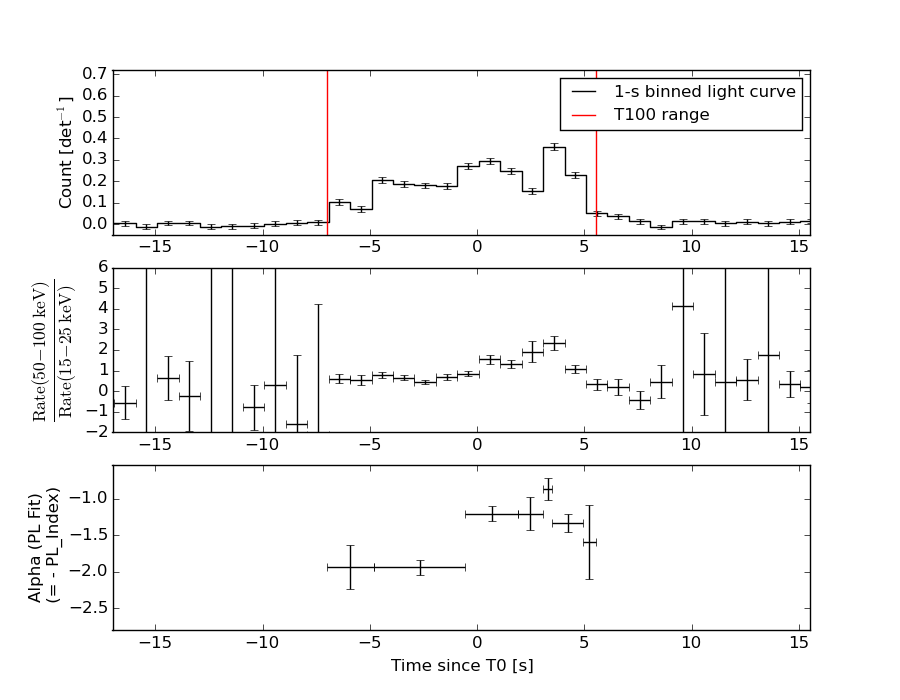
Spectral Evolution
Spectra
Notes:
- 1) The fitting includes the systematic errors.
- 2) When the burst includes telescope slew time periods, the fitting uses an average response file made from multiple 5-s response files through out the slew time plus single time preiod for the non-slew times, and weighted by the total counts in the corresponding time period using addrmf. An average response file is needed becuase a spectral fit using the pre-slew DRM will introduce some errors in both a spectral shape and a normalization if the PHA file contains a lot of the slew/post-slew time interval.
- 3) For fits to more complicated models (e.g. a power-law over a cutoff power-law), the BAT team has decided to require a chi-square improvement of more than 6 for each extra dof.
Time averaged spectrum fit using the average DRM
Power-law model

Time interval is from   -7.000 sec. to    5.524 sec.

Spectral model in power-law:
------------------------------------------------------------
Parameters  : value       lower 90%   higher 90%
Photon index: 1.47468     ( -0.0639856   0.0638907 )
Norm@50keV  : 1.34234E-02    ( -0.000440381   0.000440381 )
------------------------------------------------------------
#Fit statistic : Chi-Squared =          39.52 using 59 PHA bins.
# Reduced chi-squared =         0.6934 for     57 degrees of freedom
# Null hypothesis probability =   9.623276e-01

Photon flux (15-150 keV)    in 12.52 sec: 1.66461 ( -0.0608318  0.0610555 ) ph/cm2/s
Energy fluence (15-150 keV)             : 1.60112e-06 ( -5.54716e-08  5.56587e-08 ) ergs/cm2
Cutoff power-law model

Time interval is from   -7.000 sec. to    5.524 sec.
Spectral model in the cutoff power-law:
------------------------------------------------------------
Parameters  : value       lower 90%   higher 90%
Photon index: 1.47180     ( -0.120403   0.0922751 )
Epeak [keV] : 9999.17      (   )
Norm@50keV  : 1.34653E-02    ( -0.00044185   0.00181053 )
------------------------------------------------------------
#Fit statistic : Chi-Squared =          39.57 using 59 PHA bins.
# Reduced chi-squared =         0.7066 for     56 degrees of freedom
# Null hypothesis probability =   9.527663e-01

Photon flux (15-150 keV)    in 12.52 sec: 1.66437 ( -0.06134  0.06031 ) ph/cm2/s
Energy fluence (15-150 keV)             : 1.60079e-06 ( -5.46623e-08  5.61146e-08 ) ergs/cm2
Band function

Time interval is from   -7.000 sec. to    5.524 sec.

Spectral model in the Band function:
------------------------------------------------------------
Parameters  : value       lower 90%   higher 90%
alpha       : -1.11087   ( 1.11058   1.11058 )
beta        : -1.47546    ( 1.47546   0.0645227 )
Epeak [keV] : 48.7279      ( -48.6777 -48.6777 )
Norm@50keV   : 2.70098E-02    ( -0.0140772   0 )
------------------------------------------------------------
#Fit statistic : Chi-Squared =          39.52 using 59 PHA bins.
# Reduced chi-squared =         0.7185 for     55 degrees of freedom
# Null hypothesis probability =   9.427378e-01

Photon flux (15-150 keV)    in 12.52 sec:  (    ) ph/cm2/s
Energy fluence (15-150 keV)             : 0 ( 0  0 ) ergs/cm2
Single BB
Spectral model blackbody:
------------------------------------------------------------
Parameters  : value    Lower 90%  Upper 90%
kT [keV]    : 17.5882  (  )
R^2/D10^2   : 0.103855  (   )
(R is the radius in km and D10 is the distance to the source in units of 10 kpc)
------------------------------------------------------------
#Fit statistic : Chi-Squared =         294.61 using 59 PHA bins.
# Reduced chi-squared =         5.1686 for     57 degrees of freedom
# Null hypothesis probability =   9.600149e-34

Energy  Fluence     90% Error
[keV]   [erg/cm2]   [erg/cm2]
15- 25  8.112e-08   5.747e-09
25- 50  3.686e-07   1.784e-08
50-150  8.225e-07   4.507e-08
15-150  1.272e-06   5.039e-08
Thermal bremsstrahlung (OTTB)
Spectral model: thermal bremsstrahlung
------------------------------------------------------------
Parameters  : value         Lower 90%    Upper 90%
kT [keV]    : 200.000       (      )
Norm        : 6.85228       (-0.22566     0.225625)
------------------------------------------------------------
#Fit statistic : Chi-Squared =          57.69 using 59 PHA bins.
# Reduced chi-squared =          1.012 for     57 degrees of freedom
# Null hypothesis probability =   4.496957e-01

Energy  Fluence     90% Error
[keV]   [erg/cm2]   [erg/cm2]
15- 25  2.137e-07   7.888e-09
25- 50  4.111e-07   1.496e-08
50-150  9.015e-07   3.280e-08
15-150  1.526e-06   5.509e-08
Double BB
Spectral model: bbodyrad<1> + bbodyrad<2>
------------------------------------------------------------
Parameters  : value         Lower 90%    Upper 90%
kT1 [keV]   : 6.94216        (-0.725981      0.803765)
R1^2/D10^2  : 1.84268        (-0.601592      0.956248)
kT2 [keV]   : 30.1720        (-3.0677      4.121)
R2^2/D10^2  : 1.39204E-02    (-0.00481176   0.00620396)
------------------------------------------------------------
#Fit statistic : Chi-Squared =          41.97 using 59 PHA bins.
# Reduced chi-squared =         0.7631 for     55 degrees of freedom
# Null hypothesis probability =   9.017451e-01

Energy  Fluence     90% Error
[keV]   [erg/cm2]   [erg/cm2]
15- 25  2.018e-07   2.141e-08
25- 50  3.916e-07   3.130e-08
50-150  1.020e-06   1.008e-07
15-150  1.613e-06   1.058e-07
Peak spectrum fit
Power-law model

Time interval is from    3.008 sec. to    4.008 sec.

Spectral model in power-law:
------------------------------------------------------------
Parameters  : value       lower 90%   higher 90%
Photon index: 0.953140     ( -0.11875   0.116588 )
Norm@50keV  : 2.50310E-02    ( -0.00170011   0.00169254 )
------------------------------------------------------------
#Fit statistic : Chi-Squared =          56.06 using 59 PHA bins.
# Reduced chi-squared =         0.9835 for     57 degrees of freedom
# Null hypothesis probability =   5.102824e-01

Photon flux (15-150 keV)    in 1 sec: 2.87611 ( -0.197685  0.198157 ) ph/cm2/s
Energy fluence (15-150 keV)             : 2.75312e-07 ( -1.93733e-08  1.9392e-08 ) ergs/cm2
Cutoff power-law model
Time interval is from    3.008 sec. to    4.008 sec.
Spectral model in the cutoff power-law:
------------------------------------------------------------
Parameters  : value       lower 90%   higher 90%
Photon index: 0.559664     ( -0.513367   0.432654 )
Epeak [keV] : 223.427      ( -92.2531 -223.427 )
Norm@50keV  : 3.65100E-02    ( -0.0121395   0.0217738 )
------------------------------------------------------------
#Fit statistic : Chi-Squared =          53.91 using 59 PHA bins.
# Reduced chi-squared =         0.9626 for     56 degrees of freedom
# Null hypothesis probability =   5.545491e-01

Photon flux (15-150 keV)    in 1 sec: 2.82557 ( -0.2058  0.20624 ) ph/cm2/s
Energy fluence (15-150 keV)             : 2.71923e-07 ( -2.0153e-08  2.0039e-08 ) ergs/cm2
Band function
Time interval is from    3.008 sec. to    4.008 sec.

Spectral model in the Band function:
------------------------------------------------------------
Parameters  : value       lower 90%   higher 90%
alpha       : 5.00000   ( -5   -5 )
beta        : -0.970826    ( -0.117586   0.120468 )
Epeak [keV] : 23.3947      ( -19.7045 46.7974 )
Norm@50keV   : 2379.40    ( -154.804   3.81437e+06 )
------------------------------------------------------------
#Fit statistic : Chi-Squared =          55.19 using 59 PHA bins.
# Reduced chi-squared =          1.003 for     55 degrees of freedom
# Null hypothesis probability =   4.674530e-01

Photon flux (15-150 keV)    in 1 sec:  (    ) ph/cm2/s
Energy fluence (15-150 keV)             : 0 ( 0  0 ) ergs/cm2
Single BB
Spectral model blackbody:
------------------------------------------------------------
Parameters  : value    Lower 90%  Upper 90%
kT [keV]    : 24.2593  (-2.11318  2.40231)
R^2/D10^2   : 7.73844E-02  (-0.0194403   0.0252171)
(R is the radius in km and D10 is the distance to the source in units of 10 kpc)
------------------------------------------------------------
#Fit statistic : Chi-Squared =          80.35 using 59 PHA bins.
# Reduced chi-squared =          1.410 for     57 degrees of freedom
# Null hypothesis probability =   2.248787e-02

Energy  Fluence     90% Error
[keV]   [erg/cm2]   [erg/cm2]
15- 25  8.037e-09   1.129e-09
25- 50  4.489e-08   4.625e-09
50-150  1.966e-07   1.910e-08
15-150  2.495e-07   1.930e-08
Thermal bremsstrahlung (OTTB)
Spectral model: thermal bremsstrahlung
------------------------------------------------------------
Parameters  : value         Lower 90%    Upper 90%
kT [keV]    : 199.363       (      )
Norm        : 11.8309       (     )
------------------------------------------------------------
#Fit statistic : Chi-Squared =         126.97 using 59 PHA bins.
# Reduced chi-squared =         2.2276 for     57 degrees of freedom
# Null hypothesis probability =   3.029174e-07

Energy  Fluence     90% Error
[keV]   [erg/cm2]   [erg/cm2]
15- 25  2.946e-08   2.525e-09
25- 50  5.667e-08   8.000e-09
50-150  1.243e-07   3.763e-08
15-150  2.104e-07   3.880e-08
Double BB
Spectral model: bbodyrad<1> + bbodyrad<2>
------------------------------------------------------------
Parameters  : value         Lower 90%    Upper 90%
kT1 [keV]   : 6.76883        (-2.04817      3.17474)
R1^2/D10^2  : 1.89403        (-1.33882      5.59174)
kT2 [keV]   : 30.9447        (-4.2909      7.69816)
R2^2/D10^2  : 3.34873E-02    (-0.0172911   0.0125835)
------------------------------------------------------------
#Fit statistic : Chi-Squared =          52.37 using 59 PHA bins.
# Reduced chi-squared =         0.9522 for     55 degrees of freedom
# Null hypothesis probability =   5.757267e-01

Energy  Fluence     90% Error
[keV]   [erg/cm2]   [erg/cm2]
15- 25  1.837e-08   8.266e-09
25- 50  4.797e-08   1.294e-08
50-150  2.078e-07   4.020e-08
15-150  2.742e-07   4.715e-08
Pre-slew spectrum (Pre-slew PHA with pre-slew DRM)
Power-law model

Spectral model in power-law:
------------------------------------------------------------
Parameters  : value       lower 90%   higher 90%
Photon index: 1.47468     ( -0.0639856   0.0638907 )
Norm@50keV  : 1.34234E-02    ( -0.000440381   0.000440381 )
------------------------------------------------------------
#Fit statistic : Chi-Squared =          39.52 using 59 PHA bins.
# Reduced chi-squared =         0.6934 for     57 degrees of freedom
# Null hypothesis probability =   9.623276e-01

Photon flux (15-150 keV)    in 12.52 sec: 1.66461 ( -0.0608318  0.0610555 ) ph/cm2/s
Energy fluence (15-150 keV)             : 1.60112e-06 ( -5.54716e-08  5.56587e-08 ) ergs/cm2
Cutoff power-law model

Spectral model in the cutoff power-law:
------------------------------------------------------------
Parameters  : value       lower 90%   higher 90%
Photon index: 1.47180     ( -0.120403   0.0922751 )
Epeak [keV] : 9999.17      (   )
Norm@50keV  : 1.34653E-02    ( -0.00044185   0.00181053 )
------------------------------------------------------------
#Fit statistic : Chi-Squared =          39.57 using 59 PHA bins.
# Reduced chi-squared =         0.7066 for     56 degrees of freedom
# Null hypothesis probability =   9.527663e-01

Photon flux (15-150 keV)    in 12.52 sec: 1.66437 ( -0.06134  0.06031 ) ph/cm2/s
Energy fluence (15-150 keV)             : 1.60079e-06 ( -5.46623e-08  5.61146e-08 ) ergs/cm2
Band function
Spectral model in the Band function:
------------------------------------------------------------
Parameters  : value       lower 90%   higher 90%
alpha       : -1.11087   ( 1.11058   1.11058 )
beta        : -1.47546    ( 1.47546   0.0645227 )
Epeak [keV] : 48.7279      ( -48.6777 -48.6777 )
Norm@50keV   : 2.70098E-02    ( -0.0140772   0 )
------------------------------------------------------------
#Fit statistic : Chi-Squared =          39.52 using 59 PHA bins.
# Reduced chi-squared =         0.7185 for     55 degrees of freedom
# Null hypothesis probability =   9.427378e-01

Photon flux (15-150 keV)    in 12.52 sec:  (    ) ph/cm2/s
Energy fluence (15-150 keV)             : 0 ( 0  0 ) ergs/cm2
S(25-50 keV) vs. S(50-100 keV) plot
S(25-50 keV)  = 3.91e-07
S(50-100 keV) = 5.63e-07
T90 vs. Hardness ratio plot
T90                                   = 10.3600000143051 sec.
Hardness ratio (energy fluence ratio) = 1.4399
Color vs. Color plot

Count Ratio  (25-50 keV) / (15-25 keV) = 1.32044
Count Ratio (50-100 keV) / (15-25 keV) = 1.0411
Mask shadow pattern
IMX = 4.560496767471577E-01, IMY = -2.329586767562424E-01
TIME vs. PHA plot around the trigger time
Blue+Cyan dotted lines: Time interval of the scaled map
From 0.000000 to 1.024000
TIME vs. DetID plot around the trigger time
Blue+Cyan dotted lines: Time interval of the scaled map
From 0.000000 to 1.024000
100 us light curve (15-350 keV)
Blue+Cyan dotted lines: Time interval of the scaled map
From 0.000000 to 1.024000
Spacecraft aspect plot
Bright source in the pre-burst/pre-slew/post-slew images
Pre-burst image of 15-350 keV band
Time interval of the image:
-254.019410 -7.000000

# RAcent  DECcent POSerr Theta    Phi  PeakCts   SNR AngSep     Name
#  [deg]    [deg]    ['] [deg]  [deg]                   [']
244.9863 -15.6529    0.5  23.8   67.5   9.5413  22.3    0.9	Sco X-1
254.5214  35.3496    4.6  43.8  166.0   1.2774   2.5    3.2	Her X-1
255.9630 -37.8141    1.7  32.8   18.4   2.6669   6.8    2.1	4U 1700-377
256.5883 -36.5833    5.3  31.5   18.4   0.8236   2.2   12.1	GX 349+2
263.0277 -24.7834    6.4  18.6   14.3   0.4769   1.8    2.5	GX 1+4
264.7424 -44.4504   69.0  37.8    4.6  -0.0706  -0.2    0.0	4U 1735-44
268.5183  -1.4832    9.2   5.3 -168.0   0.3505   1.3    9.2	SW J1753.5-0127
270.3048 -25.0776    2.9  18.5   -6.5   1.0231   4.0    1.1	GX 5-1
270.2680 -25.7874    7.3  19.2   -6.1   0.4126   1.6    3.2	GRS 1758-258
274.0592 -13.8951    4.9   9.6  -39.9   0.6440   2.3    9.0	GX 17+2
275.9692 -30.2937    3.8  24.9  -16.1   0.8480   3.0    5.0	H1820-303
284.8982 -24.9693    3.4  24.7  -39.0   0.9919   3.4    8.1	HT1900.1-2455
288.8172  10.9149    1.1  27.6 -128.3   3.2875  10.2    2.1	GRS 1915+105
299.5863  35.2024    1.1  51.7 -145.1   7.8246  10.3    0.2	Cyg X-1
262.9097 -33.9827   35.2  27.6    9.7   0.1053   0.3    9.7	GX 354-0
233.8925 -23.5960    2.3  36.4   60.1   3.5379   5.0 ------	UNKNOWN
255.2011 -41.6188    2.0  36.6   16.9   2.4160   5.7 ------	UNKNOWN
259.0190  49.9164    2.0  57.1  174.9   9.2007   5.9 ------	UNKNOWN
282.0096   7.5560    2.8  20.3 -133.1   1.0690   4.2 ------	UNKNOWN
311.0056 -50.5345    2.5  56.7  -30.1   6.9023   4.5 ------	UNKNOWN
Pre-slew background subtracted image of 15-350 keV band
Time interval of the image:
-7.000000 5.524000

# RAcent  DECcent POSerr Theta    Phi  PeakCts   SNR AngSep     Name
#  [deg]    [deg]    ['] [deg]  [deg]                   [']
244.9637 -15.5448    8.6  23.8   67.7   0.0763   1.3    5.8	Sco X-1
254.4950  35.4672   80.2  43.9  166.0  -0.0116  -0.1    7.7	Her X-1
255.9342 -37.7092    3.6  32.7   18.5  -0.1776  -3.2    8.5	4U 1700-377
256.5974 -36.3804   10.5  31.3   18.5   0.0548   1.1    8.2	GX 349+2
263.0922 -24.8715    9.3  18.6   14.1   0.0542   1.2    8.8	GX 1+4
264.5748 -44.3943   16.2  37.8    4.8  -0.0479  -0.7    7.9	4U 1735-44
268.2225  -1.6061    0.0   5.2 -171.0   0.0890   2.2   12.7	SW J1753.5-0127
270.4438 -25.1508    5.2  18.6   -6.9   0.0925   2.2    9.7	GX 5-1
270.2120 -25.8306    5.6  19.3   -5.9  -0.0883  -2.0    7.2	GRS 1758-258
274.0342 -14.1843    9.7   9.8  -38.7  -0.0500  -1.2    9.0	GX 17+2
275.7742 -30.5292    0.0  25.0  -15.6  -0.0844  -1.9   12.5	H1820-303
285.0659 -24.7699   15.2  24.6  -39.6   0.0350   0.8    9.2	HT1900.1-2455
288.9474  10.9119    4.8  27.7 -128.1  -0.1242  -2.4    9.0	GRS 1915+105
299.6817  35.0380    4.2  51.6 -144.8  -0.3687  -2.8   10.8	Cyg X-1
262.9699 -33.6848    4.7  27.3    9.7   0.1230   2.5    9.0	GX 354-0
254.2419 -30.8131    0.2  27.1   27.1   2.6309  47.4 ------	UNKNOWN
290.2044  49.4603    4.1  59.6 -161.7   0.6662   2.8 ------	UNKNOWN
304.0631  30.3868    2.8  51.0 -137.3   0.7637   4.0 ------	UNKNOWN
Post-slew image of 15-350 keV band
Time interval of the image:
130.780590 302.250000

# RAcent  DECcent POSerr Theta    Phi  PeakCts   SNR AngSep     Name
#  [deg]    [deg]    ['] [deg]  [deg]                   [']
244.9770 -15.6226    0.9  48.0   -1.8   4.6785  12.5    1.1	Sco X-1
254.5317  35.3945    2.4  11.0 -107.6   0.7721   4.9    4.8	Her X-1
268.3566  -1.5872    3.3  42.2  -39.4   0.9342   3.5    8.1	SW J1753.5-0127
210.2569  30.9443    3.2  26.8   97.8   0.9486   3.6 ------	UNKNOWN
330.5658  74.1730    3.0  58.7 -159.2   3.7844   3.9 ------	UNKNOWN
287.6088  24.1895    2.2  40.8  -88.3   3.1507   5.3 ------	UNKNOWN
Plot creation:
Sun May 31 14:05:00 EDT 2015