Click here for the BAT GCN circular template
Image
Pre-slew 15.0-350.0 keV image (Event data)

#   RAcent    DECcent   POSerr    Theta     Phi              Peak Cts       SNR   Name
   45.7839    12.8248   0.0051     6.0398  -126.4899         2.7698100     37.804 TRIG_00201391

Foreground time interval of the image:
-29.272  10.877 (delta_t =  40.149 [sec])
Background time interval of the image:
-299.824 -29.272 (delta_t = 270.552 [sec])
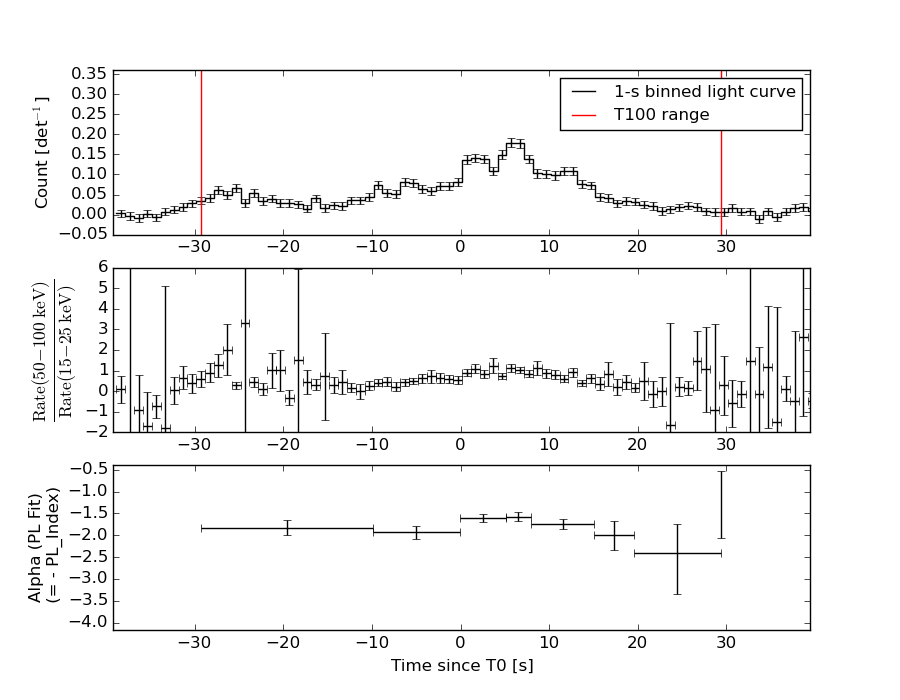
Lightcurves
Notes:
- 1) The mask-weighted light curves are using the flight position.
- 2) Multiple plots of different time binning/intervals are shown to cover all scenarios of short/long GRBs, rate/image triggers, and real/false positives.
- 3) For all the mask-weighted lightcurves, the y-axis units are counts/sec/det where a det is 0.4 x 0.4 = 0.16 sq cm.
- 4) The verticle lines correspond to following: green dotted lines are T50 interval, black dotted lines are T90 interval, blue solid line(s) is a spacecraft slew start time, and orange solid line(s) is a spacecraft slew end time.
- 5) Time of each bin is in the middle of the bin.
1 s binning
From T0-310 s to T0+310 s

From T100_start - 20 s to T100_end + 30 s

Full time interval

64 ms binning
Full time interval

From T100_start to T100_end

From T0-5 sec to T0+5 sec

16 ms binning
From T100_start-5 s to T100_start+5 s

Blue+Cyan dotted lines: Time interval of the scaled map
From 0.000000 to 1.024000
8 ms binning
From T100_start-3 s to T100_start+3 s

Blue+Cyan dotted lines: Time interval of the scaled map
From 0.000000 to 1.024000
2 ms binning
From T100_start-1 s to T100_start+1 s

Blue+Cyan dotted lines: Time interval of the scaled map
From 0.000000 to 1.024000
SN=5 or 10 sec. binning (whichever binning is satisfied first)

SN=5 or 10 sec. binning (T < 200 sec)

Quad-rate summed light curves (from T0-300s to T0+1000s)

Spectral Evolution
Spectra
Notes:
- 1) The fitting includes the systematic errors.
- 2) When the burst includes telescope slew time periods, the fitting uses an average response file made from multiple 5-s response files through out the slew time plus single time preiod for the non-slew times, and weighted by the total counts in the corresponding time period using addrmf. An average response file is needed becuase a spectral fit using the pre-slew DRM will introduce some errors in both a spectral shape and a normalization if the PHA file contains a lot of the slew/post-slew time interval.
- 3) For fits to more complicated models (e.g. a power-law over a cutoff power-law), the BAT team has decided to require a chi-square improvement of more than 6 for each extra dof.
Time averaged spectrum fit using the average DRM
Power-law model

Time interval is from  -29.272 sec. to   29.424 sec.

Spectral model in power-law:
------------------------------------------------------------
Parameters  : value       lower 90%   higher 90%
Photon index: 1.81702     ( -0.0732011   0.0739523 )
Norm@50keV  : 3.56648E-03    ( -0.000148136   0.000147382 )
------------------------------------------------------------
#Fit statistic : Chi-Squared =          56.74 using 59 PHA bins.
# Reduced chi-squared =         0.9955 for     57 degrees of freedom
# Null hypothesis probability =   4.846699e-01

Photon flux (15-150 keV)    in 58.7 sec: 0.494734 ( -0.0197327  0.0197747 ) ph/cm2/s
Energy fluence (15-150 keV)             : 1.92627e-06 ( -8.12443e-08  8.1664e-08 ) ergs/cm2
Cutoff power-law model

Time interval is from  -29.272 sec. to   29.424 sec.
Spectral model in the cutoff power-law:
------------------------------------------------------------
Parameters  : value       lower 90%   higher 90%
Photon index: 1.35252     ( -0.339936   0.312485 )
Epeak [keV] : 64.7005      ( -10.8605 38.286 )
Norm@50keV  : 6.26412E-03    ( -0.00193871   0.00314902 )
------------------------------------------------------------
#Fit statistic : Chi-Squared =          50.09 using 59 PHA bins.
# Reduced chi-squared =         0.8944 for     56 degrees of freedom
# Null hypothesis probability =   6.971669e-01

Photon flux (15-150 keV)    in 58.7 sec: 0.479862 ( -0.021924  0.021947 ) ph/cm2/s
Energy fluence (15-150 keV)             : 1.83749e-06 ( -9.99544e-08  1.00224e-07 ) ergs/cm2
Band function

Time interval is from  -29.272 sec. to   29.424 sec.

Spectral model in the Band function:
------------------------------------------------------------
Parameters  : value       lower 90%   higher 90%
alpha       : -0.826319   ( -0.586391   1.23407 )
beta        : -2.09455    ( -0.298122   0.190727 )
Epeak [keV] : 47.2146      ( -13.6824 17.2241 )
Norm@50keV   : 1.31801E-02    ( -0.00753887   0.0890022 )
------------------------------------------------------------
#Fit statistic : Chi-Squared =          45.72 using 59 PHA bins.
# Reduced chi-squared =         0.8313 for     55 degrees of freedom
# Null hypothesis probability =   8.093940e-01

Photon flux (15-150 keV)    in 58.7 sec:  (    ) ph/cm2/s
Energy fluence (15-150 keV)             : 1.83843e-06 ( -1.83802e-06  -9.41783e-08 ) ergs/cm2
Single BB

Spectral model blackbody:
------------------------------------------------------------
Parameters  : value    Lower 90%  Upper 90%
kT [keV]    : 11.9579  (  )
R^2/D10^2   : 0.115443  (   )
(R is the radius in km and D10 is the distance to the source in units of 10 kpc)
------------------------------------------------------------
#Fit statistic : Chi-Squared =         157.80 using 59 PHA bins.
# Reduced chi-squared =         2.7684 for     57 degrees of freedom
# Null hypothesis probability =   2.122432e-11

Energy  Fluence     90% Error
[keV]   [erg/cm2]   [erg/cm2]
15- 25  2.049e-07   1.608e-08
25- 50  6.421e-07   2.788e-08
50-150  5.508e-07   4.910e-08
15-150  1.398e-06   5.870e-08
Thermal bremsstrahlung (OTTB)

Spectral model: thermal bremsstrahlung
------------------------------------------------------------
Parameters  : value         Lower 90%    Upper 90%
kT [keV]    : 99.4147       (-14.0342      18.1289)
Norm        : 2.15973       (-0.12493     0.136449)
------------------------------------------------------------
#Fit statistic : Chi-Squared =          49.92 using 59 PHA bins.
# Reduced chi-squared =         0.8757 for     57 degrees of freedom
# Null hypothesis probability =   7.355996e-01

Energy  Fluence     90% Error
[keV]   [erg/cm2]   [erg/cm2]
15- 25  3.314e-07   2.589e-08
25- 50  5.723e-07   2.794e-08
50-150  9.243e-07   2.395e-07
15-150  1.828e-06   2.527e-07
Double BB

Spectral model: bbodyrad<1> + bbodyrad<2>
------------------------------------------------------------
Parameters  : value         Lower 90%    Upper 90%
kT1 [keV]   : 8.09246        (-1.06673      0.980695)
R1^2/D10^2  : 0.376038        (-0.112178      0.207333)
kT2 [keV]   : 29.3199        (-6.8129      12.8661)
R2^2/D10^2  : 2.75594E-03    (-0.00187913   0.00468739)
------------------------------------------------------------
#Fit statistic : Chi-Squared =          52.37 using 59 PHA bins.
# Reduced chi-squared =         0.9522 for     55 degrees of freedom
# Null hypothesis probability =   5.756670e-01

Energy  Fluence     90% Error
[keV]   [erg/cm2]   [erg/cm2]
15- 25  2.857e-07   2.897e-08
25- 50  6.054e-07   6.234e-08
50-150  9.540e-07   3.013e-07
15-150  1.845e-06   3.396e-07
Peak spectrum fit
Power-law model

Time interval is from    5.632 sec. to    6.632 sec.

Spectral model in power-law:
------------------------------------------------------------
Parameters  : value       lower 90%   higher 90%
Photon index: 1.52994     ( -0.151864   0.154172 )
Norm@50keV  : 1.19061E-02    ( -0.00115822   0.00114868 )
------------------------------------------------------------
#Fit statistic : Chi-Squared =          52.03 using 59 PHA bins.
# Reduced chi-squared =         0.9129 for     57 degrees of freedom
# Null hypothesis probability =   6.614711e-01

Photon flux (15-150 keV)    in 1 sec: 1.49865 ( -0.137139  0.137183 ) ph/cm2/s
Energy fluence (15-150 keV)             : 1.12417e-07 ( -1.19382e-08  1.20873e-08 ) ergs/cm2
Cutoff power-law model

Time interval is from    5.632 sec. to    6.632 sec.
Spectral model in the cutoff power-law:
------------------------------------------------------------
Parameters  : value       lower 90%   higher 90%
Photon index: 0.715615     ( -0.786651   0.662342 )
Epeak [keV] : 72.3026      ( -17.0943 106.687 )
Norm@50keV  : 3.29716E-02    ( -0.0183109   0.0544072 )
------------------------------------------------------------
#Fit statistic : Chi-Squared =          47.50 using 59 PHA bins.
# Reduced chi-squared =         0.8482 for     56 degrees of freedom
# Null hypothesis probability =   7.834271e-01

Photon flux (15-150 keV)    in 1 sec: 1.45672 ( -0.14151  0.14142 ) ph/cm2/s
Energy fluence (15-150 keV)             : 1.04134e-07 ( -1.34406e-08  1.3787e-08 ) ergs/cm2
Band function

Time interval is from    5.632 sec. to    6.632 sec.

Spectral model in the Band function:
------------------------------------------------------------
Parameters  : value       lower 90%   higher 90%
alpha       : 2.87263   ( -5.01438   -3.93736 )
beta        : -1.79764    ( -0.297388   0.245994 )
Epeak [keV] : 31.9870      ( -6.68747 29.4184 )
Norm@50keV   : 13.1321    ( -13.1238   204.806 )
------------------------------------------------------------
#Fit statistic : Chi-Squared =          45.30 using 59 PHA bins.
# Reduced chi-squared =         0.8237 for     55 degrees of freedom
# Null hypothesis probability =   8.214064e-01

Photon flux (15-150 keV)    in 1 sec:  (    ) ph/cm2/s
Energy fluence (15-150 keV)             : 1.07793e-07 ( -1.07786e-07  -1.24911e-08 ) ergs/cm2
Single BB

Spectral model blackbody:
------------------------------------------------------------
Parameters  : value    Lower 90%  Upper 90%
kT [keV]    : 13.2270  (-1.38754  1.57796)
R^2/D10^2   : 0.270139  (-0.0894322   0.130721)
(R is the radius in km and D10 is the distance to the source in units of 10 kpc)
------------------------------------------------------------
#Fit statistic : Chi-Squared =          63.50 using 59 PHA bins.
# Reduced chi-squared =          1.114 for     57 degrees of freedom
# Null hypothesis probability =   2.582916e-01

Energy  Fluence     90% Error
[keV]   [erg/cm2]   [erg/cm2]
15- 25  1.002e-08   1.750e-09
25- 50  3.515e-08   3.950e-09
50-150  3.927e-08   7.715e-09
15-150  8.445e-08   9.595e-09
Thermal bremsstrahlung (OTTB)

Spectral model: thermal bremsstrahlung
------------------------------------------------------------
Parameters  : value         Lower 90%    Upper 90%
kT [keV]    : 196.776       (-75.9343      -195.13)
Norm        : 6.15721       (-0.568028     0.615975)
------------------------------------------------------------
#Fit statistic : Chi-Squared =          49.20 using 59 PHA bins.
# Reduced chi-squared =         0.8631 for     57 degrees of freedom
# Null hypothesis probability =   7.591879e-01

Energy  Fluence     90% Error
[keV]   [erg/cm2]   [erg/cm2]
15- 25  1.536e-08   8.381e-09
25- 50  2.950e-08   1.322e-08
50-150  6.441e-08   3.311e-08
15-150  1.093e-07   5.810e-08
Double BB

Spectral model: bbodyrad<1> + bbodyrad<2>
------------------------------------------------------------
Parameters  : value         Lower 90%    Upper 90%
kT1 [keV]   : 6.86869        (-3.11472      3.63287)
R1^2/D10^2  : 1.39625        (-0.556385      1.8259)
kT2 [keV]   : 20.1356        (-8.52115      71.1294)
R2^2/D10^2  : 4.22973E-02    (-0.0153217   0.0609855)
------------------------------------------------------------
#Fit statistic : Chi-Squared =          47.78 using 59 PHA bins.
# Reduced chi-squared =         0.8688 for     55 degrees of freedom
# Null hypothesis probability =   7.442632e-01

Energy  Fluence     90% Error
[keV]   [erg/cm2]   [erg/cm2]
15- 25  1.367e-08   7.805e-09
25- 50  3.019e-08   1.616e-08
50-150  5.174e-08   2.933e-08
15-150  9.560e-08   5.150e-08
Pre-slew spectrum (Pre-slew PHA with pre-slew DRM)
Power-law model
Spectral model in power-law:
------------------------------------------------------------
Parameters  : value       lower 90%   higher 90%
Photon index: 1.77444     ( -0.0737066   0.0744015 )
Norm@50keV  : 4.23082E-03    ( -0.000179361   0.000178522 )
------------------------------------------------------------
#Fit statistic : Chi-Squared =          59.52 using 59 PHA bins.
# Reduced chi-squared =          1.044 for     57 degrees of freedom
# Null hypothesis probability =   3.839653e-01

Photon flux (15-150 keV)    in 40.15 sec: 0.577322 ( -0.0235614  0.0236033 ) ph/cm2/s
Energy fluence (15-150 keV)             : 1.56545e-06 ( -6.8255e-08  6.86139e-08 ) ergs/cm2
Cutoff power-law model
Spectral model in the cutoff power-law:
------------------------------------------------------------
Parameters  : value       lower 90%   higher 90%
Photon index: 1.21016     ( -0.350628   0.321864 )
Epeak [keV] : 65.0578      ( -9.86156 26.3979 )
Norm@50keV  : 8.39026E-03    ( -0.00266461   0.00438536 )
------------------------------------------------------------
#Fit statistic : Chi-Squared =          50.05 using 59 PHA bins.
# Reduced chi-squared =         0.8937 for     56 degrees of freedom
# Null hypothesis probability =   6.985329e-01

Photon flux (15-150 keV)    in 40.15 sec: 0.557505 ( -0.025902  0.025917 ) ph/cm2/s
Energy fluence (15-150 keV)             : 1.48005e-06 ( -8.26648e-08  8.30944e-08 ) ergs/cm2
Band function
Spectral model in the Band function:
------------------------------------------------------------
Parameters  : value       lower 90%   higher 90%
alpha       : -0.731500   ( -0.555619   1.19419 )
beta        : -2.11200    ( -0.330879   0.218764 )
Epeak [keV] : 49.6546      ( -13.6646 15.4394 )
Norm@50keV   : 1.64713E-02    ( -0.0088081   0.0957492 )
------------------------------------------------------------
#Fit statistic : Chi-Squared =          45.82 using 59 PHA bins.
# Reduced chi-squared =         0.8331 for     55 degrees of freedom
# Null hypothesis probability =   8.063361e-01

Photon flux (15-150 keV)    in 40.15 sec:  (    ) ph/cm2/s
Energy fluence (15-150 keV)             : 1.48585e-06 ( -1.48557e-06  -7.8152e-08 ) ergs/cm2
S(25-50 keV) vs. S(50-100 keV) plot

S(25-50 keV)  = 5.46e-07
S(50-100 keV) = 6.20e-07
T90 vs. Hardness ratio plot

T90                                   = 44.6560000181198 sec.
Hardness ratio (energy fluence ratio) = 1.13553
Color vs. Color plot

Count Ratio  (25-50 keV) / (15-25 keV) = 1.20815
Count Ratio (50-100 keV) / (15-25 keV) = 0.668214
Mask shadow pattern

IMX = -6.292077824691585E-02, IMY = 8.506399326064371E-02
TIME vs. PHA plot around the trigger time

Blue+Cyan dotted lines: Time interval of the scaled map
From 0.000000 to 1.024000
TIME vs. DetID plot around the trigger time

Blue+Cyan dotted lines: Time interval of the scaled map
From 0.000000 to 1.024000
100 us light curve (15-350 keV)

Blue+Cyan dotted lines: Time interval of the scaled map
From 0.000000 to 1.024000
Spacecraft aspect plot
Bright source in the pre-burst/pre-slew/post-slew images
Pre-burst image of 15-350 keV band
Time interval of the image:
-299.824000 -29.272000

# RAcent  DECcent POSerr Theta    Phi  PeakCts   SNR AngSep     Name
#  [deg]    [deg]    ['] [deg]  [deg]                   [']
 83.6342  22.0208    0.4  31.7   80.1  11.8902  26.8    0.4	Crab
 92.8919  33.2685    2.7  41.5   63.3   3.5161   4.3 ------	UNKNOWN
 52.9562 -20.1917    2.7  37.1 -179.1   1.1474   4.2 ------	UNKNOWN
 26.2748  62.3029    2.4  48.5   -9.9   1.7856   4.7 ------	UNKNOWN
 38.7838 -36.0470    3.1  54.0 -163.5   2.2681   3.7 ------	UNKNOWN
 19.4541 -21.0824    3.8  48.6 -135.4   2.7607   3.0 ------	UNKNOWN
Pre-slew background subtracted image of 15-350 keV band
Time interval of the image:
-29.272000 10.876600

# RAcent  DECcent POSerr Theta    Phi  PeakCts   SNR AngSep     Name
#  [deg]    [deg]    ['] [deg]  [deg]                   [']
 83.5868  22.1504   56.4  31.6   79.8  -0.0275  -0.2    8.6	Crab
 59.4686  58.2885    2.8  42.0   11.9   0.4666   4.2 ------	UNKNOWN
 54.6435 -35.3705    2.4  52.4 -179.5   0.9488   4.8 ------	UNKNOWN
 45.7839  12.8248    0.3   6.0 -126.5   2.7698  37.8 ------	UNKNOWN
Post-slew image of 15-350 keV band
Time interval of the image:
38.876600 302.198000

# RAcent  DECcent POSerr Theta    Phi  PeakCts   SNR AngSep     Name
#  [deg]    [deg]    ['] [deg]  [deg]                   [']
 83.6450  22.0146    0.7  37.2   83.6  11.0524  15.5    0.7	Crab
 27.3302  52.4599    2.5  42.3   -3.4   1.3170   4.6 ------	UNKNOWN
Plot creation:
Sun May 31 13:59:53 EDT 2015