Click here for the BAT GCN circular template
Image
Pre-slew 15.0-350.0 keV image (Event data)

#   RAcent    DECcent   POSerr    Theta     Phi              Peak Cts       SNR   Name
  174.4232    49.9927   0.0114    18.4115   118.9959         1.0445924     16.751 TRIG_00202505

Foreground time interval of the image:
 -5.120  24.480 (delta_t =  29.600 [sec])
Background time interval of the image:
-239.120  -5.120 (delta_t = 234.000 [sec])
Lightcurves
Notes:
- 1) The mask-weighted light curves are using the flight position.
- 2) Multiple plots of different time binning/intervals are shown to cover all scenarios of short/long GRBs, rate/image triggers, and real/false positives.
- 3) For all the mask-weighted lightcurves, the y-axis units are counts/sec/det where a det is 0.4 x 0.4 = 0.16 sq cm.
- 4) The verticle lines correspond to following: green dotted lines are T50 interval, black dotted lines are T90 interval, blue solid line(s) is a spacecraft slew start time, and orange solid line(s) is a spacecraft slew end time.
- 5) Time of each bin is in the middle of the bin.
1 s binning
From T0-310 s to T0+310 s

From T100_start - 20 s to T100_end + 30 s

Full time interval
64 ms binning
Full time interval

From T100_start to T100_end
From T0-5 sec to T0+5 sec

16 ms binning
From T100_start-5 s to T100_start+5 s

Blue+Cyan dotted lines: Time interval of the scaled map
From 0.000000 to 4.096000
8 ms binning
From T100_start-3 s to T100_start+3 s
Blue+Cyan dotted lines: Time interval of the scaled map
From 0.000000 to 4.096000
2 ms binning
From T100_start-1 s to T100_start+1 s
Blue+Cyan dotted lines: Time interval of the scaled map
From 0.000000 to 4.096000
SN=5 or 10 sec. binning (whichever binning is satisfied first)

SN=5 or 10 sec. binning (T < 200 sec)
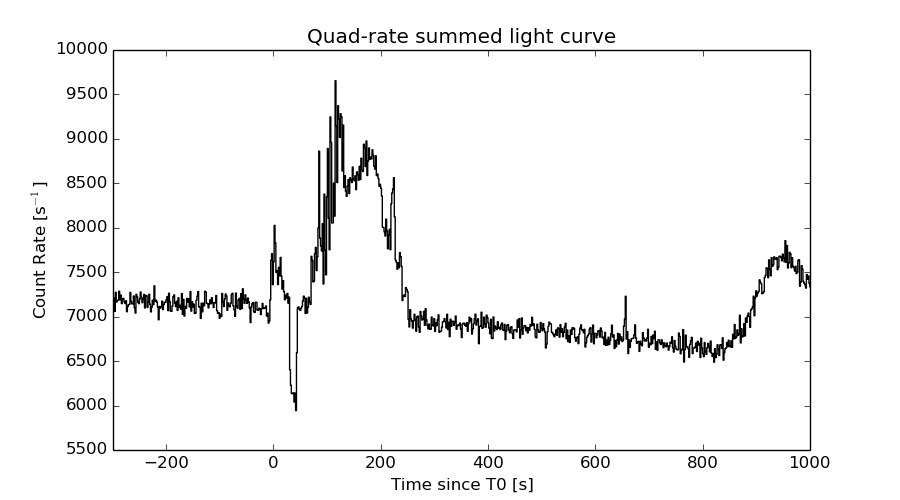
Quad-rate summed light curves (from T0-300s to T0+1000s)
Spectral Evolution

Spectra
Notes:
- 1) The fitting includes the systematic errors.
- 2) When the burst includes telescope slew time periods, the fitting uses an average response file made from multiple 5-s response files through out the slew time plus single time preiod for the non-slew times, and weighted by the total counts in the corresponding time period using addrmf. An average response file is needed becuase a spectral fit using the pre-slew DRM will introduce some errors in both a spectral shape and a normalization if the PHA file contains a lot of the slew/post-slew time interval.
- 3) For fits to more complicated models (e.g. a power-law over a cutoff power-law), the BAT team has decided to require a chi-square improvement of more than 6 for each extra dof.
Time averaged spectrum fit using the average DRM
Power-law model

Time interval is from   -5.120 sec. to   24.480 sec.

Spectral model in power-law:
------------------------------------------------------------
Parameters  : value       lower 90%   higher 90%
Photon index: 1.53516     ( -0.167276   0.17012 )
Norm@50keV  : 2.26995E-03    ( -0.000217189   0.000214728 )
------------------------------------------------------------
#Fit statistic : Chi-Squared =          50.40 using 59 PHA bins.
# Reduced chi-squared =         0.8843 for     57 degrees of freedom
# Null hypothesis probability =   7.191615e-01

Photon flux (15-150 keV)    in 29.6 sec: 0.286143 ( -0.0257597  0.025788 ) ph/cm2/s
Energy fluence (15-150 keV)             : 6.33911e-07 ( -6.69901e-08  6.79613e-08 ) ergs/cm2
Cutoff power-law model

Time interval is from   -5.120 sec. to   24.480 sec.
Spectral model in the cutoff power-law:
------------------------------------------------------------
Parameters  : value       lower 90%   higher 90%
Photon index: 1.42740     (     )
Epeak [keV] : 262.816      (   )
Norm@50keV  : 2.57649E-03    (     )
------------------------------------------------------------
#Fit statistic : Chi-Squared =          50.45 using 59 PHA bins.
# Reduced chi-squared =         0.9008 for     56 degrees of freedom
# Null hypothesis probability =   6.842660e-01

Photon flux (15-150 keV)    in 29.6 sec: 0.285325 ( -0.026888  0.026455 ) ph/cm2/s
Energy fluence (15-150 keV)             : 6.31282e-07 ( -7.38461e-08  7.01668e-08 ) ergs/cm2
Band function

Time interval is from   -5.120 sec. to   24.480 sec.

Spectral model in the Band function:
------------------------------------------------------------
Parameters  : value       lower 90%   higher 90%
alpha       : -1.50632   ( 1.52245   0.658856 )
beta        : -9.37165    ( 5.95177   9.37165 )
Epeak [keV] : 844.532      ( -841.775 -841.775 )
Norm@50keV   : 2.34800E-03    ( -0.000290714   0.00252877 )
------------------------------------------------------------
#Fit statistic : Chi-Squared =          50.40 using 59 PHA bins.
# Reduced chi-squared =         0.9163 for     55 degrees of freedom
# Null hypothesis probability =   6.509201e-01

Photon flux (15-150 keV)    in 29.6 sec:  (    ) ph/cm2/s
Energy fluence (15-150 keV)             : 0 ( 0  0 ) ergs/cm2
Single BB
Spectral model blackbody:
------------------------------------------------------------
Parameters  : value    Lower 90%  Upper 90%
kT [keV]    : 14.8737  (-1.78914  2.07123)
R^2/D10^2   : 3.23153E-02  (-0.0117121   0.01827)
(R is the radius in km and D10 is the distance to the source in units of 10 kpc)
------------------------------------------------------------
#Fit statistic : Chi-Squared =          84.18 using 59 PHA bins.
# Reduced chi-squared =          1.477 for     57 degrees of freedom
# Null hypothesis probability =   1.111291e-02

Energy  Fluence     90% Error
[keV]   [erg/cm2]   [erg/cm2]
15- 25  4.436e-08   7.518e-09
25- 50  1.749e-07   2.303e-08
50-150  2.623e-07   4.994e-08
15-150  4.816e-07   5.698e-08
Thermal bremsstrahlung (OTTB)

Spectral model: thermal bremsstrahlung
------------------------------------------------------------
Parameters  : value         Lower 90%    Upper 90%
kT [keV]    : 199.361       (-68.5234      -199.362)
Norm        : 1.16155       (-0.10338     0.103484)
------------------------------------------------------------
#Fit statistic : Chi-Squared =          51.07 using 59 PHA bins.
# Reduced chi-squared =         0.8959 for     57 degrees of freedom
# Null hypothesis probability =   6.961198e-01

Energy  Fluence     90% Error
[keV]   [erg/cm2]   [erg/cm2]
15- 25  8.562e-08   1.375e-08
25- 50  1.647e-07   6.537e-08
50-150  3.612e-07   1.935e-07
15-150  6.115e-07   2.515e-07
Double BB

Spectral model: bbodyrad<1> + bbodyrad<2>
------------------------------------------------------------
Parameters  : value         Lower 90%    Upper 90%
kT1 [keV]   : 4.61661        (-1.33584      1.85534)
R1^2/D10^2  : 1.42257        (-1.04809      5.74055)
kT2 [keV]   : 21.6242        (-3.76531      6.08389)
R2^2/D10^2  : 7.79569E-03    (-0.00454997   0.00764467)
------------------------------------------------------------
#Fit statistic : Chi-Squared =          49.34 using 59 PHA bins.
# Reduced chi-squared =         0.8972 for     55 degrees of freedom
# Null hypothesis probability =   6.896004e-01

Energy  Fluence     90% Error
[keV]   [erg/cm2]   [erg/cm2]
15- 25  9.373e-08   4.368e-08
25- 50  1.446e-07   4.402e-08
50-150  3.688e-07   1.209e-07
15-150  6.072e-07   1.533e-07
Peak spectrum fit
Power-law model
Time interval is from    2.596 sec. to    3.596 sec.

Spectral model in power-law:
------------------------------------------------------------
Parameters  : value       lower 90%   higher 90%
Photon index: 1.92108     ( -0.393406   0.428463 )
Norm@50keV  : 5.26989E-03    ( -0.00142221   0.00133456 )
------------------------------------------------------------
#Fit statistic : Chi-Squared =          51.79 using 59 PHA bins.
# Reduced chi-squared =         0.9087 for     57 degrees of freedom
# Null hypothesis probability =   6.701560e-01

Photon flux (15-150 keV)    in 1 sec: 0.763139 ( -0.140842  0.14087 ) ph/cm2/s
Energy fluence (15-150 keV)             : 4.84612e-08 ( -1.19817e-08  1.2794e-08 ) ergs/cm2
Cutoff power-law model

Time interval is from    2.596 sec. to    3.596 sec.
Spectral model in the cutoff power-law:
------------------------------------------------------------
Parameters  : value       lower 90%   higher 90%
Photon index: 2.41944     (     )
Epeak [keV] : 149.114      (   )
Norm@50keV  : 2.77720E-03    (     )
------------------------------------------------------------
#Fit statistic : Chi-Squared =          49.60 using 59 PHA bins.
# Reduced chi-squared =         0.8857 for     56 degrees of freedom
# Null hypothesis probability =   7.142069e-01

Photon flux (15-150 keV)    in 1 sec: 0.762277 ( -0.140505  0.140449 ) ph/cm2/s
Energy fluence (15-150 keV)             : 4.78389e-08 ( -1.14091e-08  1.34094e-08 ) ergs/cm2
Band function
Time interval is from    2.596 sec. to    3.596 sec.

Spectral model in the Band function:
------------------------------------------------------------
Parameters  : value       lower 90%   higher 90%
alpha       : 4.93022   ( -4.93022   -4.93022 )
beta        : -2.07697    ( -0.764152   0.475212 )
Epeak [keV] : 21.0203      ( -21.0203 5.70013 )
Norm@50keV   : 2276.79    ( -417.756   7.99705e+06 )
------------------------------------------------------------
#Fit statistic : Chi-Squared =          51.17 using 59 PHA bins.
# Reduced chi-squared =         0.9303 for     55 degrees of freedom
# Null hypothesis probability =   6.218804e-01

Photon flux (15-150 keV)    in 1 sec:  (    ) ph/cm2/s
Energy fluence (15-150 keV)             : 0 ( 0  0 ) ergs/cm2
Single BB
Spectral model blackbody:
------------------------------------------------------------
Parameters  : value    Lower 90%  Upper 90%
kT [keV]    : 7.02893  (-1.36957  1.82224)
R^2/D10^2   : 1.33484  (-0.807547   1.91586)
(R is the radius in km and D10 is the distance to the source in units of 10 kpc)
------------------------------------------------------------
#Fit statistic : Chi-Squared =          60.37 using 59 PHA bins.
# Reduced chi-squared =          1.059 for     57 degrees of freedom
# Null hypothesis probability =   3.550972e-01

Energy  Fluence     90% Error
[keV]   [erg/cm2]   [erg/cm2]
15- 25  1.064e-08   4.169e-09
25- 50  1.469e-08   6.388e-09
50-150  2.471e-09   1.712e-09
15-150  2.780e-08   1.034e-08
Thermal bremsstrahlung (OTTB)
Spectral model: thermal bremsstrahlung
------------------------------------------------------------
Parameters  : value         Lower 90%    Upper 90%
kT [keV]    : 73.9822       (-42.4974      -74.2445)
Norm        : 3.60999       (-0.981422     2.04156)
------------------------------------------------------------
#Fit statistic : Chi-Squared =          54.82 using 59 PHA bins.
# Reduced chi-squared =         0.9618 for     57 degrees of freedom
# Null hypothesis probability =   5.572987e-01

Energy  Fluence     90% Error
[keV]   [erg/cm2]   [erg/cm2]
15- 25  9.312e-09   2.493e-09
25- 50  1.503e-08   4.270e-09
50-150  2.010e-08   1.433e-08
15-150  4.445e-08   1.714e-08
Double BB
R1^2/D10^2  : 2.23148        (-0.969572      3.48843)
kT2 [keV]   : 198.261        (      )
R2^2/D10^2  : 1.43014E-04    (   )
------------------------------------------------------------
#Fit statistic : Chi-Squared =          42.04 using 59 PHA bins.
#Fit statistic : Chi-Squared =          41.84 using 59 PHA bins.
#Fit statistic : Chi-Squared =          41.70 using 59 PHA bins.
# Reduced chi-squared =         0.7643 for     55 degrees of freedom
# Reduced chi-squared =         0.7608 for     55 degrees of freedom
# Reduced chi-squared =         0.7581 for     55 degrees of freedom
# Null hypothesis probability =   9.004703e-01
# Null hypothesis probability =   9.042630e-01
# Null hypothesis probability =   9.070854e-01

Energy  Fluence     90% Error
[keV]   [erg/cm2]   [erg/cm2]
15- 25  1.078e-08   4.956e-09
25- 50  1.360e-08   6.095e-09
50-150  3.862e-08   3.772e-08
15-150  6.299e-08   4.815e-08
Pre-slew spectrum (Pre-slew PHA with pre-slew DRM)
Power-law model

Spectral model in power-law:
------------------------------------------------------------
Parameters  : value       lower 90%   higher 90%
Photon index: 1.53516     ( -0.167276   0.17012 )
Norm@50keV  : 2.26995E-03    ( -0.000217189   0.000214728 )
------------------------------------------------------------
#Fit statistic : Chi-Squared =          50.40 using 59 PHA bins.
# Reduced chi-squared =         0.8843 for     57 degrees of freedom
# Null hypothesis probability =   7.191615e-01

Photon flux (15-150 keV)    in 29.6 sec: 0.286143 ( -0.0257597  0.025788 ) ph/cm2/s
Energy fluence (15-150 keV)             : 6.33911e-07 ( -6.69901e-08  6.79613e-08 ) ergs/cm2
Cutoff power-law model
Spectral model in the cutoff power-law:
------------------------------------------------------------
Parameters  : value       lower 90%   higher 90%
Photon index: 1.42740     (     )
Epeak [keV] : 262.816      (   )
Norm@50keV  : 2.57649E-03    (     )
------------------------------------------------------------
#Fit statistic : Chi-Squared =          50.45 using 59 PHA bins.
# Reduced chi-squared =         0.9008 for     56 degrees of freedom
# Null hypothesis probability =   6.842660e-01

Photon flux (15-150 keV)    in 29.6 sec: 0.285325 ( -0.026888  0.026455 ) ph/cm2/s
Energy fluence (15-150 keV)             : 6.31282e-07 ( -7.38461e-08  7.01668e-08 ) ergs/cm2
Band function
Spectral model in the Band function:
------------------------------------------------------------
Parameters  : value       lower 90%   higher 90%
alpha       : -1.50632   ( 1.52245   0.658856 )
beta        : -9.37165    ( 5.95177   9.37165 )
Epeak [keV] : 844.532      ( -841.775 -841.775 )
Norm@50keV   : 2.34800E-03    ( -0.000290714   0.00252877 )
------------------------------------------------------------
#Fit statistic : Chi-Squared =          50.40 using 59 PHA bins.
# Reduced chi-squared =         0.9163 for     55 degrees of freedom
# Null hypothesis probability =   6.509201e-01

Photon flux (15-150 keV)    in 29.6 sec:  (    ) ph/cm2/s
Energy fluence (15-150 keV)             : 0 ( 0  0 ) ergs/cm2
S(25-50 keV) vs. S(50-100 keV) plot
S(25-50 keV)  = 1.59e-07
S(50-100 keV) = 2.20e-07
T90 vs. Hardness ratio plot
T90                                   = 23.8719999492168 sec.
Hardness ratio (energy fluence ratio) = 1.38365
Color vs. Color plot
Count Ratio  (25-50 keV) / (15-25 keV) = 1.14109
Count Ratio (50-100 keV) / (15-25 keV) = 0.939273
Mask shadow pattern
IMX = -1.613621644231447E-01, IMY = -2.911546454777059E-01
TIME vs. PHA plot around the trigger time
Blue+Cyan dotted lines: Time interval of the scaled map
From 0.000000 to 4.096000
TIME vs. DetID plot around the trigger time

Blue+Cyan dotted lines: Time interval of the scaled map
From 0.000000 to 4.096000
100 us light curve (15-350 keV)

Blue+Cyan dotted lines: Time interval of the scaled map
From 0.000000 to 4.096000
Spacecraft aspect plot

Bright source in the pre-burst/pre-slew/post-slew images
Pre-burst image of 15-350 keV band
Time interval of the image:
-239.120000 -5.120000

# RAcent  DECcent POSerr Theta    Phi  PeakCts   SNR AngSep     Name
#  [deg]    [deg]    ['] [deg]  [deg]                   [']
254.4308  35.3972    6.1  43.9  -14.1   0.5042   1.9    3.5	Her X-1
179.0869  26.2689    2.6  39.1   91.7   2.9736   4.4 ------	UNKNOWN
198.0252  39.6928    2.3  23.6   64.2   0.9630   5.1 ------	UNKNOWN
252.9836  47.5556    2.7  33.5  -24.5   0.8553   4.3 ------	UNKNOWN
 87.7913  47.8509    2.6  56.2 -165.3   2.8769   4.5 ------	UNKNOWN
282.5243  66.2105    2.8  33.4  -69.2   1.2558   4.1 ------	UNKNOWN
Pre-slew background subtracted image of 15-350 keV band
Time interval of the image:
-5.120000 24.480000

# RAcent  DECcent POSerr Theta    Phi  PeakCts   SNR AngSep     Name
#  [deg]    [deg]    ['] [deg]  [deg]                   [']
254.4140  35.2209    4.3  44.0  -14.0   0.2530   2.7    7.6	Her X-1
174.4232  49.9927    0.7  18.4  119.0   1.0445  16.8 ------	UNKNOWN
263.1864  53.1491    2.3  34.0  -39.9   0.3967   5.0 ------	UNKNOWN
Post-slew image of 15-350 keV band
Time interval of the image:
152.380620 164.780590

# RAcent  DECcent POSerr Theta    Phi  PeakCts   SNR AngSep     Name
#  [deg]    [deg]    ['] [deg]  [deg]                   [']
245.0228 -15.6342    0.8  23.8   60.9   0.6905  14.6    2.5	Sco X-1
254.5893  35.2884    7.7  43.7  159.5   0.1275   1.5    7.2	Her X-1
255.9924 -37.6929    9.6  32.7   11.9  -0.0594  -1.2    9.1	4U 1700-377
256.4516 -36.3138    7.2  31.3   12.2   0.0778   1.6    6.6	GX 349+2
263.0164 -24.8973    5.2  18.7    7.8  -0.0851  -2.2    9.1	GX 1+4
264.8014 -44.5025  180.3  37.9   -2.0   0.0033   0.1    4.0	4U 1735-44
268.2125  -1.5137    6.8   5.2 -178.0   0.0645   1.7   10.0	SW J1753.5-0127
270.1202 -25.1385    5.1  18.6  -12.5   0.0816   2.3    9.6	GX 5-1
270.2032 -25.8871    5.4  19.3  -12.4   0.0782   2.1   10.2	GRS 1758-258
274.0134 -13.8877   12.7   9.6  -46.2   0.0333   0.9    8.9	GX 17+2
275.7509 -30.5135    0.0  25.0  -22.0   0.0242   0.6   12.6	H1820-303
284.9100 -25.0686    7.1  24.7  -45.4  -0.0744  -1.6   11.2	HT1900.1-2455
288.8903  10.8273    2.7  27.5 -134.6   0.1807   4.3    8.9	GRS 1915+105
299.6103  35.1419    3.7  51.6 -151.6   0.3762   3.1    3.7	Cyg X-1
263.1436 -33.8121  182.4  27.4    2.8  -0.0027  -0.1    7.8	GX 354-0
267.1577 -24.1420    2.7  17.4   -3.9   0.1509   4.2 ------	UNKNOWN
276.6400 -62.1814    2.5  55.9  -10.3   0.5822   4.6 ------	UNKNOWN
297.5352  46.7325    2.8  59.7 -161.8   0.9987   4.2 ------	UNKNOWN
299.3908   7.4071    2.2  34.7 -118.6   0.3331   5.2 ------	UNKNOWN
305.2425 -45.3925    2.2  50.6  -38.9   0.7560   5.2 ------	UNKNOWN
Plot creation:
Sun May 31 13:52:27 EDT 2015