Click here for the BAT GCN circular template
Image
Pre-slew 15.0-350.0 keV image (Event data)
#   RAcent    DECcent   POSerr    Theta     Phi              Peak Cts       SNR   Name
    7.3590    36.7846   0.0136    29.6909   -64.1589         1.1365816     14.225 TRIG_00206773

Foreground time interval of the image:
-20.460  20.476 (delta_t =  40.936 [sec])
Background time interval of the image:
-239.672 -20.460 (delta_t = 219.212 [sec])
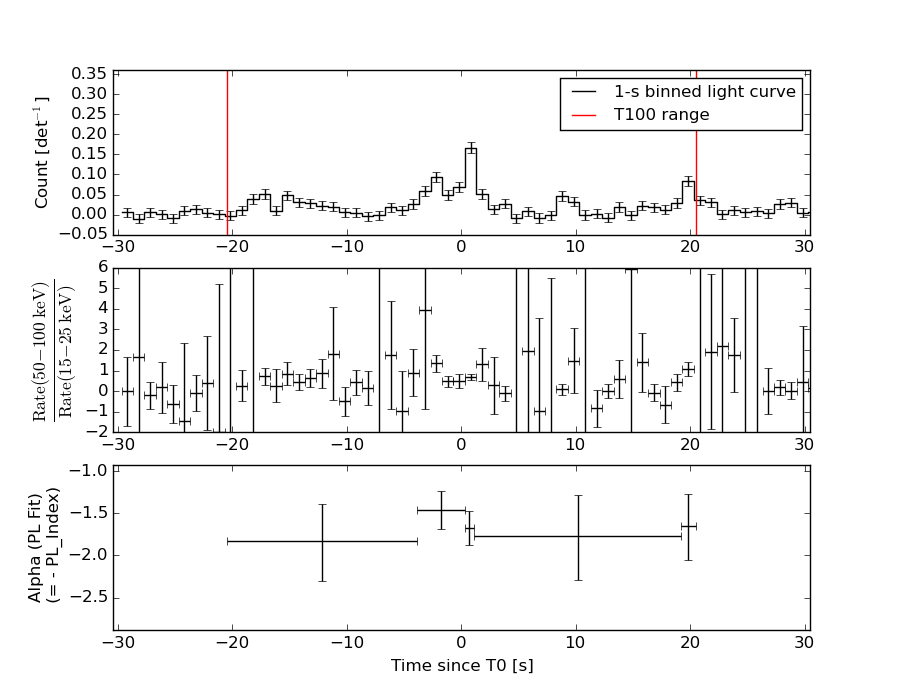
Lightcurves
Notes:
- 1) The mask-weighted light curves are using the flight position.
- 2) Multiple plots of different time binning/intervals are shown to cover all scenarios of short/long GRBs, rate/image triggers, and real/false positives.
- 3) For all the mask-weighted lightcurves, the y-axis units are counts/sec/det where a det is 0.4 x 0.4 = 0.16 sq cm.
- 4) The verticle lines correspond to following: green dotted lines are T50 interval, black dotted lines are T90 interval, blue solid line(s) is a spacecraft slew start time, and orange solid line(s) is a spacecraft slew end time.
- 5) Time of each bin is in the middle of the bin.
1 s binning
From T0-310 s to T0+310 s
From T100_start - 20 s to T100_end + 30 s
Full time interval
64 ms binning
Full time interval
From T100_start to T100_end
From T0-5 sec to T0+5 sec
16 ms binning
From T100_start-5 s to T100_start+5 s
Blue+Cyan dotted lines: Time interval of the scaled map
From 0.000000 to 1.024000
8 ms binning
From T100_start-3 s to T100_start+3 s
Blue+Cyan dotted lines: Time interval of the scaled map
From 0.000000 to 1.024000
2 ms binning
From T100_start-1 s to T100_start+1 s
Blue+Cyan dotted lines: Time interval of the scaled map
From 0.000000 to 1.024000
SN=5 or 10 sec. binning (whichever binning is satisfied first)
SN=5 or 10 sec. binning (T < 200 sec)
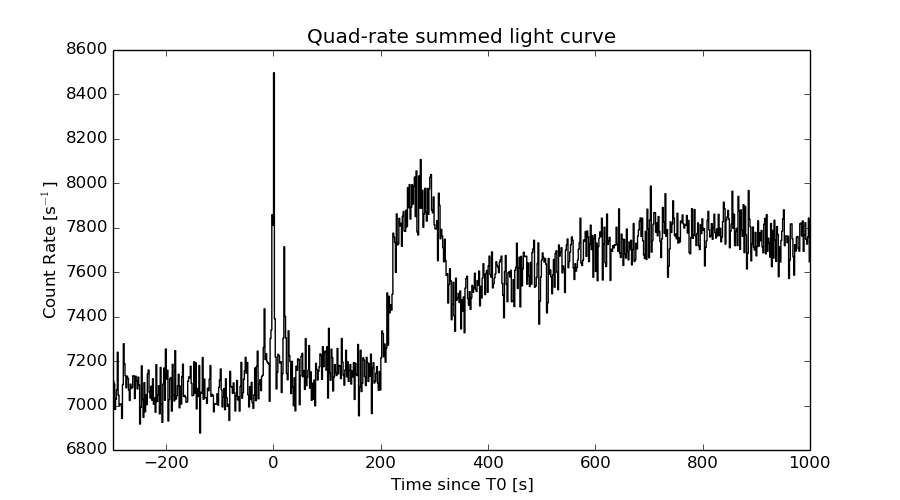
Quad-rate summed light curves (from T0-300s to T0+1000s)
Spectral Evolution
Spectra
Notes:
- 1) The fitting includes the systematic errors.
- 2) When the burst includes telescope slew time periods, the fitting uses an average response file made from multiple 5-s response files through out the slew time plus single time preiod for the non-slew times, and weighted by the total counts in the corresponding time period using addrmf. An average response file is needed becuase a spectral fit using the pre-slew DRM will introduce some errors in both a spectral shape and a normalization if the PHA file contains a lot of the slew/post-slew time interval.
- 3) For fits to more complicated models (e.g. a power-law over a cutoff power-law), the BAT team has decided to require a chi-square improvement of more than 6 for each extra dof.
Time averaged spectrum fit using the average DRM
Power-law model

Time interval is from  -20.460 sec. to   20.476 sec.

Spectral model in power-law:
------------------------------------------------------------
Parameters  : value       lower 90%   higher 90%
Photon index: 1.69785     ( -0.179821   0.184898 )
Norm@50keV  : 1.80876E-03    ( -0.00020791   0.000204879 )
------------------------------------------------------------
#Fit statistic : Chi-Squared =          61.72 using 59 PHA bins.
# Reduced chi-squared =          1.083 for     57 degrees of freedom
# Null hypothesis probability =   3.113127e-01

Photon flux (15-150 keV)    in 40.94 sec: 0.240043 ( -0.0250099  0.0250253 ) ph/cm2/s
Energy fluence (15-150 keV)             : 6.85737e-07 ( -8.22521e-08  8.3421e-08 ) ergs/cm2
Cutoff power-law model

Time interval is from  -20.460 sec. to   20.476 sec.
Spectral model in the cutoff power-law:
------------------------------------------------------------
Parameters  : value       lower 90%   higher 90%
Photon index: 1.19050     ( -0.818533   0.624674 )
Epeak [keV] : 73.3628      ( -23.3006 -73.3628 )
Norm@50keV  : 3.40634E-03    ( -0.00172359   0.00589051 )
------------------------------------------------------------
#Fit statistic : Chi-Squared =          60.20 using 59 PHA bins.
# Reduced chi-squared =          1.075 for     56 degrees of freedom
# Null hypothesis probability =   3.263862e-01

Photon flux (15-150 keV)    in 40.94 sec: 0.235369 ( -0.025863  0.025829 ) ph/cm2/s
Energy fluence (15-150 keV)             : 6.55875e-07 ( -9.08622e-08  9.28274e-08 ) ergs/cm2
Band function
Time interval is from  -20.460 sec. to   20.476 sec.

Spectral model in the Band function:
------------------------------------------------------------
Parameters  : value       lower 90%   higher 90%
alpha       : -1.18448   ( 1.17152   6.14522 )
beta        : -2.36478    ( 2.40267   4.12167 )
Epeak [keV] : 72.7595      ( -71.7448 258.298 )
Norm@50keV   : 3.43428E-03    ( -0.00181509   0.073264 )
------------------------------------------------------------
#Fit statistic : Chi-Squared =          60.19 using 59 PHA bins.
# Reduced chi-squared =          1.094 for     55 degrees of freedom
# Null hypothesis probability =   2.933734e-01

Photon flux (15-150 keV)    in 40.94 sec: 0.235312 (    ) ph/cm2/s
Energy fluence (15-150 keV)             : 6.55335e-07 ( 0  0 ) ergs/cm2
Single BB

Spectral model blackbody:
------------------------------------------------------------
Parameters  : value    Lower 90%  Upper 90%
kT [keV]    : 12.6816  (-1.60043  1.83589)
R^2/D10^2   : 4.79302E-02  (-0.0186375   0.0305087)
(R is the radius in km and D10 is the distance to the source in units of 10 kpc)
------------------------------------------------------------
#Fit statistic : Chi-Squared =          79.98 using 59 PHA bins.
# Reduced chi-squared =          1.403 for     57 degrees of freedom
# Null hypothesis probability =   2.401775e-02

Energy  Fluence     90% Error
[keV]   [erg/cm2]   [erg/cm2]
15- 25  6.693e-08   1.206e-08
25- 50  2.243e-07   2.868e-08
50-150  2.247e-07   4.806e-08
15-150  5.160e-07   6.857e-08
Thermal bremsstrahlung (OTTB)

Spectral model: thermal bremsstrahlung
------------------------------------------------------------
Parameters  : value         Lower 90%    Upper 90%
kT [keV]    : 130.088       (-46.3568      -128.461)
Norm        : 1.00489       (-0.118802     0.15752)
------------------------------------------------------------
#Fit statistic : Chi-Squared =          60.27 using 59 PHA bins.
# Reduced chi-squared =          1.057 for     57 degrees of freedom
# Null hypothesis probability =   3.582657e-01

Energy  Fluence     90% Error
[keV]   [erg/cm2]   [erg/cm2]
15- 25  1.067e-07   1.595e-08
25- 50  1.936e-07   3.549e-08
50-150  3.590e-07   1.860e-07
15-150  6.593e-07   2.264e-07
Double BB

Spectral model: bbodyrad<1> + bbodyrad<2>
------------------------------------------------------------
Parameters  : value         Lower 90%    Upper 90%
kT1 [keV]   : 5.68860        (-1.68954      2.19096)
R1^2/D10^2  : 0.538037        (-0.359203      1.5851)
kT2 [keV]   : 20.0066        (-4.33615      8.82171)
R2^2/D10^2  : 7.20843E-03    (-0.00544903   0.0117846)
------------------------------------------------------------
#Fit statistic : Chi-Squared =          59.39 using 59 PHA bins.
# Reduced chi-squared =          1.080 for     55 degrees of freedom
# Null hypothesis probability =   3.188732e-01

Energy  Fluence     90% Error
[keV]   [erg/cm2]   [erg/cm2]
15- 25  1.101e-07   5.715e-08
25- 50  1.908e-07   8.742e-08
50-150  3.423e-07   1.873e-07
15-150  6.433e-07   2.787e-07
Peak spectrum fit
Power-law model
Time interval is from    0.108 sec. to    1.108 sec.

Spectral model in power-law:
------------------------------------------------------------
Parameters  : value       lower 90%   higher 90%
Photon index: 1.69424     ( -0.193459   0.201324 )
Norm@50keV  : 1.23190E-02    ( -0.00157485   0.00154891 )
------------------------------------------------------------
#Fit statistic : Chi-Squared =          50.36 using 59 PHA bins.
# Reduced chi-squared =         0.8836 for     57 degrees of freedom
# Null hypothesis probability =   7.204935e-01

Photon flux (15-150 keV)    in 1 sec: 1.63283 ( -0.187823  0.187906 ) ph/cm2/s
Energy fluence (15-150 keV)             : 1.14113e-07 ( -1.52054e-08  1.54202e-08 ) ergs/cm2
Cutoff power-law model

Time interval is from    0.108 sec. to    1.108 sec.
Spectral model in the cutoff power-law:
------------------------------------------------------------
Parameters  : value       lower 90%   higher 90%
Photon index: 0.896917     ( -1.10422   0.863304 )
Epeak [keV] : 63.6275      ( -16.2184 -63.6262 )
Norm@50keV  : 3.32997E-02    ( -0.033302   0.0973984 )
------------------------------------------------------------
#Fit statistic : Chi-Squared =          48.05 using 59 PHA bins.
# Reduced chi-squared =         0.8579 for     56 degrees of freedom
# Null hypothesis probability =   7.662995e-01

Photon flux (15-150 keV)    in 1 sec: 1.58955 ( -0.19561  0.19426 ) ph/cm2/s
Energy fluence (15-150 keV)             : 1.07172e-07 ( -1.67722e-08  1.7307e-08 ) ergs/cm2
Band function
Time interval is from    0.108 sec. to    1.108 sec.

Spectral model in the Band function:
------------------------------------------------------------
Parameters  : value       lower 90%   higher 90%
alpha       : -0.863400   ( 0.835703   2.09751 )
beta        : -2.39471    ( 2.42641   0.781206 )
Epeak [keV] : 61.6644      ( -59.8541 136.274 )
Norm@50keV   : 3.50733E-02    ( -0.0390896   118.07 )
------------------------------------------------------------
#Fit statistic : Chi-Squared =          47.74 using 59 PHA bins.
# Reduced chi-squared =         0.8680 for     55 degrees of freedom
# Null hypothesis probability =   7.457137e-01

Photon flux (15-150 keV)    in 1 sec:  (    ) ph/cm2/s
Energy fluence (15-150 keV)             : 0 ( 0  0 ) ergs/cm2
Single BB
Spectral model blackbody:
------------------------------------------------------------
Parameters  : value    Lower 90%  Upper 90%
kT [keV]    : 12.6051  (-1.5211  1.74463)
R^2/D10^2   : 0.344661  (-0.130284   0.204764)
(R is the radius in km and D10 is the distance to the source in units of 10 kpc)
------------------------------------------------------------
#Fit statistic : Chi-Squared =          57.86 using 59 PHA bins.
# Reduced chi-squared =          1.015 for     57 degrees of freedom
# Null hypothesis probability =   4.431893e-01

Energy  Fluence     90% Error
[keV]   [erg/cm2]   [erg/cm2]
15- 25  1.161e-08   2.379e-09
25- 50  3.867e-08   6.220e-09
50-150  3.813e-08   9.030e-09
15-150  8.841e-08   1.480e-08
Thermal bremsstrahlung (OTTB)

Spectral model: thermal bremsstrahlung
------------------------------------------------------------
Parameters  : value         Lower 90%    Upper 90%
kT [keV]    : 129.475       (-48.3373      -127.668)
Norm        : 6.86466       (-0.836382     1.16642)
------------------------------------------------------------
#Fit statistic : Chi-Squared =          48.54 using 59 PHA bins.
# Reduced chi-squared =         0.8515 for     57 degrees of freedom
# Null hypothesis probability =   7.800211e-01

Energy  Fluence     90% Error
[keV]   [erg/cm2]   [erg/cm2]
15- 25  1.782e-08   3.600e-09
25- 50  3.228e-08   6.970e-09
50-150  5.974e-08   3.483e-08
15-150  1.098e-07   4.450e-08
Double BB

Spectral model: bbodyrad<1> + bbodyrad<2>
------------------------------------------------------------
Parameters  : value         Lower 90%    Upper 90%
kT1 [keV]   : 4.20813        (-2.3677      -4.20949)
R1^2/D10^2  : 9.06688        (-8.5609      1082.91)
kT2 [keV]   : 15.6966        (-2.94993      -15.6987)
R2^2/D10^2  : 0.135432    (-0.13503   0.0775399)
------------------------------------------------------------
#Fit statistic : Chi-Squared =          48.69 using 59 PHA bins.
# Reduced chi-squared =         0.8853 for     55 degrees of freedom
# Null hypothesis probability =   7.128410e-01

Energy  Fluence     90% Error
[keV]   [erg/cm2]   [erg/cm2]
15- 25  1.742e-08   8.403e-09
25- 50  3.304e-08   1.283e-08
50-150  4.908e-08   2.372e-08
15-150  9.953e-08   4.106e-08
Pre-slew spectrum (Pre-slew PHA with pre-slew DRM)
Power-law model
Spectral model in power-law:
------------------------------------------------------------
Parameters  : value       lower 90%   higher 90%
Photon index: 1.69785     ( -0.179821   0.184898 )
Norm@50keV  : 1.80876E-03    ( -0.00020791   0.000204879 )
------------------------------------------------------------
#Fit statistic : Chi-Squared =          61.72 using 59 PHA bins.
# Reduced chi-squared =          1.083 for     57 degrees of freedom
# Null hypothesis probability =   3.113127e-01

Photon flux (15-150 keV)    in 40.94 sec: 0.240043 ( -0.0250099  0.0250253 ) ph/cm2/s
Energy fluence (15-150 keV)             : 6.85737e-07 ( -8.22521e-08  8.3421e-08 ) ergs/cm2
Cutoff power-law model
Spectral model in the cutoff power-law:
------------------------------------------------------------
Parameters  : value       lower 90%   higher 90%
Photon index: 1.19050     ( -0.818533   0.624674 )
Epeak [keV] : 73.3628      ( -23.3006 -73.3628 )
Norm@50keV  : 3.40634E-03    ( -0.00172359   0.00589051 )
------------------------------------------------------------
#Fit statistic : Chi-Squared =          60.20 using 59 PHA bins.
# Reduced chi-squared =          1.075 for     56 degrees of freedom
# Null hypothesis probability =   3.263862e-01

Photon flux (15-150 keV)    in 40.94 sec: 0.235369 ( -0.025863  0.025829 ) ph/cm2/s
Energy fluence (15-150 keV)             : 6.55875e-07 ( -9.08622e-08  9.28274e-08 ) ergs/cm2
Band function

Spectral model in the Band function:
------------------------------------------------------------
Parameters  : value       lower 90%   higher 90%
alpha       : -1.18448   ( 1.17152   6.14519 )
beta        : -2.36478    ( 2.40267   4.12167 )
Epeak [keV] : 72.7595      ( -71.7448 258.289 )
Norm@50keV   : 3.43428E-03    ( -0.0018151   0.122423 )
------------------------------------------------------------
#Fit statistic : Chi-Squared =          60.19 using 59 PHA bins.
# Reduced chi-squared =          1.094 for     55 degrees of freedom
# Null hypothesis probability =   2.933734e-01

Photon flux (15-150 keV)    in 40.94 sec: 0.235312 (    ) ph/cm2/s
Energy fluence (15-150 keV)             : 6.55335e-07 ( 0  0 ) ergs/cm2
S(25-50 keV) vs. S(50-100 keV) plot
S(25-50 keV)  = 1.85e-07
S(50-100 keV) = 2.29e-07
T90 vs. Hardness ratio plot
T90                                   = 37.6800000071526 sec.
Hardness ratio (energy fluence ratio) = 1.23784
Color vs. Color plot
Count Ratio  (25-50 keV) / (15-25 keV) = 1.15486
Count Ratio (50-100 keV) / (15-25 keV) = 0.751752
Mask shadow pattern
IMX = 2.485279971674947E-01, IMY = 5.131652843505772E-01
TIME vs. PHA plot around the trigger time
Blue+Cyan dotted lines: Time interval of the scaled map
From 0.000000 to 1.024000
TIME vs. DetID plot around the trigger time
Blue+Cyan dotted lines: Time interval of the scaled map
From 0.000000 to 1.024000
100 us light curve (15-350 keV)
Blue+Cyan dotted lines: Time interval of the scaled map
From 0.000000 to 1.024000
Spacecraft aspect plot
Bright source in the pre-burst/pre-slew/post-slew images
Pre-burst image of 15-350 keV band
Time interval of the image:
-239.672000 -20.460000

# RAcent  DECcent POSerr Theta    Phi  PeakCts   SNR AngSep     Name
#  [deg]    [deg]    ['] [deg]  [deg]                   [']
299.5946  35.1959    0.5  38.6   41.9   7.5167  21.5    0.4	Cyg X-1
308.2882  40.9820    4.8  30.1   36.9   0.4838   2.4    8.3	Cyg X-3
326.1650  38.3172   13.3  26.6    8.1   0.1390   0.9    0.4	Cyg X-2
150.2823  61.7235    3.4  55.2  163.9   3.3199   3.4 ------	UNKNOWN
124.6615  62.4064    3.1  51.5  178.1   1.4377   3.7 ------	UNKNOWN
108.7735  50.2292    3.8  59.0 -166.1   3.0043   3.1 ------	UNKNOWN
Pre-slew background subtracted image of 15-350 keV band
Time interval of the image:
-20.460000 20.476000

# RAcent  DECcent POSerr Theta    Phi  PeakCts   SNR AngSep     Name
#  [deg]    [deg]    ['] [deg]  [deg]                   [']
299.7933  35.1189   23.7  38.6   41.7  -0.0624  -0.5   11.1	Cyg X-1
307.9702  41.0933    7.2  30.2   37.5   0.1401   1.6   10.6	Cyg X-3
326.1694  38.3220 1387.5  26.6    8.1  -0.0005  -0.0    0.1	Cyg X-2
313.2330  21.8908    2.7  45.7   17.4   0.5927   4.2 ------	UNKNOWN
331.1842  30.4464    2.0  33.2   -3.8   0.4242   5.6 ------	UNKNOWN
 94.6240  56.4156    2.6  49.5 -160.9   0.5568   4.4 ------	UNKNOWN
 23.0610  50.0361    2.7  24.6 -101.3   0.3223   4.2 ------	UNKNOWN
  7.3590  36.7846    0.8  29.7  -64.2   1.1362  14.2 ------	UNKNOWN
Post-slew image of 15-350 keV band
Time interval of the image:
341.928600 962.408000

# RAcent  DECcent POSerr Theta    Phi  PeakCts   SNR AngSep     Name
#  [deg]    [deg]    ['] [deg]  [deg]                   [']
 83.6316  22.0213    0.4  50.6  -17.0  24.0855  31.7    0.4	Crab
110.6312 -17.7435    2.7  38.5   51.6   3.5735   4.2 ------	UNKNOWN
 37.8174 -73.1204    3.9  49.4  158.4   2.8383   3.0 ------	UNKNOWN
 98.7557   6.8104    3.0  43.7   10.4   1.9973   3.8 ------	UNKNOWN
359.3168 -49.8207    3.0  57.7 -167.3   6.4175   3.9 ------	UNKNOWN
 64.9964  10.2442    3.6  37.4  -41.5   1.4443   3.2 ------	UNKNOWN
 12.0325 -26.0781    2.7  51.4 -136.5   9.3437   4.2 ------	UNKNOWN
Plot creation:
Sun May 31 13:36:55 EDT 2015