Special notes of this burst
Image
Pre-slew 15.0-350.0 keV image (Event data)

#   RAcent    DECcent   POSerr    Theta     Phi              Peak Cts       SNR   Name
  240.9228    66.6033   0.0049    34.9036  -131.7864         2.7730124     39.099 TRIG_00208169

Foreground time interval of the image:
 -5.644  11.389 (delta_t =  17.033 [sec])
Background time interval of the image:
-214.411  -5.644 (delta_t = 208.767 [sec])
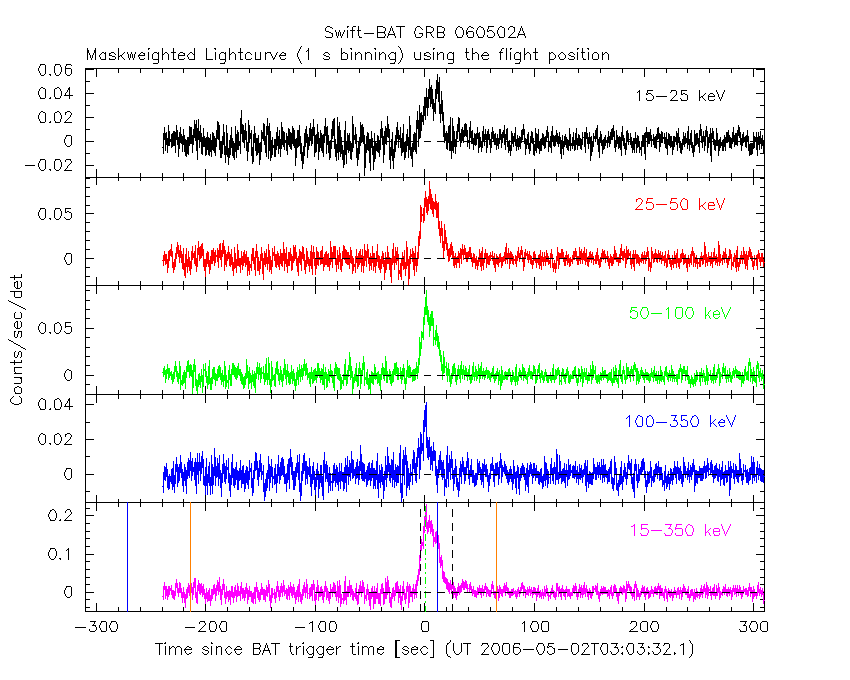
Lightcurves
Notes:
- 1) The mask-weighted light curves are using the flight position.
- 2) Multiple plots of different time binning/intervals are shown to cover all scenarios of short/long GRBs, rate/image triggers, and real/false positives.
- 3) For all the mask-weighted lightcurves, the y-axis units are counts/sec/det where a det is 0.4 x 0.4 = 0.16 sq cm.
- 4) The verticle lines correspond to following: green dotted lines are T50 interval, black dotted lines are T90 interval, blue solid line(s) is a spacecraft slew start time, and orange solid line(s) is a spacecraft slew end time.
- 5) Time of each bin is in the middle of the bin.
1 s binning
From T0-310 s to T0+310 s
From T100_start - 20 s to T100_end + 30 s

Full time interval

64 ms binning
Full time interval

From T100_start to T100_end

From T0-5 sec to T0+5 sec

16 ms binning
From T100_start-5 s to T100_start+5 s

Blue+Cyan dotted lines: Time interval of the scaled map
From 0.000000 to 1.024000
8 ms binning
From T100_start-3 s to T100_start+3 s

Blue+Cyan dotted lines: Time interval of the scaled map
From 0.000000 to 1.024000
2 ms binning
From T100_start-1 s to T100_start+1 s

Blue+Cyan dotted lines: Time interval of the scaled map
From 0.000000 to 1.024000
SN=5 or 10 sec. binning (whichever binning is satisfied first)

SN=5 or 10 sec. binning (T < 200 sec)

Quad-rate summed light curves (from T0-300s to T0+1000s)

Spectral Evolution

Spectra
Notes:
- 1) The fitting includes the systematic errors.
- 2) When the burst includes telescope slew time periods, the fitting uses an average response file made from multiple 5-s response files through out the slew time plus single time preiod for the non-slew times, and weighted by the total counts in the corresponding time period using addrmf. An average response file is needed becuase a spectral fit using the pre-slew DRM will introduce some errors in both a spectral shape and a normalization if the PHA file contains a lot of the slew/post-slew time interval.
- 3) For fits to more complicated models (e.g. a power-law over a cutoff power-law), the BAT team has decided to require a chi-square improvement of more than 6 for each extra dof.
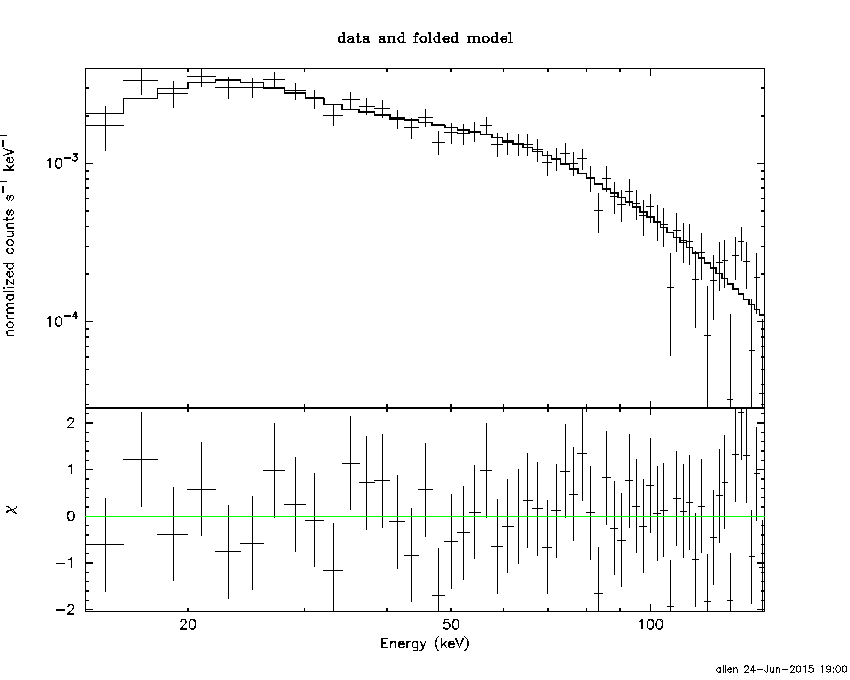
Time averaged spectrum fit using the average DRM
Power-law model
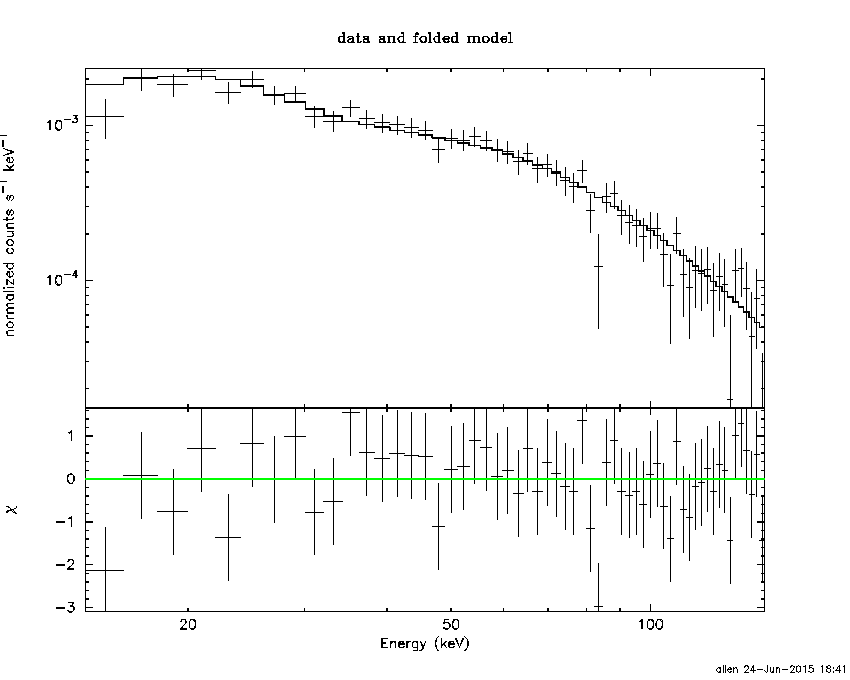
Time interval is from   -5.644 sec. to   38.984 sec.

Spectral model in power-law:
------------------------------------------------------------
Parameters  : value       lower 90%   higher 90%
Photon index: 1.42960     ( -0.0734501   0.0732114 )
Norm@50keV  : 5.44215E-03    ( -0.000225624   0.000225615 )
------------------------------------------------------------
#Fit statistic : Chi-Squared =          43.91 using 59 PHA bins.
# Reduced chi-squared =         0.7703 for     57 degrees of freedom
# Null hypothesis probability =   8.982361e-01

Photon flux (15-150 keV)    in 44.63 sec: 0.667343 ( -0.0296983  0.0297656 ) ph/cm2/s
Energy fluence (15-150 keV)             : 2.33315e-06 ( -1.0294e-07  1.03144e-07 ) ergs/cm2
Cutoff power-law model

Time interval is from   -5.644 sec. to   38.984 sec.
Spectral model in the cutoff power-law:
------------------------------------------------------------
Parameters  : value       lower 90%   higher 90%
Photon index: 1.11875     ( -0.307635   0.286698 )
Epeak [keV] : 151.533      ( -50.0628 800.878 )
Norm@50keV  : 7.65234E-03    ( -0.00201859   0.00296819 )
------------------------------------------------------------
#Fit statistic : Chi-Squared =          40.46 using 59 PHA bins.
# Reduced chi-squared =         0.7225 for     56 degrees of freedom
# Null hypothesis probability =   9.414073e-01

Photon flux (15-150 keV)    in 44.63 sec: 0.656455 ( -0.031262  0.031303 ) ph/cm2/s
Energy fluence (15-150 keV)             : 2.29043e-06 ( -1.11727e-07  1.11164e-07 ) ergs/cm2
Band function

Time interval is from   -5.644 sec. to   38.984 sec.

Spectral model in the Band function:
------------------------------------------------------------
Parameters  : value       lower 90%   higher 90%
alpha       : -0.351578   ( -0.638415   0.622767 )
beta        : -1.55684    ( 1.56544   0.138002 )
Epeak [keV] : 57.0476      ( -32.8306 133.226 )
Norm@50keV   : 2.36503E-02    ( -0.0239079   172.907 )
------------------------------------------------------------
#Fit statistic : Chi-Squared =          38.39 using 59 PHA bins.
# Reduced chi-squared =         0.6981 for     55 degrees of freedom
# Null hypothesis probability =   9.566504e-01

Photon flux (15-150 keV)    in 44.63 sec:  (    ) ph/cm2/s
Energy fluence (15-150 keV)             : 0 ( 0  0 ) ergs/cm2
Single BB

Spectral model blackbody:
------------------------------------------------------------
Parameters  : value    Lower 90%  Upper 90%
kT [keV]    : 16.7494  (  )
R^2/D10^2   : 5.18323E-02  (   )
(R is the radius in km and D10 is the distance to the source in units of 10 kpc)
------------------------------------------------------------
#Fit statistic : Chi-Squared =         153.76 using 59 PHA bins.
# Reduced chi-squared =         2.6976 for     57 degrees of freedom
# Null hypothesis probability =   7.939739e-11

Energy  Fluence     90% Error
[keV]   [erg/cm2]   [erg/cm2]
15- 25  1.327e-07   1.100e-08
25- 50  5.801e-07   3.258e-08
50-150  1.156e-06   8.167e-08
15-150  1.869e-06   8.881e-08
Thermal bremsstrahlung (OTTB)

Spectral model: thermal bremsstrahlung
------------------------------------------------------------
Parameters  : value         Lower 90%    Upper 90%
kT [keV]    : 200.000       (      )
Norm        : 2.77899       (-0.115426     0.115409)
------------------------------------------------------------
#Fit statistic : Chi-Squared =          50.37 using 59 PHA bins.
# Reduced chi-squared =         0.8836 for     57 degrees of freedom
# Null hypothesis probability =   7.204060e-01

Energy  Fluence     90% Error
[keV]   [erg/cm2]   [erg/cm2]
15- 25  3.089e-07   1.417e-08
25- 50  5.942e-07   2.633e-08
50-150  1.303e-06   6.360e-08
15-150  2.206e-06   1.006e-07
Double BB

Spectral model: bbodyrad<1> + bbodyrad<2>
------------------------------------------------------------
Parameters  : value         Lower 90%    Upper 90%
kT1 [keV]   : 8.35412        (-1.33909      1.48154)
R1^2/D10^2  : 0.366476        (-0.140469      0.269043)
kT2 [keV]   : 30.7918        (-5.19743      9.52064)
R2^2/D10^2  : 4.92938E-03    (-0.00291805   0.00472903)
------------------------------------------------------------
#Fit statistic : Chi-Squared =          42.55 using 59 PHA bins.
# Reduced chi-squared =         0.7736 for     55 degrees of freedom
# Null hypothesis probability =   8.899004e-01

Energy  Fluence     90% Error
[keV]   [erg/cm2]   [erg/cm2]
15- 25  2.449e-07   3.758e-08
25- 50  6.011e-07   6.360e-08
50-150  1.448e-06   2.624e-07
15-150  2.294e-06   3.454e-07
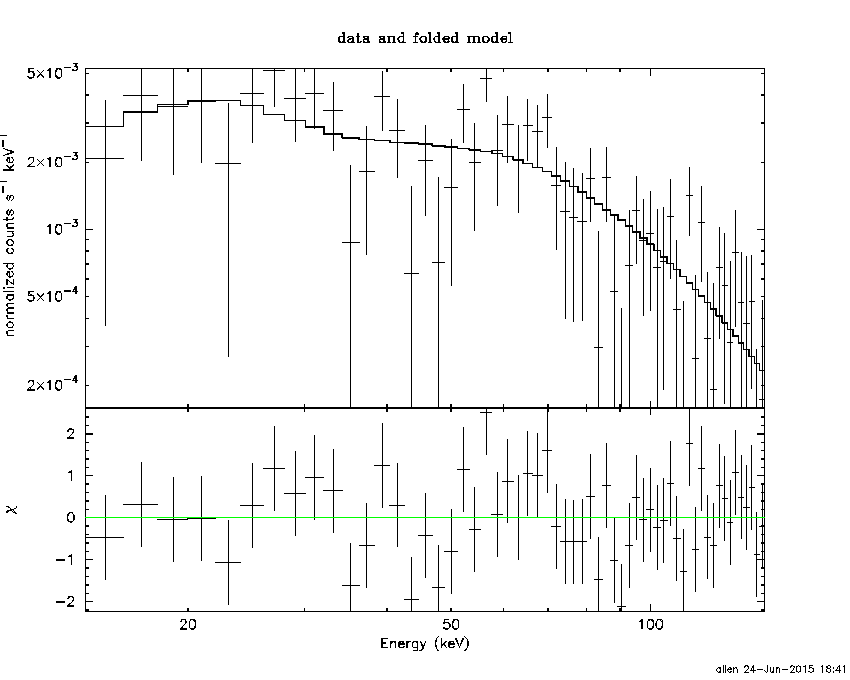
Peak spectrum fit
Power-law model

Time interval is from   -0.120 sec. to    0.880 sec.

Spectral model in power-law:
------------------------------------------------------------
Parameters  : value       lower 90%   higher 90%
Photon index: 0.937086     ( -0.206425   0.198062 )
Norm@50keV  : 1.51053E-02    ( -0.00179157   0.00177134 )
------------------------------------------------------------
#Fit statistic : Chi-Squared =          52.11 using 59 PHA bins.
# Reduced chi-squared =         0.9142 for     57 degrees of freedom
# Null hypothesis probability =   6.587642e-01

Photon flux (15-150 keV)    in 1 sec: 1.73479 ( -0.206699  0.209245 ) ph/cm2/s
Energy fluence (15-150 keV)             : 1.6714e-07 ( -1.98836e-08  1.99639e-08 ) ergs/cm2
Cutoff power-law model
Time interval is from   -0.120 sec. to    0.880 sec.
Spectral model in the cutoff power-law:
------------------------------------------------------------
Parameters  : value       lower 90%   higher 90%
Photon index: 0.845580     ( -0.876173   0.273248 )
Epeak [keV] : 762.130      ( -762.249 -762.249 )
Norm@50keV  : 1.65289E-02    ( -0.00278303   0.0209333 )
------------------------------------------------------------
#Fit statistic : Chi-Squared =          52.07 using 59 PHA bins.
# Reduced chi-squared =         0.9298 for     56 degrees of freedom
# Null hypothesis probability =   6.245034e-01

Photon flux (15-150 keV)    in 1 sec: 1.72920 ( -0.21138  0.21112 ) ph/cm2/s
Energy fluence (15-150 keV)             : 1.66816e-07 ( -2.0401e-08  2.0074e-08 ) ergs/cm2
Band function

Time interval is from   -0.120 sec. to    0.880 sec.

Spectral model in the Band function:
------------------------------------------------------------
Parameters  : value       lower 90%   higher 90%
alpha       : 1.11364   ( 0.79098   0.79098 )
beta        : -0.984383    ( 1.10774   11.1056 )
Epeak [keV] : 43.0641      ( -395.62 -395.62 )
Norm@50keV   : 0.393784    ( -0.374964   374.508 )
------------------------------------------------------------
#Fit statistic : Chi-Squared =          51.86 using 59 PHA bins.
# Reduced chi-squared =         0.9428 for     55 degrees of freedom
# Null hypothesis probability =   5.955343e-01

Photon flux (15-150 keV)    in 1 sec:  (    ) ph/cm2/s
Energy fluence (15-150 keV)             : 0 ( 0  0 ) ergs/cm2
Single BB

Spectral model blackbody:
------------------------------------------------------------
Parameters  : value    Lower 90%  Upper 90%
kT [keV]    : 24.1592  (-3.48949  4.5111)
R^2/D10^2   : 4.73330E-02  (-0.019409   0.0299846)
(R is the radius in km and D10 is the distance to the source in units of 10 kpc)
------------------------------------------------------------
#Fit statistic : Chi-Squared =          64.32 using 59 PHA bins.
# Reduced chi-squared =          1.128 for     57 degrees of freedom
# Null hypothesis probability =   2.357558e-01

Energy  Fluence     90% Error
[keV]   [erg/cm2]   [erg/cm2]
15- 25  4.886e-09   1.233e-09
25- 50  2.723e-08   4.835e-09
50-150  1.183e-07   2.411e-08
15-150  1.504e-07   2.475e-08
Thermal bremsstrahlung (OTTB)

Spectral model: thermal bremsstrahlung
------------------------------------------------------------
Parameters  : value         Lower 90%    Upper 90%
kT [keV]    : 200.000       (      )
Norm        : 7.15706       (-0.858657     0.858581)
------------------------------------------------------------
#Fit statistic : Chi-Squared =          78.55 using 59 PHA bins.
# Reduced chi-squared =          1.378 for     57 degrees of freedom
# Null hypothesis probability =   3.077750e-02

Energy  Fluence     90% Error
[keV]   [erg/cm2]   [erg/cm2]
15- 25  1.781e-08   1.004e-08
25- 50  3.427e-08   1.904e-08
50-150  7.516e-08   4.123e-08
15-150  1.272e-07   7.080e-08
Double BB

Spectral model: bbodyrad<1> + bbodyrad<2>
------------------------------------------------------------
Parameters  : value         Lower 90%    Upper 90%
kT1 [keV]   : 7.49031        (-3.19512      10.8425)
R1^2/D10^2  : 0.909501        (-0.808634      5.88354)
kT2 [keV]   : 34.3003        (-8.87428      -34.4179)
R2^2/D10^2  : 1.44921E-02    (-0.0134087   0.0155247)
------------------------------------------------------------
#Fit statistic : Chi-Squared =          53.10 using 59 PHA bins.
# Reduced chi-squared =         0.9654 for     55 degrees of freedom
# Null hypothesis probability =   5.477409e-01

Energy  Fluence     90% Error
[keV]   [erg/cm2]   [erg/cm2]
15- 25  1.120e-08   6.260e-09
25- 50  2.950e-08   1.350e-08
50-150  1.267e-07   6.659e-08
15-150  1.674e-07   7.586e-08
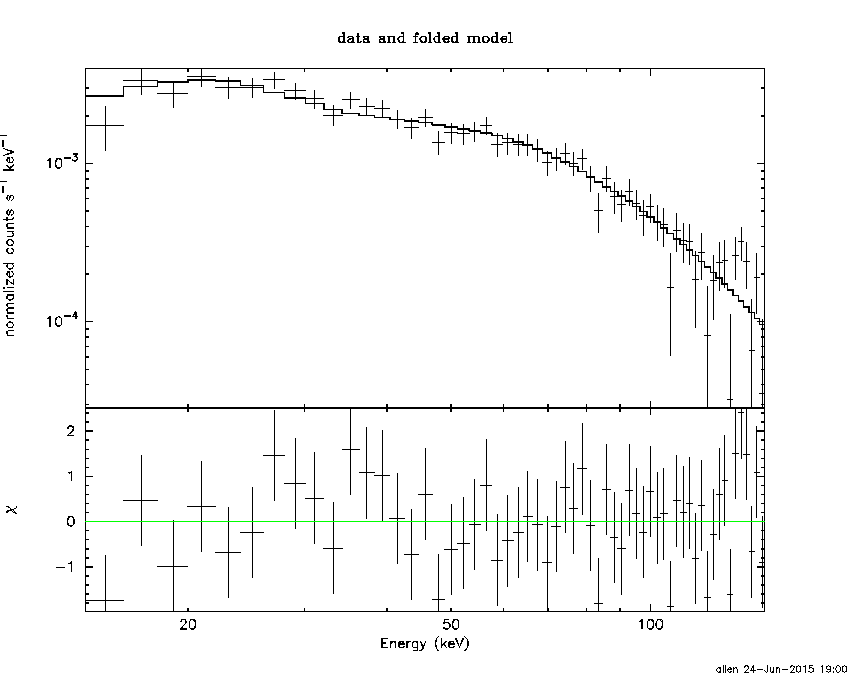
Pre-slew spectrum (Pre-slew PHA with pre-slew DRM)
Power-law model

Spectral model in power-law:
------------------------------------------------------------
Parameters  : value       lower 90%   higher 90%
Photon index: 1.25496     ( -0.0672258   0.0666927 )
Norm@50keV  : 1.08861E-02    ( -0.000419638   0.000419437 )
------------------------------------------------------------
#Fit statistic : Chi-Squared =          56.82 using 59 PHA bins.
# Reduced chi-squared =         0.9969 for     57 degrees of freedom
# Null hypothesis probability =   4.816420e-01

Photon flux (15-150 keV)    in 17.03 sec: 1.28858 ( -0.0531014  0.0532097 ) ph/cm2/s
Energy fluence (15-150 keV)             : 1.85297e-06 ( -7.49819e-08  7.50878e-08 ) ergs/cm2
Cutoff power-law model
Spectral model in the cutoff power-law:
------------------------------------------------------------
Parameters  : value       lower 90%   higher 90%
Photon index: 0.901022     ( -0.279764   0.262668 )
Epeak [keV] : 173.509      ( -52.6399 301.896 )
Norm@50keV  : 1.58113E-02    ( -0.00373384   0.00522157 )
------------------------------------------------------------
#Fit statistic : Chi-Squared =          51.42 using 59 PHA bins.
# Reduced chi-squared =         0.9182 for     56 degrees of freedom
# Null hypothesis probability =   6.487820e-01

Photon flux (15-150 keV)    in 17.03 sec: 1.26705 ( -0.05526  0.05537 ) ph/cm2/s
Energy fluence (15-150 keV)             : 1.82173e-06 ( -7.96663e-08  7.93598e-08 ) ergs/cm2
Band function
Spectral model in the Band function:
------------------------------------------------------------
Parameters  : value       lower 90%   higher 90%
alpha       : 1.19148   ( -0.912794   -0.315335 )
beta        : -1.38433    ( -0.123108   0.107255 )
Epeak [keV] : 42.6610      ( -21.6153 40.1092 )
Norm@50keV   : 0.393229    ( -0.39089   113.324 )
------------------------------------------------------------
#Fit statistic : Chi-Squared =          45.78 using 59 PHA bins.
# Reduced chi-squared =         0.8323 for     55 degrees of freedom
# Null hypothesis probability =   8.076318e-01

Photon flux (15-150 keV)    in 17.03 sec:  (    ) ph/cm2/s
Energy fluence (15-150 keV)             : 0 ( 0  0 ) ergs/cm2
S(25-50 keV) vs. S(50-100 keV) plot

S(25-50 keV)  = 5.57e-07
S(50-100 keV) = 8.27e-07
T90 vs. Hardness ratio plot

T90                                   = 28.4480000138283 sec.
Hardness ratio (energy fluence ratio) = 1.48474
Color vs. Color plot

Count Ratio  (25-50 keV) / (15-25 keV) = 1.5671
Count Ratio (50-100 keV) / (15-25 keV) = 1.2921
Mask shadow pattern
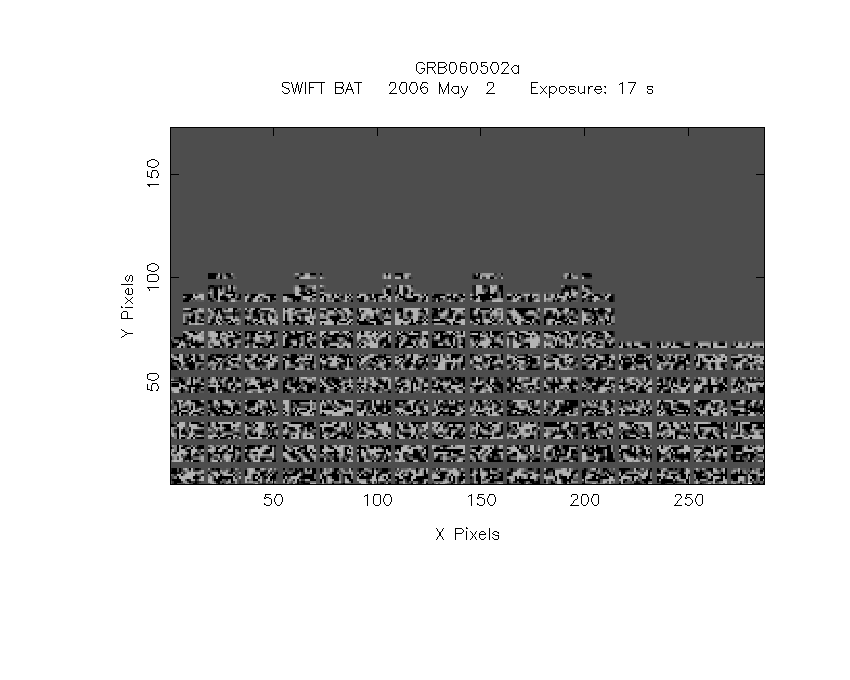
IMX = -4.649187605341465E-01, IMY = 5.202310314464613E-01
TIME vs. PHA plot around the trigger time

Blue+Cyan dotted lines: Time interval of the scaled map
From 0.000000 to 1.024000
TIME vs. DetID plot around the trigger time

Blue+Cyan dotted lines: Time interval of the scaled map
From 0.000000 to 1.024000
100 us light curve (15-350 keV)

Blue+Cyan dotted lines: Time interval of the scaled map
From 0.000000 to 1.024000
Spacecraft aspect plot

Bright source in the pre-burst/pre-slew/post-slew images
Pre-burst image of 15-350 keV band
Time interval of the image:
-214.411400 -5.644000

# RAcent  DECcent POSerr Theta    Phi  PeakCts   SNR AngSep     Name
#  [deg]    [deg]    ['] [deg]  [deg]                   [']
254.4531  35.3365    0.8   2.7 -131.7   2.0461  13.7    0.4	Her X-1
268.4312  -1.5394    8.2  36.5   35.0   0.3786   1.4    6.4	SW J1753.5-0127
288.8058  10.9268    0.9  37.9   -4.8   2.7933  12.3    1.2	GRS 1915+105
299.5967  35.2001    0.3  36.8  -48.6   8.5765  34.7    0.3	Cyg X-1
308.0142  40.7732    6.8  42.6  -58.7  -0.8280  -1.7   11.6	Cyg X-3
180.8074  51.8358    2.7  55.5 -168.3   2.2940   4.3 ------	UNKNOWN
227.8944  62.4154    2.6  34.3 -144.0   0.9266   4.5 ------	UNKNOWN
295.8252  65.8005    3.5  41.1  -98.0   2.4990   3.3 ------	UNKNOWN
Pre-slew background subtracted image of 15-350 keV band
Time interval of the image:
-5.644000 11.388600

# RAcent  DECcent POSerr Theta    Phi  PeakCts   SNR AngSep     Name
#  [deg]    [deg]    ['] [deg]  [deg]                   [']
254.7100  35.3896    7.8   2.7 -127.1   0.0590   1.5   12.7	Her X-1
268.3293  -1.5814    7.8  36.5   35.1  -0.1093  -1.5    8.1	SW J1753.5-0127
288.8042  10.9510   59.6  37.9   -4.8  -0.0116  -0.2    0.5	GRS 1915+105
299.5033  35.2510   77.7  36.7  -48.7   0.0103   0.1    5.2	Cyg X-1
308.2260  40.8637    8.2  42.7  -58.9  -0.2079  -1.4    7.5	Cyg X-3
271.1077   5.5079    2.4  31.1   25.6   0.2776   4.8 ------	UNKNOWN
186.7048  45.3496    2.1  52.9 -177.0   0.6435   5.4 ------	UNKNOWN
299.7808   2.9171    2.2  51.4   -6.3   0.5512   5.3 ------	UNKNOWN
240.9229  66.6032    0.3  34.9 -131.8   2.7729  39.1 ------	UNKNOWN
Post-slew image of 15-350 keV band
Time interval of the image:
65.188600 535.988600

# RAcent  DECcent POSerr Theta    Phi  PeakCts   SNR AngSep     Name
#  [deg]    [deg]    ['] [deg]  [deg]                   [']
254.4355  35.3577    1.0  32.2   48.0   4.9536  11.8    1.4	Her X-1
299.5985  35.2044    0.3  45.8   -8.1  16.9574  35.4    0.4	Cyg X-1
308.1543  41.1145    7.4  44.0  -20.5  -0.7067  -1.6    9.9	Cyg X-3
326.1550  38.3479    6.8  53.5  -34.5   2.1003   1.7    1.8	Cyg X-2
131.6316  41.8038    3.1  59.1 -166.2   9.3776   3.7 ------	UNKNOWN
343.2379  74.7274    4.2  30.4  -80.4   1.1816   2.8 ------	UNKNOWN
318.8689  28.9381    2.8  58.9  -22.7   7.0234   4.1 ------	UNKNOWN
 99.8254  59.1959    3.7  51.0 -135.5   5.5426   3.2 ------	UNKNOWN
Plot creation:
Wed Jun 24 19:00:43 EDT 2015