Special notes of this burst
Image
Pre-slew 15.0-350.0 keV image (Event data)
#   RAcent    DECcent   POSerr    Theta     Phi              Peak Cts       SNR   Name
  278.9615    52.6269   0.0142    23.1736    -2.2798         0.0691768     13.627 TRIG_00208275

Foreground time interval of the image:
 -0.004   0.172 (delta_t =   0.176 [sec])
Background time interval of the image:
-239.204  -0.004 (delta_t = 239.200 [sec])
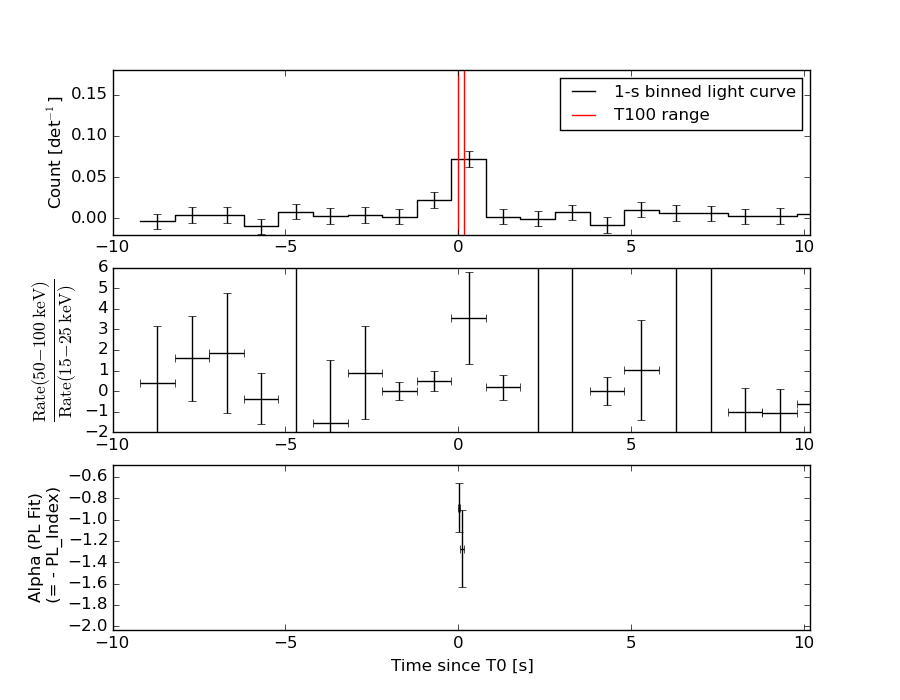
Lightcurves
Notes:
- 1) The mask-weighted light curves are using the flight position.
- 2) Multiple plots of different time binning/intervals are shown to cover all scenarios of short/long GRBs, rate/image triggers, and real/false positives.
- 3) For all the mask-weighted lightcurves, the y-axis units are counts/sec/det where a det is 0.4 x 0.4 = 0.16 sq cm.
- 4) The verticle lines correspond to following: green dotted lines are T50 interval, black dotted lines are T90 interval, blue solid line(s) is a spacecraft slew start time, and orange solid line(s) is a spacecraft slew end time.
- 5) Time of each bin is in the middle of the bin.
1 s binning
From T0-310 s to T0+310 s

From T100_start - 20 s to T100_end + 30 s
Full time interval
64 ms binning
Full time interval
From T100_start to T100_end
From T0-5 sec to T0+5 sec
16 ms binning
From T100_start-5 s to T100_start+5 s
Blue+Cyan dotted lines: Time interval of the scaled map
From 0.000000 to 0.064000
8 ms binning
From T100_start-3 s to T100_start+3 s
Blue+Cyan dotted lines: Time interval of the scaled map
From 0.000000 to 0.064000
2 ms binning
From T100_start-1 s to T100_start+1 s
Blue+Cyan dotted lines: Time interval of the scaled map
From 0.000000 to 0.064000
SN=5 or 10 sec. binning (whichever binning is satisfied first)
SN=5 or 10 sec. binning (T < 200 sec)
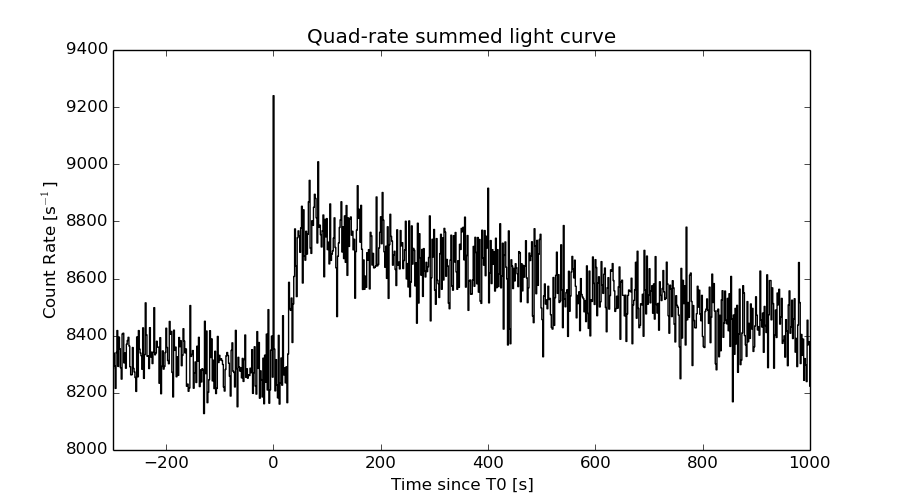
Quad-rate summed light curves (from T0-300s to T0+1000s)
Spectral Evolution
Spectra
Notes:
- 1) The fitting includes the systematic errors.
- 2) When the burst includes telescope slew time periods, the fitting uses an average response file made from multiple 5-s response files through out the slew time plus single time preiod for the non-slew times, and weighted by the total counts in the corresponding time period using addrmf. An average response file is needed becuase a spectral fit using the pre-slew DRM will introduce some errors in both a spectral shape and a normalization if the PHA file contains a lot of the slew/post-slew time interval.
- 3) For fits to more complicated models (e.g. a power-law over a cutoff power-law), the BAT team has decided to require a chi-square improvement of more than 6 for each extra dof.
Time averaged spectrum fit using the average DRM
Power-law model
Time interval is from   -0.004 sec. to    0.172 sec.

Spectral model in power-law:
------------------------------------------------------------
Parameters  : value       lower 90%   higher 90%
Photon index: 0.984509     ( -0.205259   0.197722 )
Norm@50keV  : 2.56841E-02    ( -0.00314486   0.00313586 )
------------------------------------------------------------
#Fit statistic : Chi-Squared =          56.96 using 59 PHA bins.
# Reduced chi-squared =         0.9993 for     57 degrees of freedom
# Null hypothesis probability =   4.766408e-01

Photon flux (15-150 keV)    in 0.176 sec: 2.95479 ( -0.366024  0.366637 ) ph/cm2/s
Energy fluence (15-150 keV)             : 4.91383e-08 ( -6.43296e-09  6.50403e-09 ) ergs/cm2
Cutoff power-law model

Time interval is from   -0.004 sec. to    0.172 sec.
Spectral model in the cutoff power-law:
------------------------------------------------------------
Parameters  : value       lower 90%   higher 90%
Photon index: 0.105197     ( -1.17757   0.886986 )
Epeak [keV] : 117.948      ( -39.4884 -117.948 )
Norm@50keV  : 6.61782E-02    ( -0.04076   0.157349 )
------------------------------------------------------------
#Fit statistic : Chi-Squared =          54.26 using 59 PHA bins.
# Reduced chi-squared =         0.9688 for     56 degrees of freedom
# Null hypothesis probability =   5.411845e-01

Photon flux (15-150 keV)    in 0.176 sec: 2.87298 ( -0.38047  0.3785 ) ph/cm2/s
Energy fluence (15-150 keV)             : 4.67423e-08 ( -7.27338e-09  7.13117e-09 ) ergs/cm2
Band function
Time interval is from   -0.004 sec. to    0.172 sec.

Spectral model in the Band function:
------------------------------------------------------------
Parameters  : value       lower 90%   higher 90%
alpha       : 0.546195   ( -1.31184   -0.571254 )
beta        : -1.51633    ( 1.5189   0.533818 )
Epeak [keV] : 81.2762      ( -44.4733 83.3163 )
Norm@50keV   : 0.148926    ( -0.163463   75.8879 )
------------------------------------------------------------
#Fit statistic : Chi-Squared =          52.73 using 59 PHA bins.
# Reduced chi-squared =         0.9587 for     55 degrees of freedom
# Null hypothesis probability =   5.619241e-01

Photon flux (15-150 keV)    in 0.176 sec:  (    ) ph/cm2/s
Energy fluence (15-150 keV)             : 0 ( 0  0 ) ergs/cm2
Single BB
Spectral model blackbody:
------------------------------------------------------------
Parameters  : value    Lower 90%  Upper 90%
kT [keV]    : 20.1947  (-2.76028  3.48036)
R^2/D10^2   : 0.142765  (-0.0572333   0.0872227)
(R is the radius in km and D10 is the distance to the source in units of 10 kpc)
------------------------------------------------------------
#Fit statistic : Chi-Squared =          58.64 using 59 PHA bins.
# Reduced chi-squared =          1.029 for     57 degrees of freedom
# Null hypothesis probability =   4.151712e-01

Energy  Fluence     90% Error
[keV]   [erg/cm2]   [erg/cm2]
15- 25  1.968e-09   4.327e-10
25- 50  9.865e-09   1.738e-09
50-150  2.986e-08   6.486e-09
15-150  4.169e-08   7.647e-09
Thermal bremsstrahlung (OTTB)
Spectral model: thermal bremsstrahlung
------------------------------------------------------------
Parameters  : value         Lower 90%    Upper 90%
kT [keV]    : 200.000       (      )
Norm        : 11.8513       (-1.513     1.51296)
------------------------------------------------------------
#Fit statistic : Chi-Squared =          76.59 using 59 PHA bins.
# Reduced chi-squared =          1.344 for     57 degrees of freedom
# Null hypothesis probability =   4.277783e-02

Energy  Fluence     90% Error
[keV]   [erg/cm2]   [erg/cm2]
15- 25  5.192e-09   2.894e-09
25- 50  9.988e-09   5.574e-09
50-150  2.190e-08   1.215e-08
15-150  3.709e-08   2.065e-08
Double BB
R1^2/D10^2  : 0.291293        (      )
kT2 [keV]   : 200.000        (      )
R2^2/D10^2  : 3.91947E-04    (-0.000224063   0.00302798)
------------------------------------------------------------
#Fit statistic : Chi-Squared =          51.91 using 59 PHA bins.
#Fit statistic : Chi-Squared =          51.61 using 59 PHA bins.
#Fit statistic : Chi-Squared =          51.60 using 59 PHA bins.
# Reduced chi-squared =         0.9439 for     55 degrees of freedom
# Reduced chi-squared =         0.9384 for     55 degrees of freedom
# Reduced chi-squared =         0.9382 for     55 degrees of freedom
# Null hypothesis probability =   5.933217e-01
# Null hypothesis probability =   6.048194e-01
# Null hypothesis probability =   6.052946e-01

Energy  Fluence     90% Error
[keV]   [erg/cm2]   [erg/cm2]
15- 25  2.594e-09   1.486e-09
25- 50  1.050e-08   6.095e-09
50-150  3.412e-08   1.752e-08
15-150  4.721e-08   2.292e-08
Peak spectrum fit
Power-law model

Time interval is from   -0.408 sec. to    0.592 sec.

Spectral model in power-law:
------------------------------------------------------------
Parameters  : value       lower 90%   higher 90%
Photon index: 0.814690     ( -0.378748   0.342204 )
Norm@50keV  : 5.35001E-03    ( -0.00112329   0.00109114 )
------------------------------------------------------------
#Fit statistic : Chi-Squared =          65.16 using 59 PHA bins.
# Reduced chi-squared =          1.143 for     57 degrees of freedom
# Null hypothesis probability =   2.141249e-01

Photon flux (15-150 keV)    in 1 sec: 0.614589 ( -0.123735  0.124873 ) ph/cm2/s
Energy fluence (15-150 keV)             : 6.21366e-08 ( -1.24883e-08  1.25852e-08 ) ergs/cm2
Cutoff power-law model
Time interval is from   -0.408 sec. to    0.592 sec.
Spectral model in the cutoff power-law:
------------------------------------------------------------
Parameters  : value       lower 90%   higher 90%
Photon index: 0.457426     ( -2.30007   0.551984 )
Epeak [keV] : 256.891      ( -341.421 -341.421 )
Norm@50keV  : 7.56337E-03    (     )
------------------------------------------------------------
#Fit statistic : Chi-Squared =          64.94 using 59 PHA bins.
# Reduced chi-squared =          1.160 for     56 degrees of freedom
# Null hypothesis probability =   1.932098e-01

Photon flux (15-150 keV)    in 1 sec: 0.603698 ( -0.131134  0.130434 ) ph/cm2/s
Energy fluence (15-150 keV)             : 6.09801e-08 ( -1.39701e-08  1.31905e-08 ) ergs/cm2
Band function

Time interval is from   -0.408 sec. to    0.592 sec.

Spectral model in the Band function:
------------------------------------------------------------
Parameters  : value       lower 90%   higher 90%
alpha       : -0.854745   ( 0.854745   0.854745 )
beta        : -0.814688    ( -0.342197   0.378644 )
Epeak [keV] : 15.3337      ( -15.3337 -15.3337 )
Norm@50keV   : 7.72121E-03    ( -0.00346787   0 )
------------------------------------------------------------
#Fit statistic : Chi-Squared =          65.16 using 59 PHA bins.
# Reduced chi-squared =          1.185 for     55 degrees of freedom
# Null hypothesis probability =   1.642048e-01

Photon flux (15-150 keV)    in 1 sec:  (    ) ph/cm2/s
Energy fluence (15-150 keV)             : 0 ( 0  0 ) ergs/cm2
Single BB
Spectral model blackbody:
------------------------------------------------------------
Parameters  : value    Lower 90%  Upper 90%
kT [keV]    : 24.4081  (-5.6586  9.31356)
R^2/D10^2   : 1.65918E-02  (-0.0102168   0.0213228)
(R is the radius in km and D10 is the distance to the source in units of 10 kpc)
------------------------------------------------------------
#Fit statistic : Chi-Squared =          67.12 using 59 PHA bins.
# Reduced chi-squared =          1.177 for     57 degrees of freedom
# Null hypothesis probability =   1.689595e-01

Energy  Fluence     90% Error
[keV]   [erg/cm2]   [erg/cm2]
15- 25  1.739e-09   7.226e-10
25- 50  9.743e-09   3.836e-09
50-150  4.317e-08   1.599e-08
15-150  5.466e-08   2.170e-08
Thermal bremsstrahlung (OTTB)
Spectral model: thermal bremsstrahlung
------------------------------------------------------------
Parameters  : value         Lower 90%    Upper 90%
kT [keV]    : 200.000       (      )
Norm        : 2.50147       (-0.520868     0.52081)
------------------------------------------------------------
#Fit statistic : Chi-Squared =          77.41 using 59 PHA bins.
# Reduced chi-squared =          1.358 for     57 degrees of freedom
# Null hypothesis probability =   3.732565e-02

Energy  Fluence     90% Error
[keV]   [erg/cm2]   [erg/cm2]
15- 25  6.233e-09   3.688e-09
25- 50  1.199e-08   7.025e-09
50-150  2.630e-08   1.532e-08
15-150  4.452e-08   2.576e-08
Double BB
------------------------------------------------------------
#Fit statistic : Chi-Squared =          66.01 using 59 PHA bins.
#Fit statistic : Chi-Squared =          64.39 using 59 PHA bins.
#Fit statistic : Chi-Squared =          64.29 using 59 PHA bins.
#Fit statistic : Chi-Squared =          64.21 using 59 PHA bins.
# Reduced chi-squared =          1.200 for     55 degrees of freedom
# Reduced chi-squared =          1.171 for     55 degrees of freedom
# Reduced chi-squared =          1.169 for     55 degrees of freedom
# Reduced chi-squared =          1.168 for     55 degrees of freedom
# Null hypothesis probability =   1.470116e-01
# Null hypothesis probability =   1.808964e-01
# Null hypothesis probability =   1.832901e-01
# Null hypothesis probability =   1.849896e-01

Energy  Fluence     90% Error
[keV]   [erg/cm2]   [erg/cm2]
15- 25  3.213e-09   1.990e-09
25- 50  9.244e-09   4.938e-09
50-150  4.479e-08   2.600e-08
15-150  5.725e-08   3.143e-08
Pre-slew spectrum (Pre-slew PHA with pre-slew DRM)
Power-law model

Spectral model in power-law:
------------------------------------------------------------
Parameters  : value       lower 90%   higher 90%
Photon index: 0.984509     ( -0.205259   0.197722 )
Norm@50keV  : 2.56841E-02    ( -0.00314486   0.00313586 )
------------------------------------------------------------
#Fit statistic : Chi-Squared =          56.96 using 59 PHA bins.
# Reduced chi-squared =         0.9993 for     57 degrees of freedom
# Null hypothesis probability =   4.766408e-01

Photon flux (15-150 keV)    in 0.176 sec: 2.95479 ( -0.366024  0.366637 ) ph/cm2/s
Energy fluence (15-150 keV)             : 4.91383e-08 ( -6.43296e-09  6.50403e-09 ) ergs/cm2
Cutoff power-law model
Spectral model in the cutoff power-law:
------------------------------------------------------------
Parameters  : value       lower 90%   higher 90%
Photon index: 0.105197     ( -1.17757   0.886986 )
Epeak [keV] : 117.948      ( -39.4884 -117.948 )
Norm@50keV  : 6.61782E-02    ( -0.04076   0.157349 )
------------------------------------------------------------
#Fit statistic : Chi-Squared =          54.26 using 59 PHA bins.
# Reduced chi-squared =         0.9688 for     56 degrees of freedom
# Null hypothesis probability =   5.411845e-01

Photon flux (15-150 keV)    in 0.176 sec: 2.87298 ( -0.38047  0.3785 ) ph/cm2/s
Energy fluence (15-150 keV)             : 4.67423e-08 ( -7.27338e-09  7.13117e-09 ) ergs/cm2
Band function

Spectral model in the Band function:
------------------------------------------------------------
Parameters  : value       lower 90%   higher 90%
alpha       : 0.546195   ( -1.31184   -0.571254 )
beta        : -1.51633    ( 1.5189   0.533818 )
Epeak [keV] : 81.2762      ( -44.4733 83.3163 )
Norm@50keV   : 0.148926    ( -0.163463   75.8685 )
------------------------------------------------------------
#Fit statistic : Chi-Squared =          52.73 using 59 PHA bins.
# Reduced chi-squared =         0.9587 for     55 degrees of freedom
# Null hypothesis probability =   5.619241e-01

Photon flux (15-150 keV)    in 0.176 sec:  (    ) ph/cm2/s
Energy fluence (15-150 keV)             : 0 ( 0  0 ) ergs/cm2
S(25-50 keV) vs. S(50-100 keV) plot
S(25-50 keV)  = 9.01e-09
S(50-100 keV) = 1.82e-08
T90 vs. Hardness ratio plot
T90                                   = 0.143999993801117 sec.
Hardness ratio (energy fluence ratio) = 2.01998
Color vs. Color plot
Count Ratio  (25-50 keV) / (15-25 keV) = 2.56275
Count Ratio (50-100 keV) / (15-25 keV) = 2.89411
Mask shadow pattern
IMX = 4.277172360753796E-01, IMY = 1.702765592760256E-02
TIME vs. PHA plot around the trigger time

Blue+Cyan dotted lines: Time interval of the scaled map
From 0.000000 to 0.064000
TIME vs. DetID plot around the trigger time
Blue+Cyan dotted lines: Time interval of the scaled map
From 0.000000 to 0.064000
100 us light curve (15-350 keV)

Blue+Cyan dotted lines: Time interval of the scaled map
From 0.000000 to 0.064000
Spacecraft aspect plot
Bright source in the pre-burst/pre-slew/post-slew images
Pre-burst image of 15-350 keV band
Time interval of the image:
-239.204000 -0.004000

# RAcent  DECcent POSerr Theta    Phi  PeakCts   SNR AngSep     Name
#  [deg]    [deg]    ['] [deg]  [deg]                   [']
254.5182  35.3604    2.0  32.2   48.5   1.7895   5.9    3.2	Her X-1
299.5934  35.1977    0.5  45.7   -7.5   7.6849  23.4    0.3	Cyg X-1
308.2401  41.1354    0.0  44.0  -20.1  -0.3293  -1.1   12.4	Cyg X-3
326.2671  38.1966    0.0  53.6  -33.9   0.4770   0.5    8.8	Cyg X-2
 14.8768  68.8429    3.1  40.9  -87.1   3.2845   3.7 ------	UNKNOWN
Pre-slew background subtracted image of 15-350 keV band
Time interval of the image:
-0.004000 0.172000

# RAcent  DECcent POSerr Theta    Phi  PeakCts   SNR AngSep     Name
#  [deg]    [deg]    ['] [deg]  [deg]                   [']
254.4158  35.2768   11.4  32.3   48.6   0.0088   1.0    4.4	Her X-1
299.7345  35.1788   14.1  45.8   -7.6  -0.0075  -0.8    7.2	Cyg X-1
307.9743  40.8321  152.1  44.2  -19.6   0.0007   0.1    9.5	Cyg X-3
326.2043  38.2853   30.7  53.5  -33.9  -0.0080  -0.4    2.7	Cyg X-2
278.9615  52.6269    0.8  23.2   -2.3   0.0692  13.6 ------	UNKNOWN
139.8548  43.8415    2.6  54.5 -170.9   0.0651   4.4 ------	UNKNOWN
Post-slew image of 15-350 keV band
Time interval of the image:
54.496590 962.846800

# RAcent  DECcent POSerr Theta    Phi  PeakCts   SNR AngSep     Name
#  [deg]    [deg]    ['] [deg]  [deg]                   [']
254.4447  35.3133    0.9  24.5   88.6   8.5507  12.3    1.9	Her X-1
288.8186  10.9581    1.1  42.4   19.4  10.2839  10.8    1.4	GRS 1915+105
299.5900  35.2024    0.2  22.7  -14.4  32.8112  66.3    0.1	Cyg X-1
307.9242  40.9284    5.9  22.8  -37.0   0.9911   2.0    8.6	Cyg X-3
326.1975  38.3245    4.3  35.3  -51.6   1.9256   2.7    1.2	Cyg X-2
254.8539  26.6079    2.6  31.6   77.9   4.1894   4.4 ------	UNKNOWN
140.6897  63.8636    3.2  59.1 -166.2  14.1297   3.7 ------	UNKNOWN
106.7038  80.0343    2.9  47.3 -148.0   4.6771   3.9 ------	UNKNOWN
Plot creation:
Sun May 31 13:22:59 EDT 2015