Special notes of this burst
Image
15.0-350.0 keV image (Event data)

#RAcent DECcent POSerr Theta  Phi  Peak_Cts  SNR Name
331.770 -27.824 0.000 49.716 22.125 1.004 6.490 TRIG_00208654

Image time interval: 0.000 to 7.000 [sec]
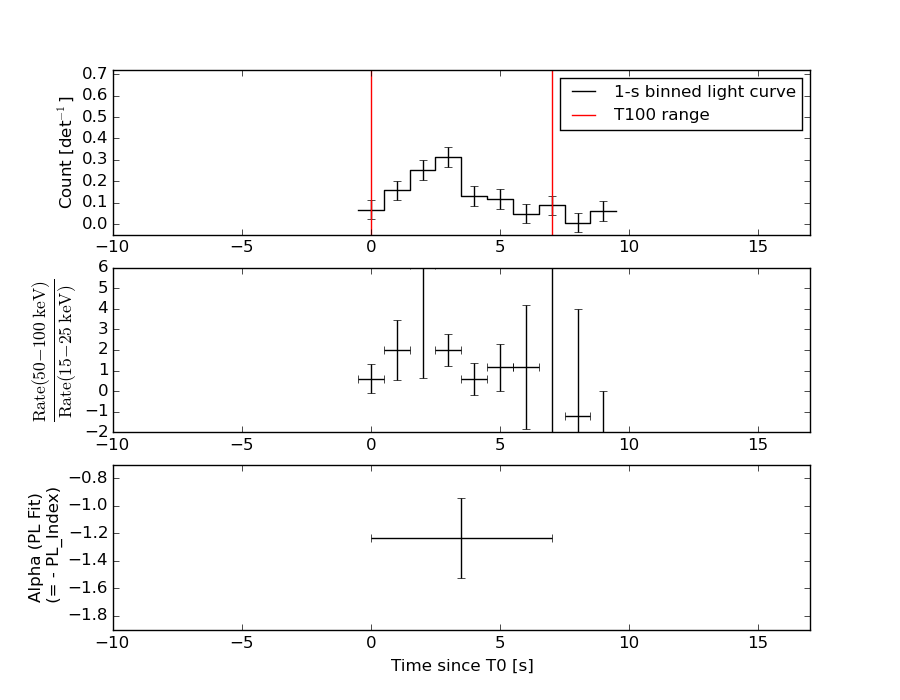
Lightcurves
Notes:
- 1) The mask-weighted lightcurves have units of either count/det or counts/sec/det, where a det is 0.4 x 0.4 = 0.16 sq cm.
- 2) The verticle lines correspond to following: green dotted lines are T50 interval, black dotted lines are T90 interval, blue solid line(s) is a spacecraft slew start time, and orange solid line(s) is a spacecraft slew end time (for the best duration plot, slew times are marked by green arrows).
- 3) For lightcurves in unit of count rate, time of each bin is in the middle of the bin.
Best duration plot

1 s binning
From T0-310 s to T0+310 s

From T100_start - 20 s to T100_end + 30 s

Full time interval

64 ms binning
Full time interval

From T100_start to T100_end

From T0-5 sec to T0+5 sec

16 ms binning
From T100_start-5 s to T100_start+5 s

8 ms binning
From T100_start-3 s to T100_start+3 s

2 ms binning
From T100_start-1 s to T100_start+1 s

SN=5 or 10 sec. binning (whichever binning is satisfied first)

SN=5 or 10 sec. binning (T < 200 sec)

Quad-rate summed light curves (from T0-300s to T0+1000s)

Spectral Evolution
Spectra
Notes:
- 1) The fitting includes the systematic errors.
- 2) For long bursts, a spectral fit of the pre-slew DRM will introduce some errors in both a spectral shape and a normalization if the PHA file contains a lot of the slew/post-slew time interval.
- 3) For fits to more complicated models (e.g. a power-law over a cutoff power-law), the BAT team has decided to require a chi-square improvement of more than 6 for each extra dof.
- 4) For short bursts (T90<1sec), the specrtum is also fit with Blackbody, OTTB, and Double Blackbody.
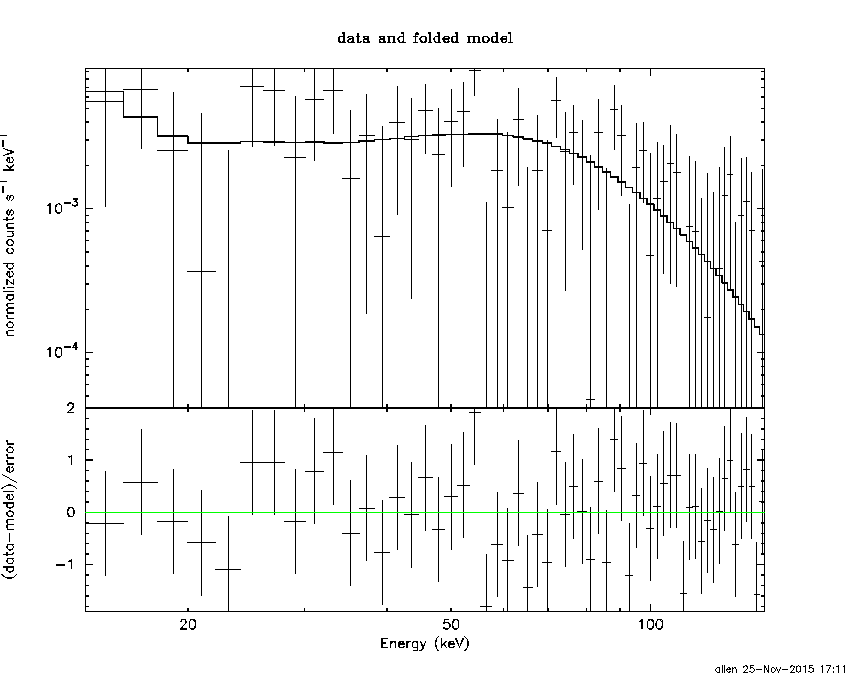
Time averaged spectrum fit using the pre-slew DRM
Power-law model

Time interval is from    0.000 sec. to    7.000 sec.

Spectral model in power-law:
------------------------------------------------------------
Parameters  : value       lower 90%   higher 90%
Photon index: 1.23268     ( -0.292754   0.291193 )
Norm@50keV  : 1.12328E-02    ( -0.00189747   0.00189657 )
------------------------------------------------------------
#Fit statistic : Chi-Squared =          60.43 using 59 PHA bins.
# Reduced chi-squared =          1.060 for     57 degrees of freedom
# Null hypothesis probability =   3.531757e-01

Photon flux (15-150 keV)    in 7 sec: 1.32488 ( -0.229249  0.229945 ) ph/cm2/s
Energy fluence (15-150 keV)             : 7.90566e-07 ( -1.47587e-07  1.4936e-07 ) ergs/cm2
Cutoff power-law model

Time interval is from    0.000 sec. to    7.000 sec.
Spectral model in the cutoff power-law:
------------------------------------------------------------
Parameters  : value       lower 90%   higher 90%
Photon index: 0.626801     ( -1.39939   0.833217 )
Epeak [keV] : 124.923      ( -124.929 -124.929 )
Norm@50keV  : 2.14645E-02    ( -0.0117389   0.0675286 )
------------------------------------------------------------
#Fit statistic : Chi-Squared =          59.58 using 59 PHA bins.
# Reduced chi-squared =          1.064 for     56 degrees of freedom
# Null hypothesis probability =   3.468939e-01

Photon flux (15-150 keV)    in 7 sec: 1.29215 ( -0.23716  0.2375 ) ph/cm2/s
Energy fluence (15-150 keV)             : 7.67585e-07 ( -1.5633e-07  1.56562e-07 ) ergs/cm2
Band function

Time interval is from    0.000 sec. to    7.000 sec.

Spectral model in the Band function:
------------------------------------------------------------
Parameters  : value       lower 90%   higher 90%
alpha       : -0.690917   ( -0.435224   1.69998 )
beta        : -10.0000    ( 10   7.10543e-15 )
Epeak [keV] : 130.542      ( -59.4187 -130.904 )
Norm@50keV   : 2.03049E-02    ( -0.0105858   0.0690666 )
------------------------------------------------------------
#Fit statistic : Chi-Squared =          59.59 using 59 PHA bins.
# Reduced chi-squared =          1.083 for     55 degrees of freedom
# Null hypothesis probability =   3.124880e-01

Photon flux (15-150 keV)    in 7 sec: 1.30481 (    ) ph/cm2/s
Energy fluence (15-150 keV)             : 0 ( 0  0 ) ergs/cm2
Single BB

Spectral model blackbody:
------------------------------------------------------------
Parameters  : value    Lower 90%  Upper 90%
kT [keV]    : 19.0824  (-3.69327  4.8355)
R^2/D10^2   : 7.19373E-02  (-0.0377733   0.0747628)
(R is the radius in km and D10 is the distance to the source in units of 10 kpc)
------------------------------------------------------------
#Fit statistic : Chi-Squared =          64.60 using 59 PHA bins.
# Reduced chi-squared =          1.133 for     57 degrees of freedom
# Null hypothesis probability =   2.283731e-01

Energy  Fluence     90% Error
[keV]   [erg/cm2]   [erg/cm2]
15- 25  3.599e-08   1.340e-08
25- 50  1.736e-07   4.714e-08
50-150  4.650e-07   1.557e-07
15-150  6.746e-07   1.753e-07
Thermal bremsstrahlung (OTTB)

Spectral model: thermal bremsstrahlung
------------------------------------------------------------
Parameters  : value         Lower 90%    Upper 90%
kT [keV]    : 200.000       (-62.2853      -200)
Norm        : 5.48065       (-0.939778     0.939778)
------------------------------------------------------------
#Fit statistic : Chi-Squared =          63.32 using 59 PHA bins.
# Reduced chi-squared =          1.111 for     57 degrees of freedom
# Null hypothesis probability =   2.633377e-01

Energy  Fluence     90% Error
[keV]   [erg/cm2]   [erg/cm2]
15- 25  9.554e-08   5.471e-08
25- 50  1.838e-07   1.065e-07
50-150  4.030e-07   2.268e-07
15-150  6.823e-07   3.924e-07
Double BB

Spectral model: bbodyrad<1> + bbodyrad<2>
------------------------------------------------------------
Parameters  : value         Lower 90%    Upper 90%
kT1 [keV]   : 6.92878        (-3.73356      5.84719)
R1^2/D10^2  : 1.02637        (-0.874503      21.0911)
kT2 [keV]   : 26.6601        (-7.6678      25.2601)
R2^2/D10^2  : 2.03489E-02    (-0.0180697   0.0470889)
------------------------------------------------------------
#Fit statistic : Chi-Squared =          58.71 using 59 PHA bins.
# Reduced chi-squared =          1.067 for     55 degrees of freedom
# Null hypothesis probability =   3.411065e-01

Energy  Fluence     90% Error
[keV]   [erg/cm2]   [erg/cm2]
15- 25  7.180e-08   4.309e-08
25- 50  1.730e-07   9.145e-08
50-150  5.295e-07   3.081e-07
15-150  7.743e-07   4.116e-07
Peak spectrum fit
Power-law model

Time interval is from    2.400 sec. to    3.400 sec.

Spectral model in power-law:
------------------------------------------------------------
Parameters  : value       lower 90%   higher 90%
Photon index: 0.969326     ( -0.455161   0.423535 )
Norm@50keV  : 2.06213E-02    ( -0.00531855   0.00522984 )
------------------------------------------------------------
#Fit statistic : Chi-Squared =          38.15 using 59 PHA bins.
# Reduced chi-squared =         0.6694 for     57 degrees of freedom
# Null hypothesis probability =   9.740646e-01

Photon flux (15-150 keV)    in 1 sec: 2.37061 ( -0.612207  0.616389 ) ph/cm2/s
Energy fluence (15-150 keV)             : 2.25471e-07 ( -5.93872e-08  5.98868e-08 ) ergs/cm2
Cutoff power-law model

Time interval is from    2.400 sec. to    3.400 sec.
Spectral model in the cutoff power-law:
------------------------------------------------------------
Parameters  : value       lower 90%   higher 90%
Photon index: 2.24640     (     )
Epeak [keV] : 81.4976      (   )
Norm@50keV  : 1.24426E-03    (     )
------------------------------------------------------------
#Fit statistic : Chi-Squared =          37.23 using 59 PHA bins.
# Reduced chi-squared =         0.6649 for     56 degrees of freedom
# Null hypothesis probability =   9.748406e-01

Photon flux (15-150 keV)    in 1 sec: 2.31629 ( -0.63076  0.63401 ) ph/cm2/s
Energy fluence (15-150 keV)             : 2.20943e-07 ( -6.3191e-08  6.1877e-08 ) ergs/cm2
Band function

Time interval is from    2.400 sec. to    3.400 sec.

Spectral model in the Band function:
------------------------------------------------------------
Parameters  : value       lower 90%   higher 90%
alpha       : -0.862735   ( 0.862703   0.862703 )
beta        : -0.969340    ( -0.423384   0.455255 )
Epeak [keV] : 24.9072      ( -25.0222 -25.0222 )
Norm@50keV   : 3.18037E-02    ( -0.0163074   3.48184 )
------------------------------------------------------------
#Fit statistic : Chi-Squared =          38.15 using 59 PHA bins.
# Reduced chi-squared =         0.6937 for     55 degrees of freedom
# Null hypothesis probability =   9.592581e-01

Photon flux (15-150 keV)    in 1 sec:  (    ) ph/cm2/s
Energy fluence (15-150 keV)             : 0 ( 0  0 ) ergs/cm2
Single BB

Spectral model blackbody:
------------------------------------------------------------
Parameters  : value    Lower 90%  Upper 90%
kT [keV]    : 22.8034  (-6.18837  10.3203)
R^2/D10^2   : 7.80944E-02  (-0.0533607   0.136331)
(R is the radius in km and D10 is the distance to the source in units of 10 kpc)
------------------------------------------------------------
#Fit statistic : Chi-Squared =          39.26 using 59 PHA bins.
# Reduced chi-squared =         0.6887 for     57 degrees of freedom
# Null hypothesis probability =   9.648602e-01

Energy  Fluence     90% Error
[keV]   [erg/cm2]   [erg/cm2]
15- 25  7.390e-09   4.740e-09
25- 50  3.990e-08   2.255e-08
50-150  1.550e-07   8.763e-08
15-150  2.023e-07   1.017e-07
Thermal bremsstrahlung (OTTB)

Spectral model: thermal bremsstrahlung
------------------------------------------------------------
Parameters  : value         Lower 90%    Upper 90%
kT [keV]    : 200.000       (-75.3413      -200)
Norm        : 9.69796       (-2.54926     2.54926)
------------------------------------------------------------
#Fit statistic : Chi-Squared =          43.14 using 59 PHA bins.
# Reduced chi-squared =         0.7568 for     57 degrees of freedom
# Null hypothesis probability =   9.127508e-01

Energy  Fluence     90% Error
[keV]   [erg/cm2]   [erg/cm2]
15- 25  2.416e-08   1.458e-08
25- 50  4.648e-08   2.792e-08
50-150  1.019e-07   6.185e-08
15-150  1.726e-07   1.014e-07
Double BB
Spectral model: bbodyrad<1> + bbodyrad<2>
------------------------------------------------------------
Parameters  : value         Lower 90%    Upper 90%
kT1 [keV]   : 1.43764        (-1.43188      2.34296)
R1^2/D10^2  : 1.83431E+04        (-18843.8      -18843.8)
kT2 [keV]   : 23.9522        (-6.64241      11.7409)
R2^2/D10^2  : 6.57690E-02    (-0.065773   0.0667862)
------------------------------------------------------------
#Fit statistic : Chi-Squared =          37.56 using 59 PHA bins.
# Reduced chi-squared =         0.6828 for     55 degrees of freedom
# Null hypothesis probability =   9.652929e-01

Energy  Fluence     90% Error
[keV]   [erg/cm2]   [erg/cm2]
15- 25  1.256e-08   4.306e-09
25- 50  3.720e-08   2.115e-08
50-150  1.590e-07   9.285e-08
15-150  2.087e-07   1.154e-07
S(25-50 keV) vs. S(50-100 keV) plot

S(25-50 keV)  = 1.69e-07
S(50-100 keV) = 2.88e-07
T90 vs. Hardness ratio plot

T90                                   = 4 sec.
Hardness ratio (energy fluence ratio) = 1.70414
Color vs. Color plot

Count Ratio  (25-50 keV) / (15-25 keV) = 1.79602
Count Ratio (50-100 keV) / (15-25 keV) = 1.9801
Mask shadow pattern

IMX = 1.09294685563, IMY = -0.444347940544
TIME vs. PHA plot around the beginning of event data (event_start to event_start+0.64s)

TIME vs. DetID plot around the beginning of event data (event_start to event_start+0.64s)

100 us light curve (15-350 keV; (event_start to event_start+0.64s)

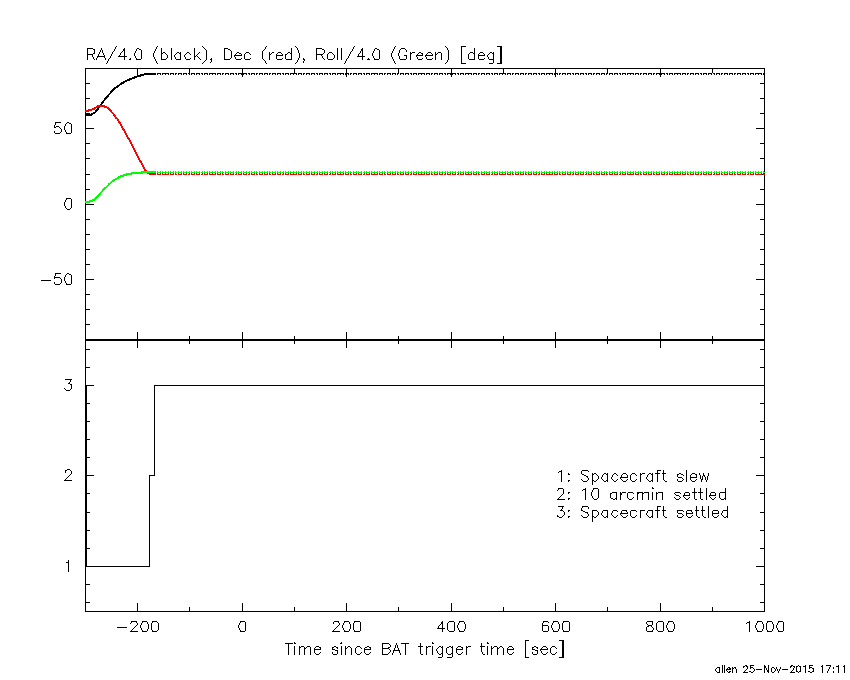
Spacecraft aspect plot
Bright source in the event data image
Event data image of 15-350 keV band
Time interval of the image:
0.000000 7.000000

# RAcent  DECcent POSerr Theta    Phi  PeakCts   SNR AngSep     Name
#  [deg]    [deg]    ['] [deg]  [deg]                   [']
299.6225  35.3364    5.6  43.3  126.5  -0.4458  -2.1    8.2	Cyg X-1
308.0168  40.7461    0.0  38.2  137.1  -0.0236  -0.2   13.1	Cyg X-3
326.0748  38.2203   13.8  25.0  146.8   0.0468   0.8    7.6	Cyg X-2
331.7690 -27.8075    1.8  49.7   22.1   1.0202   6.5 ------	UNKNOWN
350.4120  11.4804    2.9   9.6  -22.2   0.1944   3.9 ------	UNKNOWN
 36.7464  50.2869    2.2  50.1 -134.0   1.1608   5.2 ------	UNKNOWN
 30.2566  24.5413    2.8  41.2  -99.1   0.7923   4.2 ------	UNKNOWN
Webpage updated on:
Wed Nov 25 17:11:47 EST 2015