Click here for the BAT GCN circular template
Image
Pre-slew 15.0-350.0 keV image (Event data)
#   RAcent    DECcent   POSerr    Theta     Phi              Peak Cts       SNR   Name
  239.2902    78.5624   0.0157    11.9745  -112.2494         0.7717945     12.245 TRIG_00209352

Foreground time interval of the image:
 25.596  73.101 (delta_t =  47.505 [sec])
Background time interval of the image:
-199.299  25.596 (delta_t = 224.895 [sec])
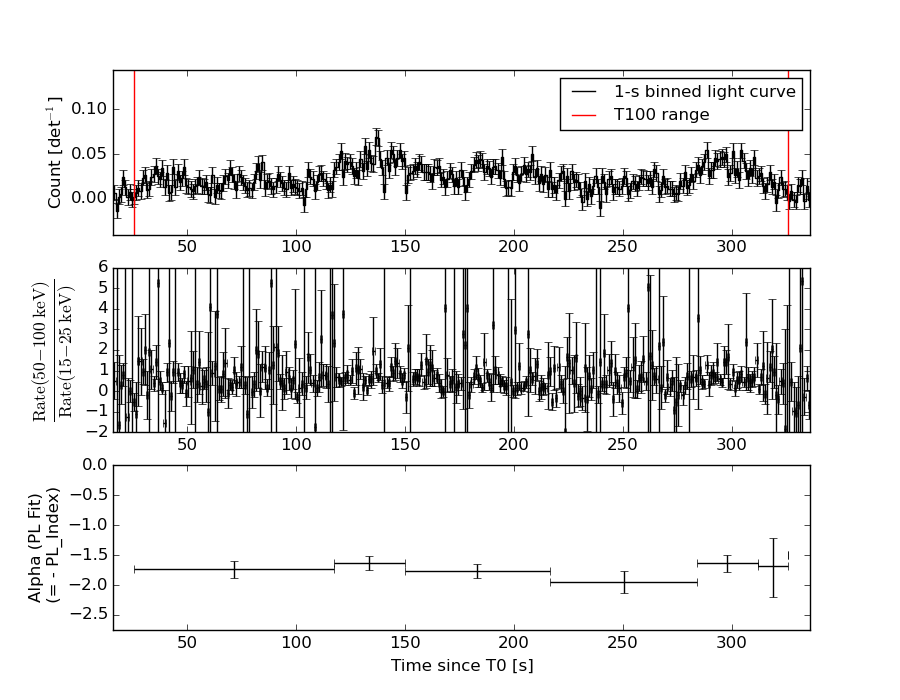
Lightcurves
Notes:
- 1) The mask-weighted light curves are using the flight position.
- 2) Multiple plots of different time binning/intervals are shown to cover all scenarios of short/long GRBs, rate/image triggers, and real/false positives.
- 3) For all the mask-weighted lightcurves, the y-axis units are counts/sec/det where a det is 0.4 x 0.4 = 0.16 sq cm.
- 4) The verticle lines correspond to following: green dotted lines are T50 interval, black dotted lines are T90 interval, blue solid line(s) is a spacecraft slew start time, and orange solid line(s) is a spacecraft slew end time.
- 5) Time of each bin is in the middle of the bin.
1 s binning
From T0-310 s to T0+310 s
From T100_start - 20 s to T100_end + 30 s
Full time interval
64 ms binning
Full time interval
From T100_start to T100_end

From T0-5 sec to T0+5 sec
16 ms binning
From T100_start-5 s to T100_start+5 s
Blue+Cyan dotted lines: Time interval of the scaled map
From 0.000000 to 64.000000
8 ms binning
From T100_start-3 s to T100_start+3 s
Blue+Cyan dotted lines: Time interval of the scaled map
From 0.000000 to 64.000000
2 ms binning
From T100_start-1 s to T100_start+1 s
Blue+Cyan dotted lines: Time interval of the scaled map
From 0.000000 to 64.000000
SN=5 or 10 sec. binning (whichever binning is satisfied first)
SN=5 or 10 sec. binning (T < 200 sec)
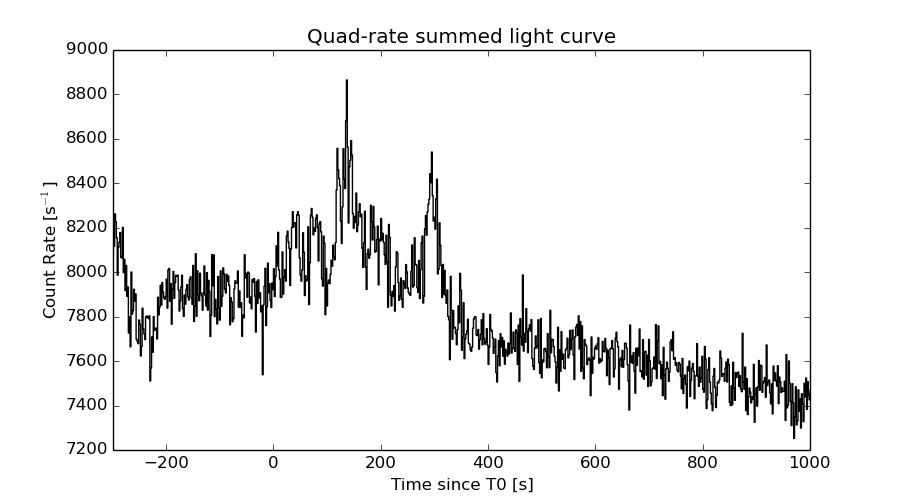
Quad-rate summed light curves (from T0-300s to T0+1000s)
Spectral Evolution
Spectra
Notes:
- 1) The fitting includes the systematic errors.
- 2) When the burst includes telescope slew time periods, the fitting uses an average response file made from multiple 5-s response files through out the slew time plus single time preiod for the non-slew times, and weighted by the total counts in the corresponding time period using addrmf. An average response file is needed becuase a spectral fit using the pre-slew DRM will introduce some errors in both a spectral shape and a normalization if the PHA file contains a lot of the slew/post-slew time interval.
- 3) For fits to more complicated models (e.g. a power-law over a cutoff power-law), the BAT team has decided to require a chi-square improvement of more than 6 for each extra dof.
Time averaged spectrum fit using the average DRM
Power-law model
Time interval is from   25.596 sec. to  326.044 sec.

Spectral model in power-law:
------------------------------------------------------------
Parameters  : value       lower 90%   higher 90%
Photon index: 1.76511     ( -0.0739237   0.0746321 )
Norm@50keV  : 1.43726E-03    ( -5.74111e-05   5.71452e-05 )
------------------------------------------------------------
#Fit statistic : Chi-Squared =          44.42 using 59 PHA bins.
# Reduced chi-squared =         0.7794 for     57 degrees of freedom
# Null hypothesis probability =   8.876127e-01

Photon flux (15-150 keV)    in 300.4 sec: 0.195436 ( -0.00769557  0.00771617 ) ph/cm2/s
Energy fluence (15-150 keV)             : 3.98072e-06 ( -1.64218e-07  1.65057e-07 ) ergs/cm2
Cutoff power-law model
Time interval is from   25.596 sec. to  326.044 sec.
Spectral model in the cutoff power-law:
------------------------------------------------------------
Parameters  : value       lower 90%   higher 90%
Photon index: 1.58937     ( -0.300067   0.230291 )
Epeak [keV] : 113.805      ( -43.8101 -113.805 )
Norm@50keV  : 1.76422E-03    ( -0.000369258   0.000718933 )
------------------------------------------------------------
#Fit statistic : Chi-Squared =          43.31 using 59 PHA bins.
# Reduced chi-squared =         0.7733 for     56 degrees of freedom
# Null hypothesis probability =   8.925280e-01

Photon flux (15-150 keV)    in 300.4 sec: 0.192866 ( -0.008648  0.008666 ) ph/cm2/s
Energy fluence (15-150 keV)             : 3.91382e-06 ( -1.97032e-07  9.86514e-08 ) ergs/cm2
Band function
Time interval is from   25.596 sec. to  326.044 sec.

Spectral model in the Band function:
------------------------------------------------------------
Parameters  : value       lower 90%   higher 90%
alpha       : -1.58937   ( 1.60693   1.60693 )
beta        : -8.87592    ( 9.2282   19.2282 )
Epeak [keV] : 113.785      ( -34.8043 -113.785 )
Norm@50keV   : 1.76388E-03    ( -0.000373328   0.000237391 )
------------------------------------------------------------
#Fit statistic : Chi-Squared =          43.31 using 59 PHA bins.
# Reduced chi-squared =         0.7874 for     55 degrees of freedom
# Null hypothesis probability =   8.730031e-01

Photon flux (15-150 keV)    in 300.4 sec: 0.192849 (    ) ph/cm2/s
Energy fluence (15-150 keV)             : 0 ( 0  0 ) ergs/cm2
Single BB
Spectral model blackbody:
------------------------------------------------------------
Parameters  : value    Lower 90%  Upper 90%
kT [keV]    : 13.0979  (  )
R^2/D10^2   : 3.22724E-02  (   )
(R is the radius in km and D10 is the distance to the source in units of 10 kpc)
------------------------------------------------------------
#Fit statistic : Chi-Squared =         198.66 using 59 PHA bins.
# Reduced chi-squared =         3.4853 for     57 degrees of freedom
# Null hypothesis probability =   1.447837e-17

Energy  Fluence     90% Error
[keV]   [erg/cm2]   [erg/cm2]
15- 25  3.527e-07   2.704e-08
25- 50  1.225e-06   5.512e-08
50-150  1.334e-06   1.044e-07
15-150  2.911e-06   1.250e-07
Thermal bremsstrahlung (OTTB)
Spectral model: thermal bremsstrahlung
------------------------------------------------------------
Parameters  : value         Lower 90%    Upper 90%
kT [keV]    : 125.455       (-23.5129      23.004)
Norm        : 0.799749       (-0.0383461     0.0546715)
------------------------------------------------------------
#Fit statistic : Chi-Squared =          46.59 using 59 PHA bins.
# Reduced chi-squared =         0.8174 for     57 degrees of freedom
# Null hypothesis probability =   8.359900e-01

Energy  Fluence     90% Error
[keV]   [erg/cm2]   [erg/cm2]
15- 25  6.245e-07   4.251e-08
25- 50  1.126e-06   7.134e-08
50-150  2.053e-06   5.428e-07
15-150  3.803e-06   5.542e-07
Double BB
Spectral model: bbodyrad<1> + bbodyrad<2>
------------------------------------------------------------
Parameters  : value         Lower 90%    Upper 90%
kT1 [keV]   : 5.65297        (-0.833897      0.999753)
R1^2/D10^2  : 0.475892        (-0.21356      0.433198)
kT2 [keV]   : 20.8463        (-2.32546      3.33563)
R2^2/D10^2  : 4.80680E-03    (-0.00209078   0.00283032)
------------------------------------------------------------
#Fit statistic : Chi-Squared =          51.55 using 59 PHA bins.
# Reduced chi-squared =         0.9373 for     55 degrees of freedom
# Null hypothesis probability =   6.071116e-01

Energy  Fluence     90% Error
[keV]   [erg/cm2]   [erg/cm2]
15- 25  6.733e-07   9.883e-08
25- 50  1.093e-06   8.757e-08
50-150  2.004e-06   2.196e-07
15-150  3.770e-06   3.184e-07
Peak spectrum fit
Power-law model

Time interval is from  136.384 sec. to  137.384 sec.

Spectral model in power-law:
------------------------------------------------------------
Parameters  : value       lower 90%   higher 90%
Photon index: 1.39765     ( -0.356376   0.356926 )
Norm@50keV  : 4.66886E-03    ( -0.000938389   0.000924567 )
------------------------------------------------------------
#Fit statistic : Chi-Squared =          56.48 using 59 PHA bins.
# Reduced chi-squared =         0.9908 for     57 degrees of freedom
# Null hypothesis probability =   4.946538e-01

Photon flux (15-150 keV)    in 1 sec: 0.568278 ( -0.110662  0.110844 ) ph/cm2/s
Energy fluence (15-150 keV)             : 4.51351e-08 ( -1.01501e-08  1.03755e-08 ) ergs/cm2
Cutoff power-law model
Time interval is from  136.384 sec. to  137.384 sec.
Spectral model in the cutoff power-law:
------------------------------------------------------------
Parameters  : value       lower 90%   higher 90%
Photon index: 1.39630     ( -0.874514   0.3582 )
Epeak [keV] : 9999.26      ( -9999.35 -9999.35 )
Norm@50keV  : 4.68405E-03    ( -0.000942663   0.00641049 )
------------------------------------------------------------
#Fit statistic : Chi-Squared =          56.48 using 59 PHA bins.
# Reduced chi-squared =          1.009 for     56 degrees of freedom
# Null hypothesis probability =   4.568069e-01

Photon flux (15-150 keV)    in 1 sec: 0.568991 ( -0.111275  0.110035 ) ph/cm2/s
Energy fluence (15-150 keV)             : 4.51756e-08 ( -1.02117e-08  1.00825e-08 ) ergs/cm2
Band function
Time interval is from  136.384 sec. to  137.384 sec.

Spectral model in the Band function:
------------------------------------------------------------
Parameters  : value       lower 90%   higher 90%
alpha       : 4.94761   ( -4.94761   -4.94761 )
beta        : -1.49199    ( -0.454926   0.402815 )
Epeak [keV] : 24.7511      ( -24.7511 71.4866 )
Norm@50keV   : 449.144    ( -86.3854   2.65813e+06 )
------------------------------------------------------------
#Fit statistic : Chi-Squared =          56.18 using 59 PHA bins.
# Reduced chi-squared =          1.021 for     55 degrees of freedom
# Null hypothesis probability =   4.306278e-01

Photon flux (15-150 keV)    in 1 sec:  (    ) ph/cm2/s
Energy fluence (15-150 keV)             : 0 ( 0  0 ) ergs/cm2
Single BB
Spectral model blackbody:
------------------------------------------------------------
Parameters  : value    Lower 90%  Upper 90%
kT [keV]    : 15.5514  (-4.21935  6.15851)
R^2/D10^2   : 5.57242E-02  (-0.0370639   0.108732)
(R is the radius in km and D10 is the distance to the source in units of 10 kpc)
------------------------------------------------------------
#Fit statistic : Chi-Squared =          67.23 using 59 PHA bins.
# Reduced chi-squared =          1.179 for     57 degrees of freedom
# Null hypothesis probability =   1.666408e-01

Energy  Fluence     90% Error
[keV]   [erg/cm2]   [erg/cm2]
15- 25  2.803e-09   1.185e-09
25- 50  1.151e-08   3.804e-09
50-150  1.923e-08   8.334e-09
15-150  3.355e-08   1.125e-08
Thermal bremsstrahlung (OTTB)
Spectral model: thermal bremsstrahlung
------------------------------------------------------------
Parameters  : value         Lower 90%    Upper 90%
kT [keV]    : 199.363       (-95.7745      -199.363)
Norm        : 2.32189       (-0.45093     0.45093)
------------------------------------------------------------
#Fit statistic : Chi-Squared =          57.55 using 59 PHA bins.
# Reduced chi-squared =          1.010 for     57 degrees of freedom
# Null hypothesis probability =   4.545239e-01

Energy  Fluence     90% Error
[keV]   [erg/cm2]   [erg/cm2]
15- 25  5.782e-09   3.391e-09
25- 50  1.112e-08   6.310e-09
50-150  2.439e-08   1.383e-08
15-150  4.130e-08   2.382e-08
Double BB
Spectral model: bbodyrad<1> + bbodyrad<2>
------------------------------------------------------------
Parameters  : value         Lower 90%    Upper 90%
kT1 [keV]   : 6.25880        (-2.39763      4.87716)
R1^2/D10^2  : 0.977704        (-0.835329      5.39038)
kT2 [keV]   : 33.6231        (-14.7418      -33.7714)
R2^2/D10^2  : 3.78294E-03    (-0.00341801   0.0156023)
------------------------------------------------------------
#Fit statistic : Chi-Squared =          56.08 using 59 PHA bins.
# Reduced chi-squared =          1.020 for     55 degrees of freedom
# Null hypothesis probability =   4.342184e-01

Energy  Fluence     90% Error
[keV]   [erg/cm2]   [erg/cm2]
15- 25  6.016e-09   3.454e-09
25- 50  9.899e-09   5.375e-09
50-150  3.100e-08   1.838e-08
15-150  4.691e-08   2.430e-08
Pre-slew spectrum (Pre-slew PHA with pre-slew DRM)
Power-law model
Spectral model in power-law:
------------------------------------------------------------
Parameters  : value       lower 90%   higher 90%
Photon index: 1.72030     ( -0.196296   0.20351 )
Norm@50keV  : 1.11067E-03    ( -0.00013928   0.000136179 )
------------------------------------------------------------
#Fit statistic : Chi-Squared =          55.03 using 59 PHA bins.
# Reduced chi-squared =         0.9655 for     57 degrees of freedom
# Null hypothesis probability =   5.492884e-01

Photon flux (15-150 keV)    in 47.5 sec: 0.148571 ( -0.015788  0.0157911 ) ph/cm2/s
Energy fluence (15-150 keV)             : 4.87725e-07 ( -6.34315e-08  6.48261e-08 ) ergs/cm2
Cutoff power-law model

Spectral model in the cutoff power-law:
------------------------------------------------------------
Parameters  : value       lower 90%   higher 90%
Photon index: 1.59810     ( -0.803909   0.683229 )
Epeak [keV] : 146.063      ( -126.896 -147.283 )
Norm@50keV  : 1.29857E-03    ( -0.000626154   0.00227775 )
------------------------------------------------------------
#Fit statistic : Chi-Squared =          54.95 using 59 PHA bins.
# Reduced chi-squared =         0.9812 for     56 degrees of freedom
# Null hypothesis probability =   5.147382e-01

Photon flux (15-150 keV)    in 47.5 sec: 0.147762 ( -0.016435  0.016108 ) ph/cm2/s
Energy fluence (15-150 keV)             : 4.8127e-07 ( -7.39186e-08  6.99532e-08 ) ergs/cm2
Band function
Spectral model in the Band function:
------------------------------------------------------------
Parameters  : value       lower 90%   higher 90%
alpha       : 0.223786   ( 1.1991   1.1991 )
beta        : -1.77187    ( 1.75797   0.22648 )
Epeak [keV] : 27.0781      ( -27.5799 234.399 )
Norm@50keV   : 3.45399E-02    ( -0.0359592   114.193 )
------------------------------------------------------------
#Fit statistic : Chi-Squared =          54.67 using 59 PHA bins.
# Reduced chi-squared =         0.9940 for     55 degrees of freedom
# Null hypothesis probability =   4.871913e-01

Photon flux (15-150 keV)    in 47.5 sec: 0.148019 ( 6.85198  -0.016173 ) ph/cm2/s
Energy fluence (15-150 keV)             : 0 ( 0  0 ) ergs/cm2
S(25-50 keV) vs. S(50-100 keV) plot
S(25-50 keV)  = 1.11e-06
S(50-100 keV) = 1.30e-06
T90 vs. Hardness ratio plot
T90                                   = 262.936000019312 sec.
Hardness ratio (energy fluence ratio) = 1.17117
Color vs. Color plot
Count Ratio  (25-50 keV) / (15-25 keV) = 1.0662
Count Ratio (50-100 keV) / (15-25 keV) = 0.692319
Mask shadow pattern
IMX = -8.030628526871948E-02, IMY = 1.963009154542183E-01
TIME vs. PHA plot around the trigger time
Blue+Cyan dotted lines: Time interval of the scaled map
From 0.000000 to 64.000000
TIME vs. DetID plot around the trigger time
Blue+Cyan dotted lines: Time interval of the scaled map
From 0.000000 to 64.000000
100 us light curve (15-350 keV)
Blue+Cyan dotted lines: Time interval of the scaled map
From 0.000000 to 64.000000
Spacecraft aspect plot
Bright source in the pre-burst/pre-slew/post-slew images
Pre-burst image of 15-350 keV band
Time interval of the image:
-199.299410 25.596000

# RAcent  DECcent POSerr Theta    Phi  PeakCts   SNR AngSep     Name
#  [deg]    [deg]    ['] [deg]  [deg]                   [']
254.2808  35.3784    3.7  32.2   48.6   0.7494   3.2    8.9	Her X-1
299.5858  35.2031    0.5  45.7   -7.7   6.4363  21.6    0.2	Cyg X-1
308.0795  40.9187    2.1  44.1  -19.9   1.4588   5.5    2.5	Cyg X-3
326.1214  38.1813    9.0  53.6  -34.0   1.0010   1.3    8.8	Cyg X-2
216.8129  29.2435    2.4  40.1  102.9   2.7577   4.8 ------	UNKNOWN
252.3754  28.4802    2.4  38.8   53.2   1.8418   4.9 ------	UNKNOWN
178.5828  72.7529    2.4  21.4 -156.7   0.6991   4.9 ------	UNKNOWN
315.8284  33.6289    3.0  53.5  -22.2   1.7292   3.9 ------	UNKNOWN
115.8825  60.5039    3.0  46.6 -144.3   1.3764   3.8 ------	UNKNOWN
Pre-slew background subtracted image of 15-350 keV band
Time interval of the image:
25.596000 73.100620

# RAcent  DECcent POSerr Theta    Phi  PeakCts   SNR AngSep     Name
#  [deg]    [deg]    ['] [deg]  [deg]                   [']
254.4735  35.1967    5.0  32.4   48.4   0.2374   2.3    8.8	Her X-1
299.5810  35.2140   10.4  45.7   -7.7  -0.1412  -1.1    0.9	Cyg X-1
308.0401  40.9526   55.7  44.1  -19.9   0.0239   0.2    3.2	Cyg X-3
326.0545  38.1742    6.1  53.6  -33.9  -0.5539  -1.9   10.4	Cyg X-2
239.2903  78.5625    0.9  12.0 -112.2   0.7719  12.2 ------	UNKNOWN
Post-slew image of 15-350 keV band
Time interval of the image:
107.900600 423.014200
541.000000 603.110000
721.000000 783.054100
901.000000 963.060000

# RAcent  DECcent POSerr Theta    Phi  PeakCts   SNR AngSep     Name
#  [deg]    [deg]    ['] [deg]  [deg]                   [']
299.5940  35.1957    0.6  49.8   10.0  14.4017  20.3    0.4	Cyg X-1
308.0333  40.9324    2.0  45.9   -0.6   3.1298   5.6    3.7	Cyg X-3
326.0900  38.3743    4.6  51.9  -17.5   1.5895   2.5    5.0	Cyg X-2
239.1455  78.5647    0.5   0.0 -104.0   6.0762  22.3 ------	UNKNOWN
310.7113  31.5886    3.0  55.5   -0.3   4.2824   3.9 ------	UNKNOWN
130.7035  35.2123    2.8  59.1 -166.1   8.3834   4.0 ------	UNKNOWN
340.6187  52.7177    2.5  40.9  -36.5   1.9322   4.6 ------	UNKNOWN
Plot creation:
Sun May 31 13:17:44 EDT 2015