Special notes of this burst
Image
Pre-slew 15.0-350.0 keV image (Event data)
#   RAcent    DECcent   POSerr    Theta     Phi              Peak Cts       SNR   Name
  127.2653    73.5641   0.0119    36.3046  -125.6238         2.0453202     16.125 TRIG_00210084

Foreground time interval of the image:
  0.220  57.504 (delta_t =  57.284 [sec])
Background time interval of the image:
-239.112   0.220 (delta_t = 239.332 [sec])
Lightcurves
Notes:
- 1) The mask-weighted light curves are using the flight position.
- 2) Multiple plots of different time binning/intervals are shown to cover all scenarios of short/long GRBs, rate/image triggers, and real/false positives.
- 3) For all the mask-weighted lightcurves, the y-axis units are counts/sec/det where a det is 0.4 x 0.4 = 0.16 sq cm.
- 4) The verticle lines correspond to following: green dotted lines are T50 interval, black dotted lines are T90 interval, blue solid line(s) is a spacecraft slew start time, and orange solid line(s) is a spacecraft slew end time.
- 5) Time of each bin is in the middle of the bin.
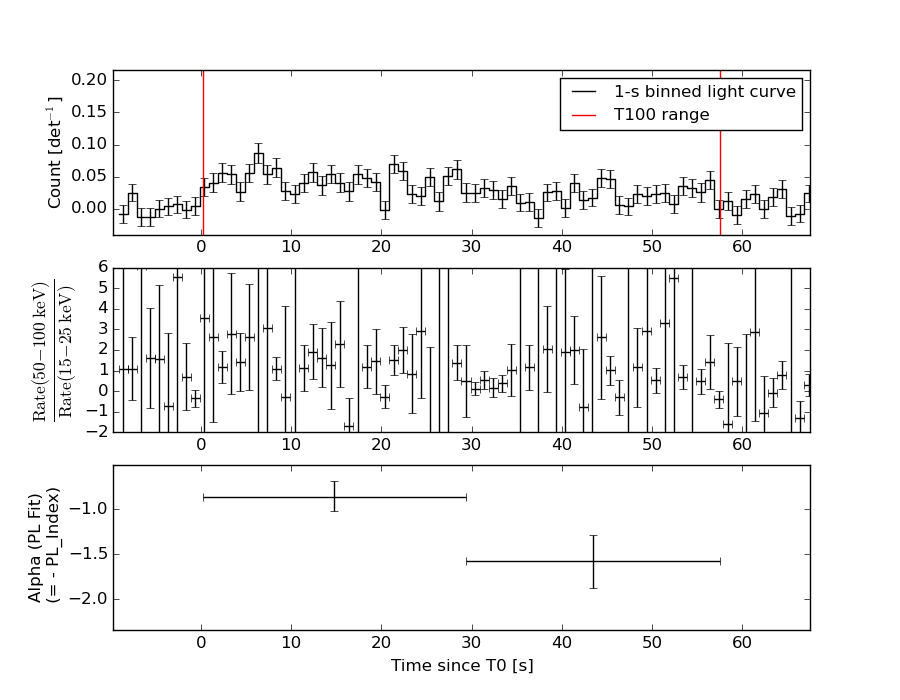
1 s binning
From T0-310 s to T0+310 s
From T100_start - 20 s to T100_end + 30 s
Full time interval
64 ms binning
Full time interval
From T100_start to T100_end
From T0-5 sec to T0+5 sec
16 ms binning
From T100_start-5 s to T100_start+5 s
Blue+Cyan dotted lines: Time interval of the scaled map
From 0.000000 to 8.192000
8 ms binning
From T100_start-3 s to T100_start+3 s
Blue+Cyan dotted lines: Time interval of the scaled map
From 0.000000 to 8.192000
2 ms binning
From T100_start-1 s to T100_start+1 s
Blue+Cyan dotted lines: Time interval of the scaled map
From 0.000000 to 8.192000
SN=5 or 10 sec. binning (whichever binning is satisfied first)
SN=5 or 10 sec. binning (T < 200 sec)
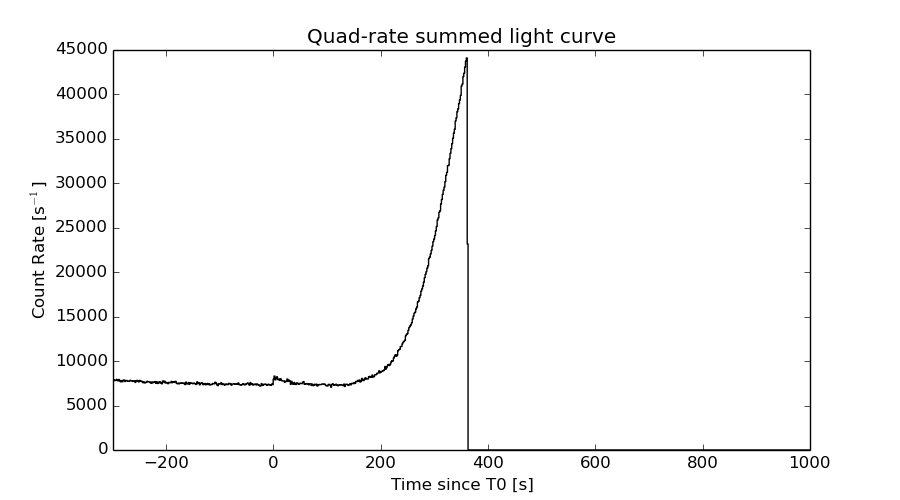
Quad-rate summed light curves (from T0-300s to T0+1000s)
Spectral Evolution
Spectra
Notes:
- 1) The fitting includes the systematic errors.
- 2) When the burst includes telescope slew time periods, the fitting uses an average response file made from multiple 5-s response files through out the slew time plus single time preiod for the non-slew times, and weighted by the total counts in the corresponding time period using addrmf. An average response file is needed becuase a spectral fit using the pre-slew DRM will introduce some errors in both a spectral shape and a normalization if the PHA file contains a lot of the slew/post-slew time interval.
- 3) For fits to more complicated models (e.g. a power-law over a cutoff power-law), the BAT team has decided to require a chi-square improvement of more than 6 for each extra dof.
Time averaged spectrum fit using the average DRM
Power-law model

Time interval is from    0.220 sec. to   57.504 sec.

Spectral model in power-law:
------------------------------------------------------------
Parameters  : value       lower 90%   higher 90%
Photon index: 1.11417     ( -0.152933   0.149131 )
Norm@50keV  : 2.41130E-03    ( -0.000212534   0.000211754 )
------------------------------------------------------------
#Fit statistic : Chi-Squared =          66.52 using 59 PHA bins.
# Reduced chi-squared =          1.167 for     57 degrees of freedom
# Null hypothesis probability =   1.820281e-01

Photon flux (15-150 keV)    in 57.28 sec: 0.280090 ( -0.0258233  0.0259406 ) ph/cm2/s
Energy fluence (15-150 keV)             : 1.43761e-06 ( -1.30322e-07  1.30706e-07 ) ergs/cm2
Cutoff power-law model

Time interval is from    0.220 sec. to   57.504 sec.
Spectral model in the cutoff power-law:
------------------------------------------------------------
Parameters  : value       lower 90%   higher 90%
Photon index: 0.443164     ( -0.758654   0.63522 )
Epeak [keV] : 137.634      ( -43.0298 854.426 )
Norm@50keV  : 4.66700E-03    ( -0.00213419   0.0047051 )
------------------------------------------------------------
#Fit statistic : Chi-Squared =          63.25 using 59 PHA bins.
# Reduced chi-squared =          1.129 for     56 degrees of freedom
# Null hypothesis probability =   2.357384e-01

Photon flux (15-150 keV)    in 57.28 sec: 0.270779 ( -0.027469  0.027408 ) ph/cm2/s
Energy fluence (15-150 keV)             : 1.40148e-06 ( -1.37289e-07  1.36704e-07 ) ergs/cm2
Band function

Time interval is from    0.220 sec. to   57.504 sec.

Spectral model in the Band function:
------------------------------------------------------------
Parameters  : value       lower 90%   higher 90%
alpha       : -0.443237   ( -0.516039   0.924735 )
beta        : -10.0000    ( 10   20 )
Epeak [keV] : 137.616      ( -36.4677 202.65 )
Norm@50keV   : 4.66690E-03    ( -0.0021331   0.00472027 )
------------------------------------------------------------
#Fit statistic : Chi-Squared =          63.25 using 59 PHA bins.
# Reduced chi-squared =          1.150 for     55 degrees of freedom
# Null hypothesis probability =   2.079929e-01

Photon flux (15-150 keV)    in 57.28 sec:  (    ) ph/cm2/s
Energy fluence (15-150 keV)             : 0 ( 0  0 ) ergs/cm2
Single BB
Spectral model blackbody:
------------------------------------------------------------
Parameters  : value    Lower 90%  Upper 90%
kT [keV]    : 21.7755  (-2.1874  2.56019)
R^2/D10^2   : 1.01482E-02  (-0.00309482   0.00425255)
(R is the radius in km and D10 is the distance to the source in units of 10 kpc)
------------------------------------------------------------
#Fit statistic : Chi-Squared =          74.96 using 59 PHA bins.
# Reduced chi-squared =          1.315 for     57 degrees of freedom
# Null hypothesis probability =   5.560362e-02

Energy  Fluence     90% Error
[keV]   [erg/cm2]   [erg/cm2]
15- 25  5.125e-08   9.162e-09
25- 50  2.693e-07   3.623e-08
50-150  9.539e-07   1.292e-07
15-150  1.275e-06   1.452e-07
Thermal bremsstrahlung (OTTB)
Spectral model: thermal bremsstrahlung
------------------------------------------------------------
Parameters  : value         Lower 90%    Upper 90%
kT [keV]    : 200.000       (      )
Norm        : 1.19082       (-0.105953     0.105929)
------------------------------------------------------------
#Fit statistic : Chi-Squared =          89.84 using 59 PHA bins.
# Reduced chi-squared =          1.576 for     57 degrees of freedom
# Null hypothesis probability =   3.595996e-03

Energy  Fluence     90% Error
[keV]   [erg/cm2]   [erg/cm2]
15- 25  1.699e-07   2.177e-08
25- 50  3.269e-07   1.284e-07
50-150  7.169e-07   3.116e-07
15-150  1.214e-06   3.884e-07
Double BB
Spectral model: bbodyrad<1> + bbodyrad<2>
------------------------------------------------------------
Parameters  : value         Lower 90%    Upper 90%
kT1 [keV]   : 5.06309        (-1.84748      2.99586)
R1^2/D10^2  : 0.565612        (-0.470031      4.04118)
kT2 [keV]   : 25.3089        (-3.29882      4.97183)
R2^2/D10^2  : 5.84020E-03    (-0.00269731   0.00218414)
------------------------------------------------------------
#Fit statistic : Chi-Squared =          60.09 using 59 PHA bins.
# Reduced chi-squared =          1.093 for     55 degrees of freedom
# Null hypothesis probability =   2.965896e-01

Energy  Fluence     90% Error
[keV]   [erg/cm2]   [erg/cm2]
15- 25  1.198e-07   5.383e-08
25- 50  2.669e-07   7.031e-08
50-150  1.003e-06   2.065e-07
15-150  1.390e-06   2.566e-07
Peak spectrum fit
Power-law model
Time interval is from    5.584 sec. to    6.584 sec.

Spectral model in power-law:
------------------------------------------------------------
Parameters  : value       lower 90%   higher 90%
Photon index: 0.712326     ( -0.430426   0.378625 )
Norm@50keV  : 7.14601E-03    ( -0.00184707   0.00176648 )
------------------------------------------------------------
#Fit statistic : Chi-Squared =          52.66 using 59 PHA bins.
# Reduced chi-squared =         0.9239 for     57 degrees of freedom
# Null hypothesis probability =   6.383156e-01

Photon flux (15-150 keV)    in 1 sec: 0.825217 ( -0.194705  0.197769 ) ph/cm2/s
Energy fluence (15-150 keV)             : 8.67453e-08 ( -1.92548e-08  1.93076e-08 ) ergs/cm2
Cutoff power-law model
Time interval is from    5.584 sec. to    6.584 sec.
Spectral model in the cutoff power-law:
------------------------------------------------------------
Parameters  : value       lower 90%   higher 90%
Photon index: -4.88615E-02     ( -2.78815   1.4117 )
Epeak [keV] : 178.810      ( -178.808 -178.808 )
Norm@50keV  : 1.37837E-02    ( -0.00812493   0.0738346 )
------------------------------------------------------------
#Fit statistic : Chi-Squared =          52.02 using 59 PHA bins.
# Reduced chi-squared =         0.9290 for     56 degrees of freedom
# Null hypothesis probability =   6.261294e-01

Photon flux (15-150 keV)    in 1 sec: 0.801483 ( -0.202604  0.204017 ) ph/cm2/s
Energy fluence (15-150 keV)             : 8.58487e-08 ( -1.9822e-08  1.96523e-08 ) ergs/cm2
Band function

Time interval is from    5.584 sec. to    6.584 sec.

Spectral model in the Band function:
------------------------------------------------------------
Parameters  : value       lower 90%   higher 90%
alpha       : -0.697318   ( 0.706572   0.706572 )
beta        : -0.728038    ( -0.378616   0.43021 )
Epeak [keV] : 1.00000E+04      ( -10000 -10000 )
Norm@50keV   : 7.19397E-03    (     )
------------------------------------------------------------
#Fit statistic : Chi-Squared =          52.65 using 59 PHA bins.
# Reduced chi-squared =         0.9573 for     55 degrees of freedom
# Null hypothesis probability =   5.649636e-01

Photon flux (15-150 keV)    in 1 sec:  (    ) ph/cm2/s
Energy fluence (15-150 keV)             : 0 ( 0  0 ) ergs/cm2
Single BB
Spectral model blackbody:
------------------------------------------------------------
Parameters  : value    Lower 90%  Upper 90%
kT [keV]    : 29.5087  (-7.1436  12.275)
R^2/D10^2   : 1.34447E-02  (-0.00841675   0.0175709)
(R is the radius in km and D10 is the distance to the source in units of 10 kpc)
------------------------------------------------------------
#Fit statistic : Chi-Squared =          52.77 using 59 PHA bins.
# Reduced chi-squared =         0.9257 for     57 degrees of freedom
# Null hypothesis probability =   6.345228e-01

Energy  Fluence     90% Error
[keV]   [erg/cm2]   [erg/cm2]
15- 25  1.850e-09   9.509e-10
25- 50  1.134e-08   5.035e-09
50-150  7.016e-08   3.369e-08
15-150  8.334e-08   3.674e-08
Thermal bremsstrahlung (OTTB)
Spectral model: thermal bremsstrahlung
------------------------------------------------------------
Parameters  : value         Lower 90%    Upper 90%
kT [keV]    : 200.000       (      )
Norm        : 3.38268       (-0.834717     0.834591)
------------------------------------------------------------
#Fit statistic : Chi-Squared =          65.66 using 59 PHA bins.
# Reduced chi-squared =          1.152 for     57 degrees of freedom
# Null hypothesis probability =   2.018876e-01

Energy  Fluence     90% Error
[keV]   [erg/cm2]   [erg/cm2]
15- 25  8.431e-09   5.140e-09
25- 50  1.622e-08   9.960e-09
50-150  3.557e-08   2.091e-08
15-150  6.022e-08   3.617e-08
Double BB
Spectral model: bbodyrad<1> + bbodyrad<2>
------------------------------------------------------------
Parameters  : value         Lower 90%    Upper 90%
kT1 [keV]   : 7.19136        (-7.21516      -7.21516)
R1^2/D10^2  : 0.361619        (-0.347749      -0.347749)
kT2 [keV]   : 34.8007        (-10.5806      -35.0173)
R2^2/D10^2  : 7.76144E-03    (-0.00761556   0.0154362)
------------------------------------------------------------
#Fit statistic : Chi-Squared =          50.92 using 59 PHA bins.
# Reduced chi-squared =         0.9259 for     55 degrees of freedom
# Null hypothesis probability =   6.310180e-01

Energy  Fluence     90% Error
[keV]   [erg/cm2]   [erg/cm2]
15- 25  4.423e-09   2.677e-09
25- 50  1.317e-08   6.990e-09
50-150  7.016e-08   4.186e-08
15-150  8.775e-08   4.711e-08
Pre-slew spectrum (Pre-slew PHA with pre-slew DRM)
Power-law model
Spectral model in power-law:
------------------------------------------------------------
Parameters  : value       lower 90%   higher 90%
Photon index: 1.11417     ( -0.152933   0.149131 )
Norm@50keV  : 2.41130E-03    ( -0.000212534   0.000211754 )
------------------------------------------------------------
#Fit statistic : Chi-Squared =          66.52 using 59 PHA bins.
# Reduced chi-squared =          1.167 for     57 degrees of freedom
# Null hypothesis probability =   1.820281e-01

Photon flux (15-150 keV)    in 57.28 sec: 0.280090 ( -0.0258233  0.0259406 ) ph/cm2/s
Energy fluence (15-150 keV)             : 1.43761e-06 ( -1.30322e-07  1.30706e-07 ) ergs/cm2
Cutoff power-law model
Spectral model in the cutoff power-law:
------------------------------------------------------------
Parameters  : value       lower 90%   higher 90%
Photon index: 0.443164     ( -0.758654   0.63522 )
Epeak [keV] : 137.634      ( -43.0298 854.426 )
Norm@50keV  : 4.66700E-03    ( -0.00213419   0.0047051 )
------------------------------------------------------------
#Fit statistic : Chi-Squared =          63.25 using 59 PHA bins.
# Reduced chi-squared =          1.129 for     56 degrees of freedom
# Null hypothesis probability =   2.357384e-01

Photon flux (15-150 keV)    in 57.28 sec: 0.270779 ( -0.027469  0.027408 ) ph/cm2/s
Energy fluence (15-150 keV)             : 1.40148e-06 ( -1.37289e-07  1.36704e-07 ) ergs/cm2
Band function

Spectral model in the Band function:
------------------------------------------------------------
Parameters  : value       lower 90%   higher 90%
alpha       : -0.443237   ( -0.516039   0.924735 )
beta        : -10.0000    ( 10   8.88178e-15 )
Epeak [keV] : 137.616      ( -36.4677 202.649 )
Norm@50keV   : 4.66690E-03    ( -0.0021331   0.00472027 )
------------------------------------------------------------
#Fit statistic : Chi-Squared =          63.25 using 59 PHA bins.
# Reduced chi-squared =          1.150 for     55 degrees of freedom
# Null hypothesis probability =   2.079929e-01

Photon flux (15-150 keV)    in 57.28 sec:  (    ) ph/cm2/s
Energy fluence (15-150 keV)             : 0 ( 0  0 ) ergs/cm2
S(25-50 keV) vs. S(50-100 keV) plot
S(25-50 keV)  = 2.87e-07
S(50-100 keV) = 5.29e-07
T90 vs. Hardness ratio plot
T90                                   = 52.3720000088215 sec.
Hardness ratio (energy fluence ratio) = 1.84321
Color vs. Color plot
Count Ratio  (25-50 keV) / (15-25 keV) = 1.62177
Count Ratio (50-100 keV) / (15-25 keV) = 1.98015
Mask shadow pattern
IMX = -4.279320086049428E-01, IMY = 5.972037963287603E-01
TIME vs. PHA plot around the trigger time
Blue+Cyan dotted lines: Time interval of the scaled map
From 0.000000 to 8.192000
TIME vs. DetID plot around the trigger time
Blue+Cyan dotted lines: Time interval of the scaled map
From 0.000000 to 8.192000
100 us light curve (15-350 keV)
Blue+Cyan dotted lines: Time interval of the scaled map
From 0.000000 to 8.192000
Spacecraft aspect plot
Bright source in the pre-burst/pre-slew/post-slew images
Pre-burst image of 15-350 keV band
Time interval of the image:
-239.112000 0.220000

# RAcent  DECcent POSerr Theta    Phi  PeakCts   SNR AngSep     Name
#  [deg]    [deg]    ['] [deg]  [deg]                   [']
254.5286  35.2978   11.0  29.3   48.3   0.2338   1.0    4.4	Her X-1
299.6018  35.1962    0.5  47.5   -5.2   8.5324  24.4    0.7	Cyg X-1
308.0393  40.9207    3.1  46.8  -17.1   1.1591   3.7    3.7	Cyg X-3
326.2094  38.3627    6.6  57.1  -29.6  -1.9347  -1.8    3.0	Cyg X-2
133.0944  47.7006    3.9  54.1 -152.9   1.8158   3.0 ------	UNKNOWN
Pre-slew background subtracted image of 15-350 keV band
Time interval of the image:
0.220000 57.504000

# RAcent  DECcent POSerr Theta    Phi  PeakCts   SNR AngSep     Name
#  [deg]    [deg]    ['] [deg]  [deg]                   [']
254.5481  35.3402    7.3  29.3   48.2   0.1567   1.6    4.4	Her X-1
299.7215  35.2158   12.1  47.5   -5.3  -0.1406  -1.0    6.5	Cyg X-1
308.2451  40.9636    4.1  46.9  -17.3   0.3953   2.8    6.1	Cyg X-3
326.2824  38.2401    4.1  57.2  -29.6   1.3377   2.8    7.2	Cyg X-2
127.2652  73.5641    0.7  36.3 -125.6   2.0454  16.1 ------	UNKNOWN
Post-slew image of 15-350 keV band
Time interval of the image:
178.788600 423.038000

# RAcent  DECcent POSerr Theta    Phi  PeakCts   SNR AngSep     Name
#  [deg]    [deg]    ['] [deg]  [deg]                   [']
254.6882  35.4077    0.0  23.5  105.5   0.0636   1.2   11.9	Her X-1
288.8539  10.8118    4.3  39.9   30.7   0.2216   2.7    8.7	GRS 1915+105
299.6327  35.2187    0.6  20.5   -7.1   0.8192  19.3    2.3	Cyg X-1
308.1475  40.9533    2.5  21.5  -31.7   0.2041   4.7    1.7	Cyg X-3
326.3290  38.4719    7.0  34.5  -44.2  -0.0947  -1.6   11.7	Cyg X-2
219.2760  31.6682    1.7  48.0  135.8   1.2892   6.6 ------	UNKNOWN
 87.9849  86.0200    2.1  43.9 -134.5   0.4931   5.4 ------	UNKNOWN
336.1758  14.0251    2.9  57.8  -27.9   1.0517   4.0 ------	UNKNOWN
 69.6749  80.5756    2.7  48.3 -129.4   0.8158   4.3 ------	UNKNOWN
Plot creation:
Sun May 31 13:12:49 EDT 2015