Special notes of this burst
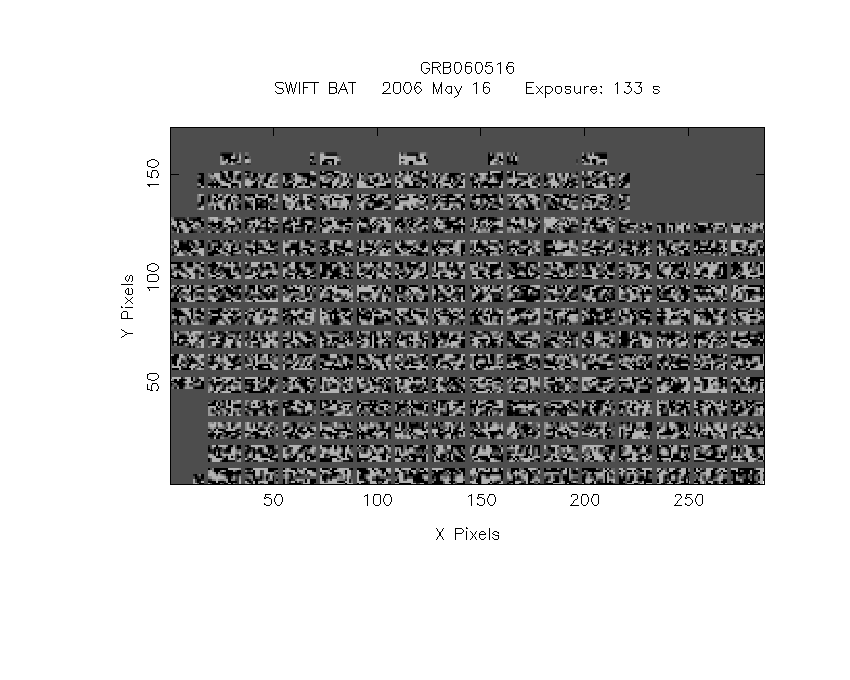
Image
Pre-slew 15.0-350.0 keV image (Event data)
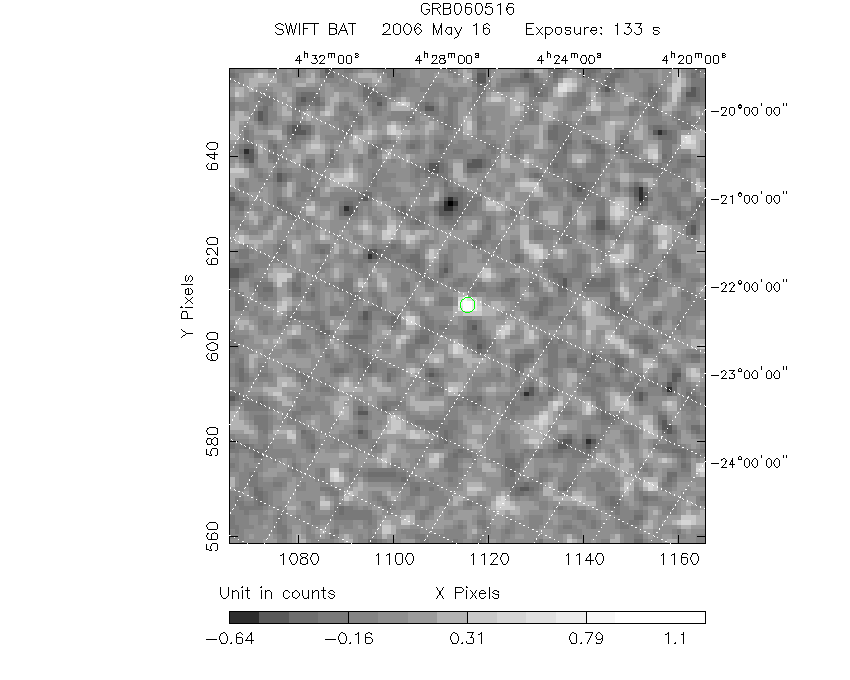
#   RAcent    DECcent   POSerr    Theta     Phi              Peak Cts       SNR   Name
   71.1738   -18.1266   0.0253    29.5962  -150.7527         1.3263521      7.602 TRIG_00210254

Foreground time interval of the image:
-47.000  85.901 (delta_t = 132.901 [sec])
Background time interval of the image:
-239.000 -47.000 (delta_t = 192.000 [sec])
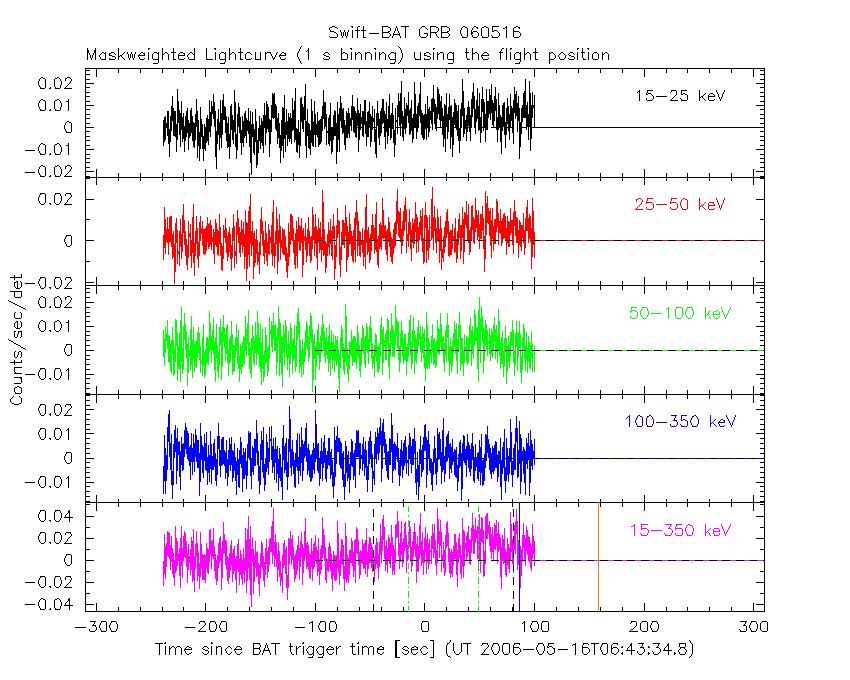
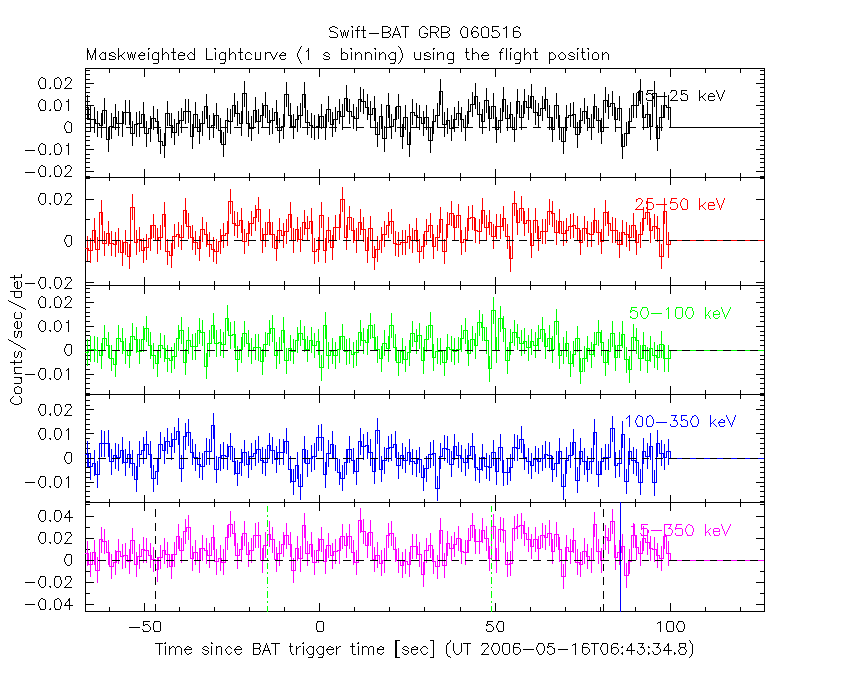
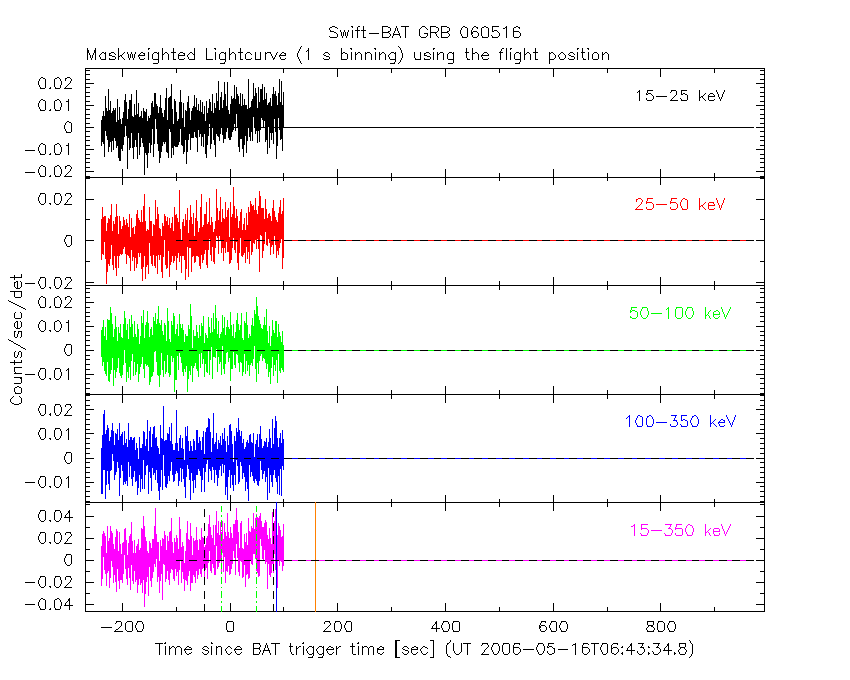
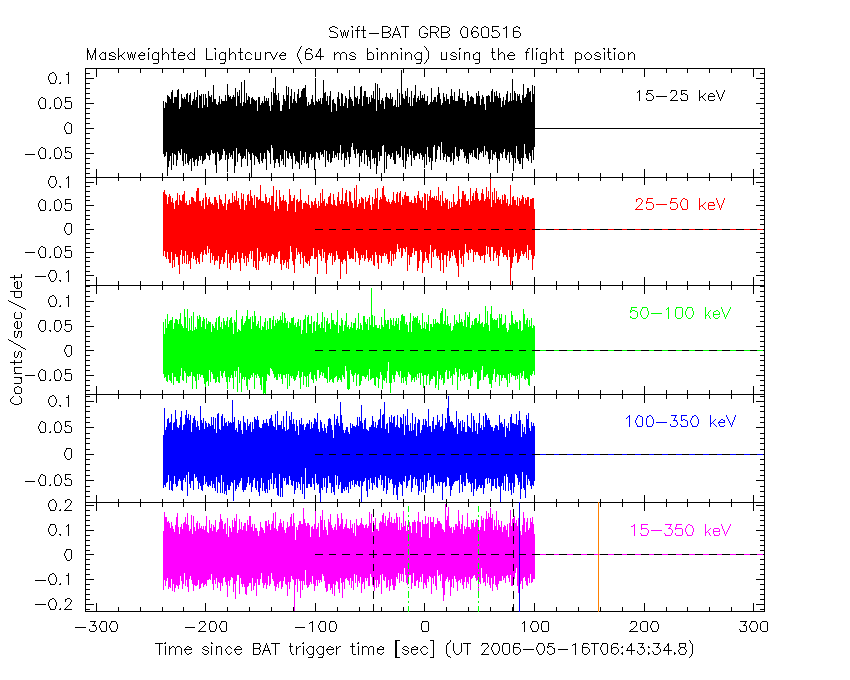
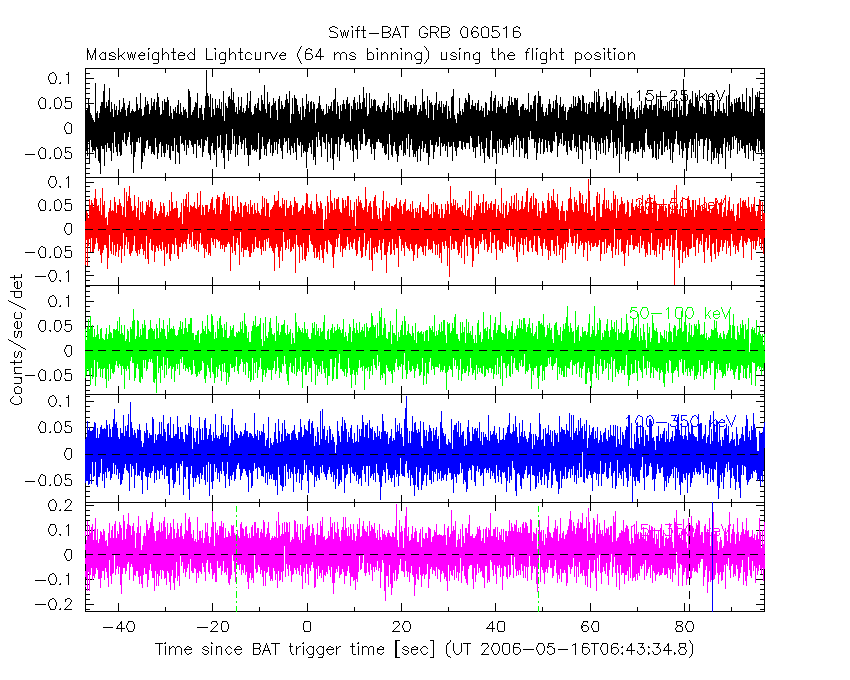
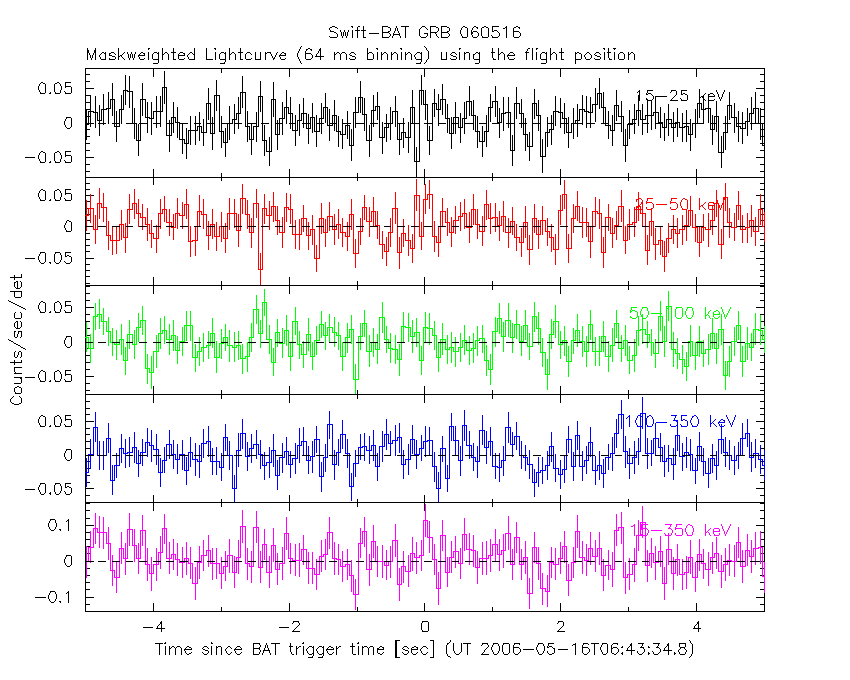
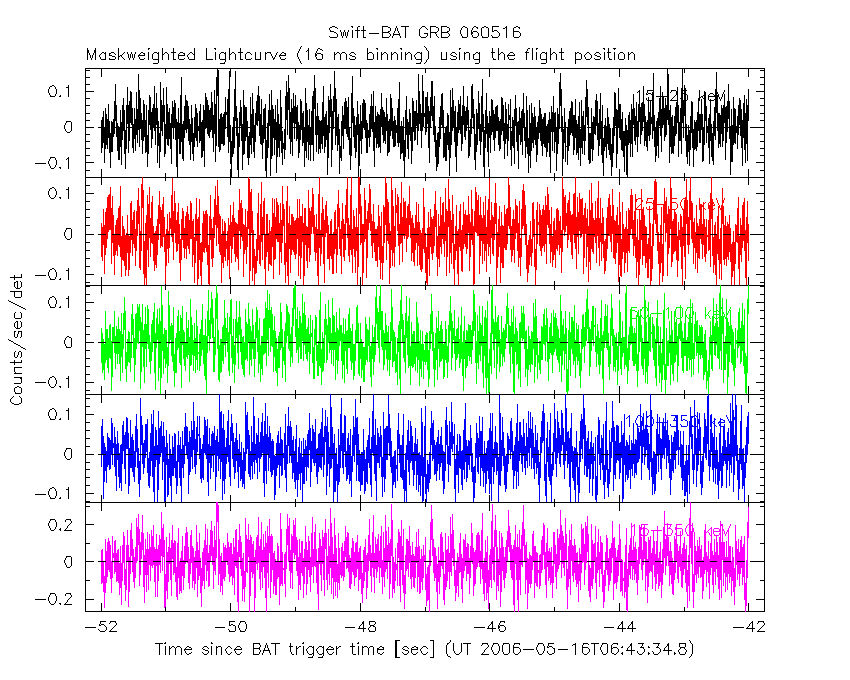
Lightcurves
Notes:
- 1) The mask-weighted light curves are using the flight position.
- 2) Multiple plots of different time binning/intervals are shown to cover all scenarios of short/long GRBs, rate/image triggers, and real/false positives.
- 3) For all the mask-weighted lightcurves, the y-axis units are counts/sec/det where a det is 0.4 x 0.4 = 0.16 sq cm.
- 4) The verticle lines correspond to following: green dotted lines are T50 interval, black dotted lines are T90 interval, blue solid line(s) is a spacecraft slew start time, and orange solid line(s) is a spacecraft slew end time.
- 5) Time of each bin is in the middle of the bin.
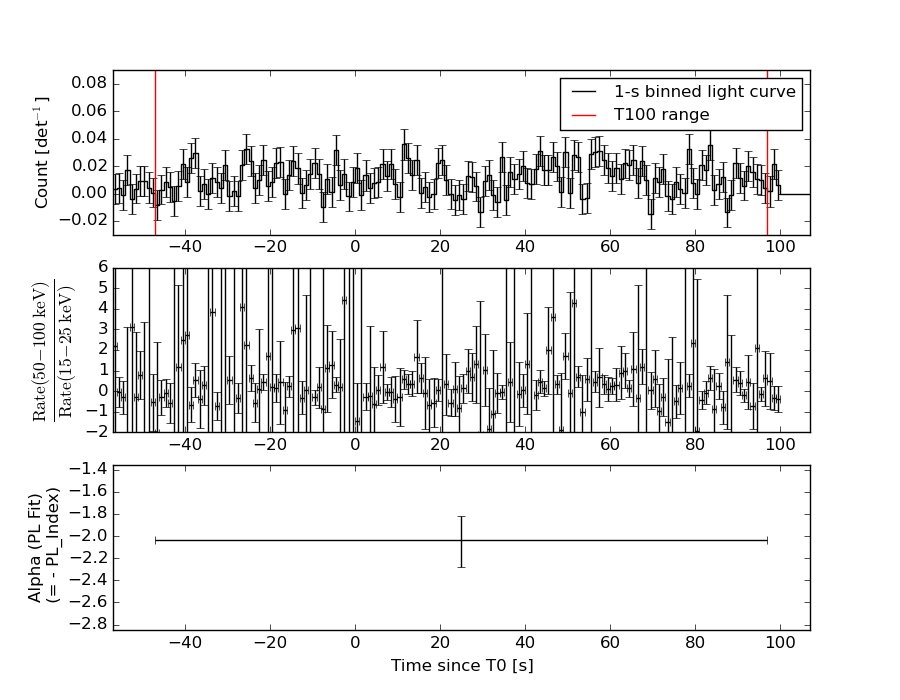
1 s binning
From T0-310 s to T0+310 s
From T100_start - 20 s to T100_end + 30 s
Full time interval
64 ms binning
Full time interval
From T100_start to T100_end
From T0-5 sec to T0+5 sec
16 ms binning
From T100_start-5 s to T100_start+5 s
Blue+Cyan dotted lines: Time interval of the scaled map
From 0.000000 to 64.000000
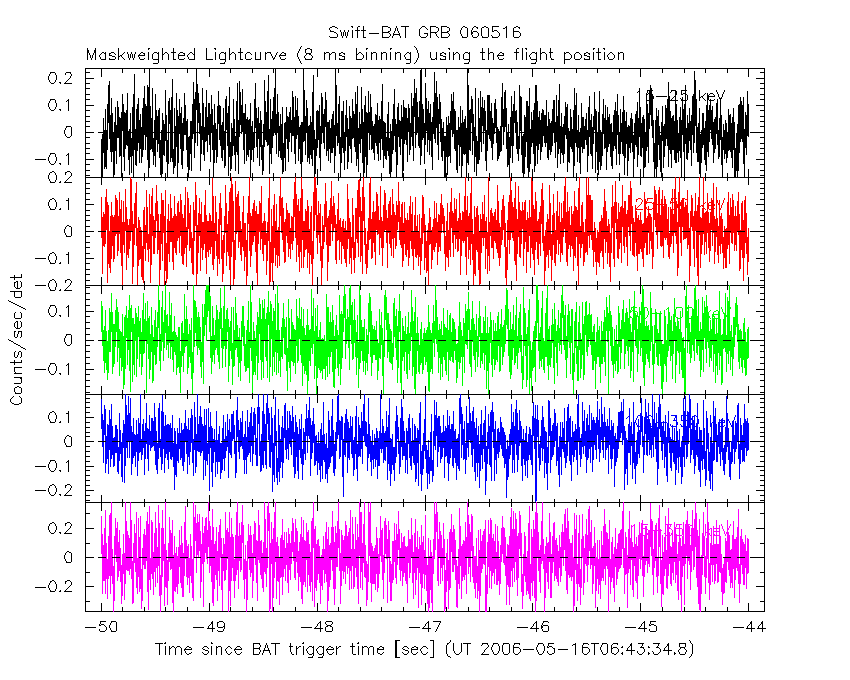
8 ms binning
From T100_start-3 s to T100_start+3 s
Blue+Cyan dotted lines: Time interval of the scaled map
From 0.000000 to 64.000000
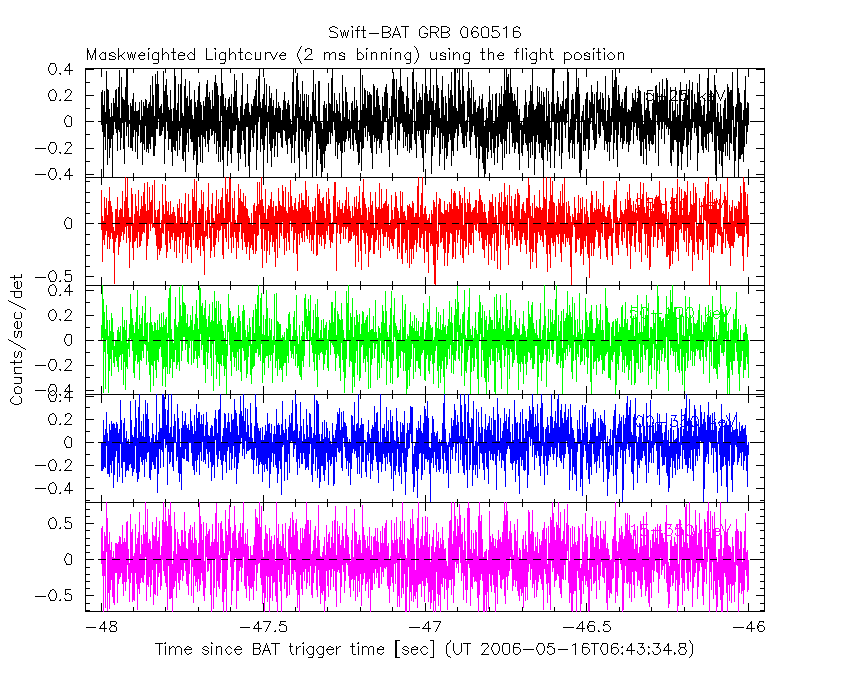
2 ms binning
From T100_start-1 s to T100_start+1 s
Blue+Cyan dotted lines: Time interval of the scaled map
From 0.000000 to 64.000000
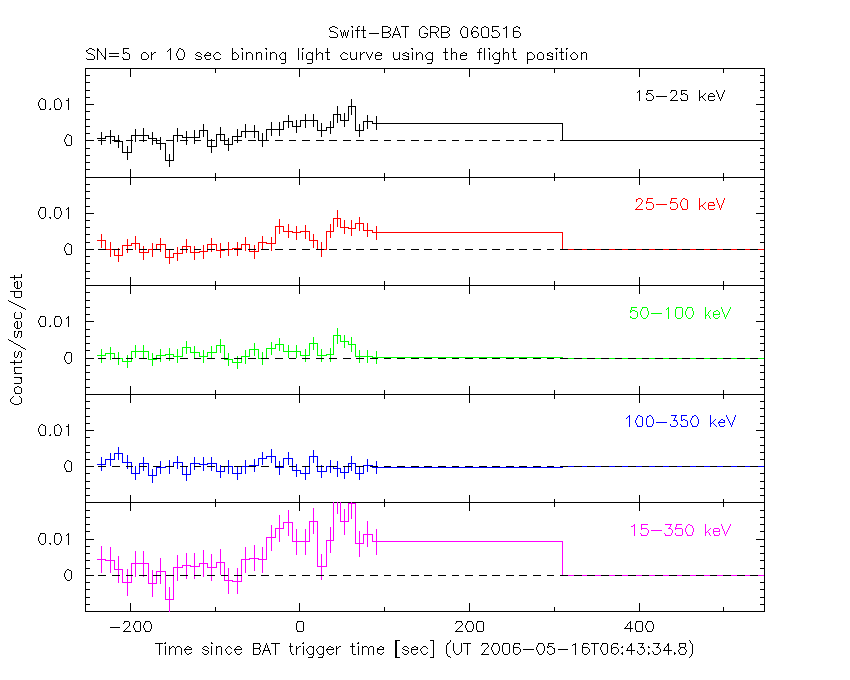
SN=5 or 10 sec. binning (whichever binning is satisfied first)
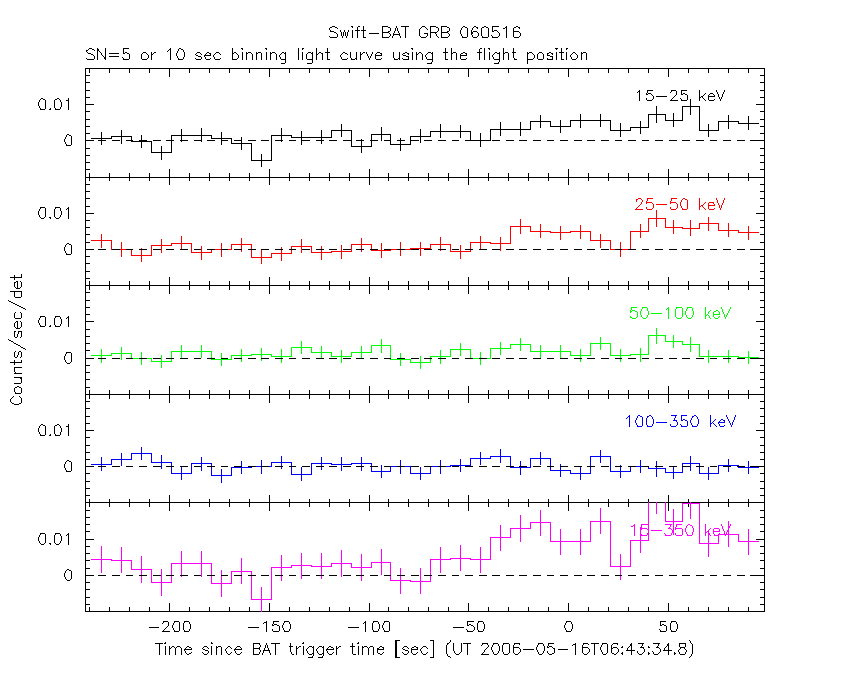
SN=5 or 10 sec. binning (T < 200 sec)
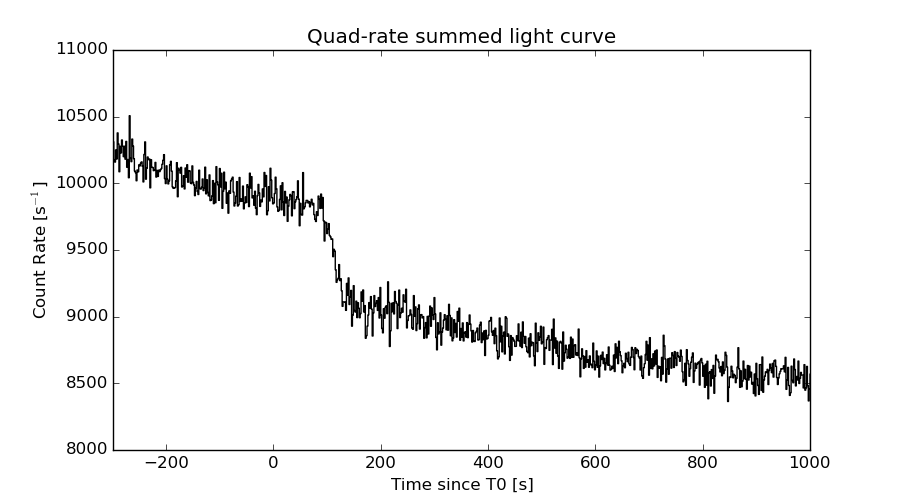
Quad-rate summed light curves (from T0-300s to T0+1000s)
Spectral Evolution
Spectra
Notes:
- 1) The fitting includes the systematic errors.
- 2) When the burst includes telescope slew time periods, the fitting uses an average response file made from multiple 5-s response files through out the slew time plus single time preiod for the non-slew times, and weighted by the total counts in the corresponding time period using addrmf. An average response file is needed becuase a spectral fit using the pre-slew DRM will introduce some errors in both a spectral shape and a normalization if the PHA file contains a lot of the slew/post-slew time interval.
- 3) For fits to more complicated models (e.g. a power-law over a cutoff power-law), the BAT team has decided to require a chi-square improvement of more than 6 for each extra dof.
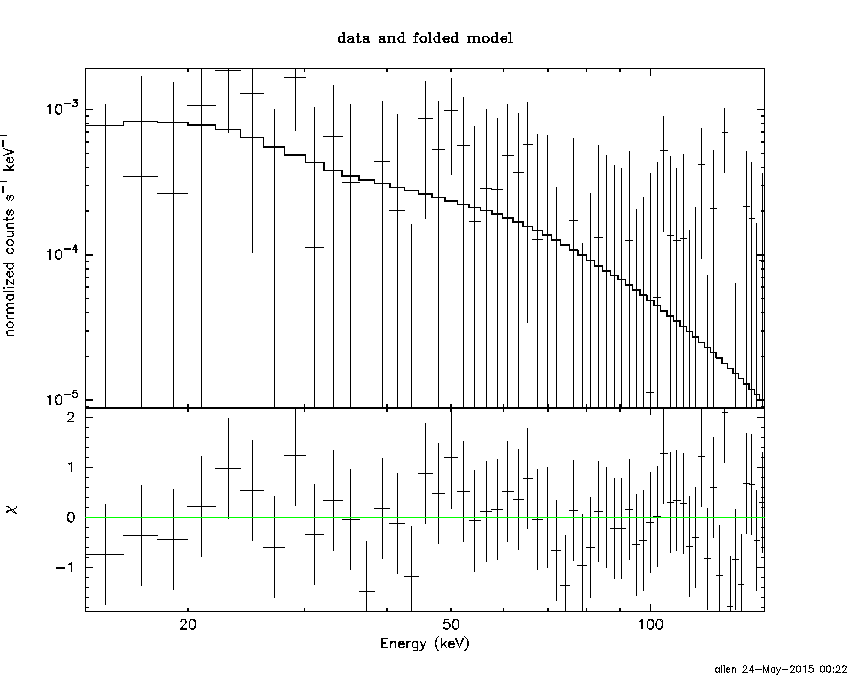
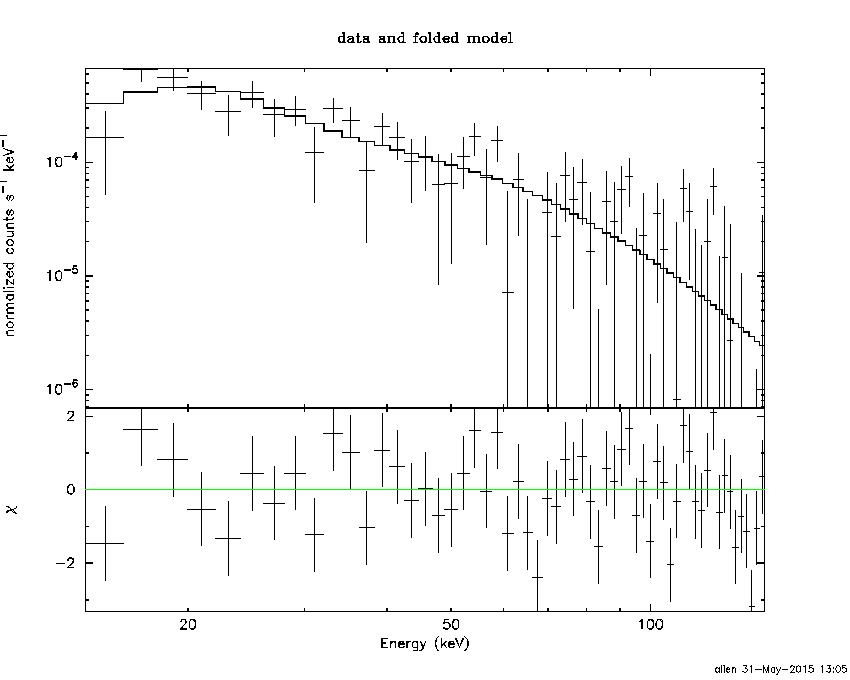
Time averaged spectrum fit using the average DRM
Power-law model
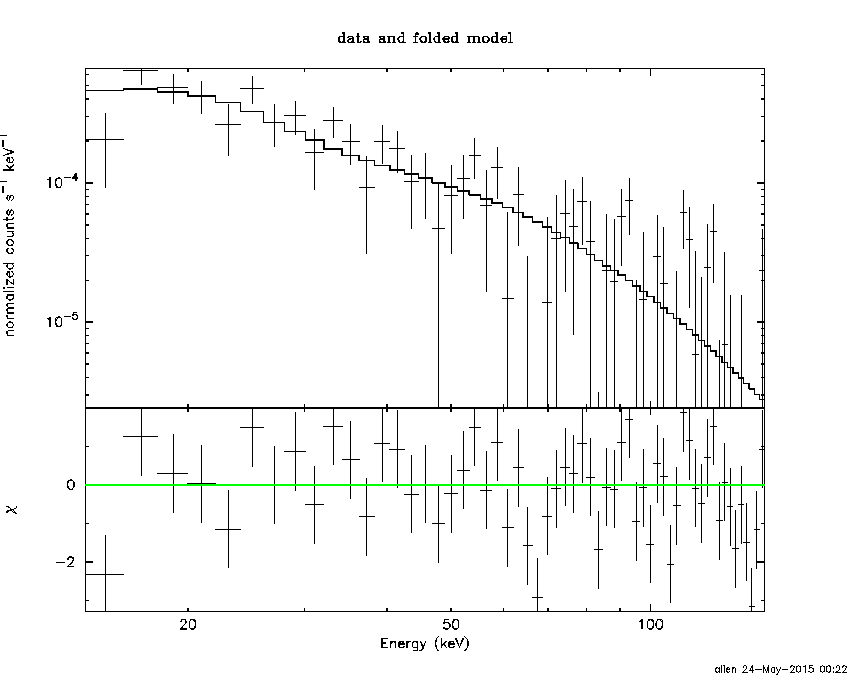
Time interval is from  -47.000 sec. to   97.000 sec.

Spectral model in power-law:
------------------------------------------------------------
Parameters  : value       lower 90%   higher 90%
Photon index: 2.03972     ( -0.224807   0.239618 )
Norm@50keV  : 6.44359E-04    ( -0.000108093   0.000106091 )
------------------------------------------------------------
#Fit statistic : Chi-Squared =          77.88 using 59 PHA bins.
# Reduced chi-squared =          1.366 for     57 degrees of freedom
# Null hypothesis probability =   3.447550e-02

Photon flux (15-150 keV)    in 144 sec: 9.84618E-02 ( -0.0121318  0.0121322 ) ph/cm2/s
Energy fluence (15-150 keV)             : 8.57782e-07 ( -1.31099e-07  1.3591e-07 ) ergs/cm2
Cutoff power-law model

Time interval is from  -47.000 sec. to   97.000 sec.
Spectral model in the cutoff power-law:
------------------------------------------------------------
Parameters  : value       lower 90%   higher 90%
Photon index: 0.803301     ( -1.57831   1.08099 )
Epeak [keV] : 36.2619      ( -17.5006 13.6334 )
Norm@50keV  : 3.73007E-03    ( -0.00373088   0.034297 )
------------------------------------------------------------
#Fit statistic : Chi-Squared =          73.88 using 59 PHA bins.
# Reduced chi-squared =          1.319 for     56 degrees of freedom
# Null hypothesis probability =   5.491923e-02

Photon flux (15-150 keV)    in 144 sec: 9.46405E-02 ( -0.0123825  0.0124675 ) ph/cm2/s
Energy fluence (15-150 keV)             : 7.45989e-07 ( -1.36279e-07  1.5979e-07 ) ergs/cm2
Band function
Time interval is from  -47.000 sec. to   97.000 sec.

Spectral model in the Band function:
------------------------------------------------------------
Parameters  : value       lower 90%   higher 90%
alpha       : -0.884041   ( -0.581246   2.07016 )
beta        : -10.0000    ( 10   5.32907e-15 )
Epeak [keV] : 36.4527      ( -17.8816 15.4085 )
Norm@50keV   : 3.30629E-03    ( -0.00330694   0.035055 )
------------------------------------------------------------
#Fit statistic : Chi-Squared =          73.90 using 59 PHA bins.
# Reduced chi-squared =          1.344 for     55 degrees of freedom
# Null hypothesis probability =   4.544233e-02

Photon flux (15-150 keV)    in 144 sec: 9.59393E-02 ( 6.90406  -0.0140853 ) ph/cm2/s
Energy fluence (15-150 keV)             : 7.82616e-07 ( 0  0 ) ergs/cm2
Single BB

Spectral model blackbody:
------------------------------------------------------------
Parameters  : value    Lower 90%  Upper 90%
kT [keV]    : 8.88958  (-1.12733  1.30831)
R^2/D10^2   : 7.33777E-02  (-0.0304309   0.051231)
(R is the radius in km and D10 is the distance to the source in units of 10 kpc)
------------------------------------------------------------
#Fit statistic : Chi-Squared =          79.32 using 59 PHA bins.
# Reduced chi-squared =          1.392 for     57 degrees of freedom
# Null hypothesis probability =   2.696822e-02

Energy  Fluence     90% Error
[keV]   [erg/cm2]   [erg/cm2]
15- 25  1.615e-07   3.295e-08
25- 50  3.367e-07   6.307e-08
50-150  1.237e-07   4.386e-08
15-150  6.219e-07   1.082e-07
Thermal bremsstrahlung (OTTB)

Spectral model: thermal bremsstrahlung
------------------------------------------------------------
Parameters  : value         Lower 90%    Upper 90%
kT [keV]    : 55.6684       (-16.7125      28.7497)
Norm        : 0.538444       (-0.1036     0.12853)
------------------------------------------------------------
#Fit statistic : Chi-Squared =          74.36 using 59 PHA bins.
# Reduced chi-squared =          1.305 for     57 degrees of freedom
# Null hypothesis probability =   6.102325e-02

Energy  Fluence     90% Error
[keV]   [erg/cm2]   [erg/cm2]
15- 25  1.923e-07   3.118e-08
25- 50  2.858e-07   4.111e-08
50-150  3.051e-07   1.131e-07
15-150  7.832e-07   1.439e-07
Double BB

Spectral model: bbodyrad<1> + bbodyrad<2>
------------------------------------------------------------
Parameters  : value         Lower 90%    Upper 90%
kT1 [keV]   : 6.77228        (-3.23384      1.92786)
R1^2/D10^2  : 0.164130        (-0.0913112      0.992855)
kT2 [keV]   : 20.7044        (-20.8827      53.2525)
R2^2/D10^2  : 1.40236E-03    (-0.00134526   0.0335466)
------------------------------------------------------------
#Fit statistic : Chi-Squared =          73.04 using 59 PHA bins.
# Reduced chi-squared =          1.328 for     55 degrees of freedom
# Null hypothesis probability =   5.225455e-02

Energy  Fluence     90% Error
[keV]   [erg/cm2]   [erg/cm2]
15- 25  1.845e-07   1.028e-07
25- 50  2.995e-07   1.582e-07
50-150  2.991e-07   1.678e-07
15-150  7.831e-07   3.880e-07
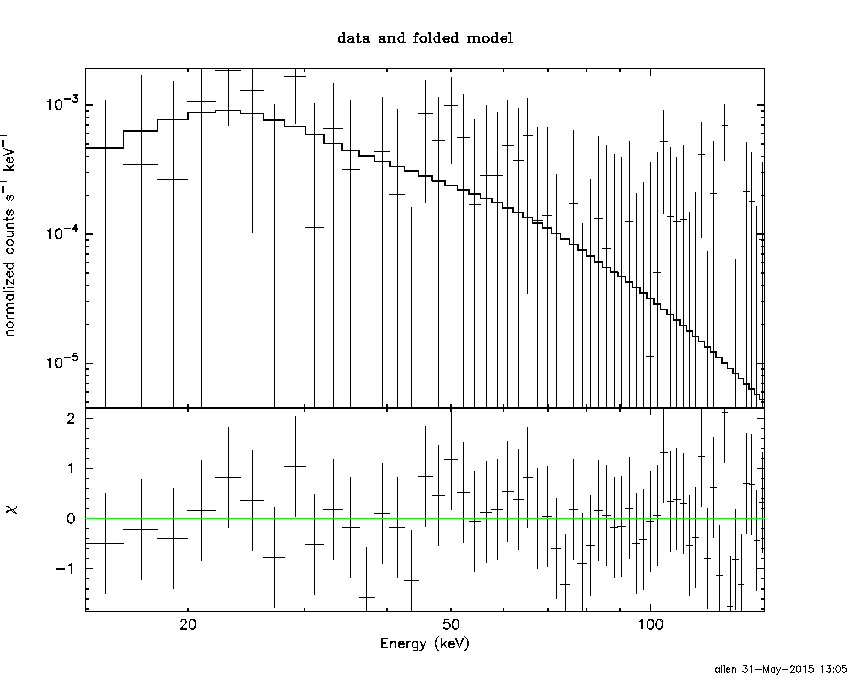
Peak spectrum fit
Power-law model
Time interval is from   56.500 sec. to   57.500 sec.

Spectral model in power-law:
------------------------------------------------------------
Parameters  : value       lower 90%   higher 90%
Photon index: 1.70554     ( -1.18382   1.42726 )
Norm@50keV  : 1.58533E-03    ( -0.00120459   0.00117106 )
------------------------------------------------------------
#Fit statistic : Chi-Squared =          33.35 using 59 PHA bins.
# Reduced chi-squared =         0.5851 for     57 degrees of freedom
# Null hypothesis probability =   9.947971e-01

Photon flux (15-150 keV)    in 1 sec: 0.210947 ( -0.140335  0.140371 ) ph/cm2/s
Energy fluence (15-150 keV)             : 1.46871e-08 ( -1.0569e-08  1.21896e-08 ) ergs/cm2
Cutoff power-law model

Time interval is from   56.500 sec. to   57.500 sec.
Spectral model in the cutoff power-law:
------------------------------------------------------------
Parameters  : value       lower 90%   higher 90%
Photon index: 8.42875E-02     ( 0.241746   1.96831 )
Epeak [keV] : 48.8549      (   )
Norm@50keV  : 1.41073E-02    (     )
------------------------------------------------------------
#Fit statistic : Chi-Squared =          32.67 using 59 PHA bins.
# Reduced chi-squared =         0.5834 for     56 degrees of freedom
# Null hypothesis probability =   9.946346e-01

Photon flux (15-150 keV)    in 1 sec: 0.199621 ( -0.133851  0.13902 ) ph/cm2/s
Energy fluence (15-150 keV)             : 1.20596e-08 ( -8.59846e-09  1.28802e-08 ) ergs/cm2
Band function
Time interval is from   56.500 sec. to   57.500 sec.

Spectral model in the Band function:
------------------------------------------------------------
Parameters  : value       lower 90%   higher 90%
alpha       : 4.38532   ( -4.38376   -0.656081 )
beta        : -2.31406    ( 9.37167   19.3716 )
Epeak [keV] : 29.8606      ( -45.9557 181.026 )
Norm@50keV   : 30.9591    ( -31.0074   28.5304 )
------------------------------------------------------------
#Fit statistic : Chi-Squared =          32.45 using 59 PHA bins.
# Reduced chi-squared =         0.5900 for     55 degrees of freedom
# Null hypothesis probability =   9.933867e-01

Photon flux (15-150 keV)    in 1 sec: 0.199969 (    ) ph/cm2/s
Energy fluence (15-150 keV)             : 0 ( 0  0 ) ergs/cm2
Single BB
Spectral model blackbody:
------------------------------------------------------------
Parameters  : value    Lower 90%  Upper 90%
kT [keV]    : 11.5997  (-6.18497  12.8045)
R^2/D10^2   : 6.40714E-02  (-0.0640714   0.951626)
(R is the radius in km and D10 is the distance to the source in units of 10 kpc)
------------------------------------------------------------
#Fit statistic : Chi-Squared =          32.62 using 59 PHA bins.
# Reduced chi-squared =         0.5722 for     57 degrees of freedom
# Null hypothesis probability =   9.961153e-01

Energy  Fluence     90% Error
[keV]   [erg/cm2]   [erg/cm2]
15- 25  1.817e-09   1.327e-09
25- 50  5.491e-09   3.838e-09
50-150  4.340e-09   3.559e-09
15-150  1.165e-08   9.020e-09
Thermal bremsstrahlung (OTTB)

Spectral model: thermal bremsstrahlung
------------------------------------------------------------
Parameters  : value         Lower 90%    Upper 90%
kT [keV]    : 94.8965       (-94.9383      -94.9383)
Norm        : 0.968855       (-0.655898     1.73971)
------------------------------------------------------------
#Fit statistic : Chi-Squared =          33.06 using 59 PHA bins.
# Reduced chi-squared =         0.5800 for     57 degrees of freedom
# Null hypothesis probability =   9.953518e-01

Energy  Fluence     90% Error
[keV]   [erg/cm2]   [erg/cm2]
15- 25  2.531e-09   1.750e-09
25- 50  4.330e-09   3.069e-09
50-150  6.807e-09   5.990e-09
15-150  1.367e-08   1.031e-08
Double BB

------------------------------------------------------------
Parameters  : value         Lower 90%    Upper 90%
kT1 [keV]   : 5.92019        (-6.2129      -6.2129)
R1^2/D10^2  : 0.103772        (-0.0296851      -0.0296851)
kT2 [keV]   : 11.9233        (-11.6952      -11.6952)
R2^2/D10^2  : 5.34541E-02    (   )
------------------------------------------------------------
#Fit statistic : Chi-Squared =          32.61 using 59 PHA bins.
#Fit statistic : Chi-Squared =          32.58 using 59 PHA bins.
# Reduced chi-squared =         0.5929 for     55 degrees of freedom
# Reduced chi-squared =         0.5923 for     55 degrees of freedom
# Null hypothesis probability =   9.929674e-01
# Null hypothesis probability =   9.930578e-01

Energy  Fluence     90% Error
[keV]   [erg/cm2]   [erg/cm2]
15- 25  1.842e-09   5.150e-08
25- 50  5.529e-09   1.020e-08
50-150  4.436e-09   1.134e-08
15-150  1.181e-08   1.801e-05
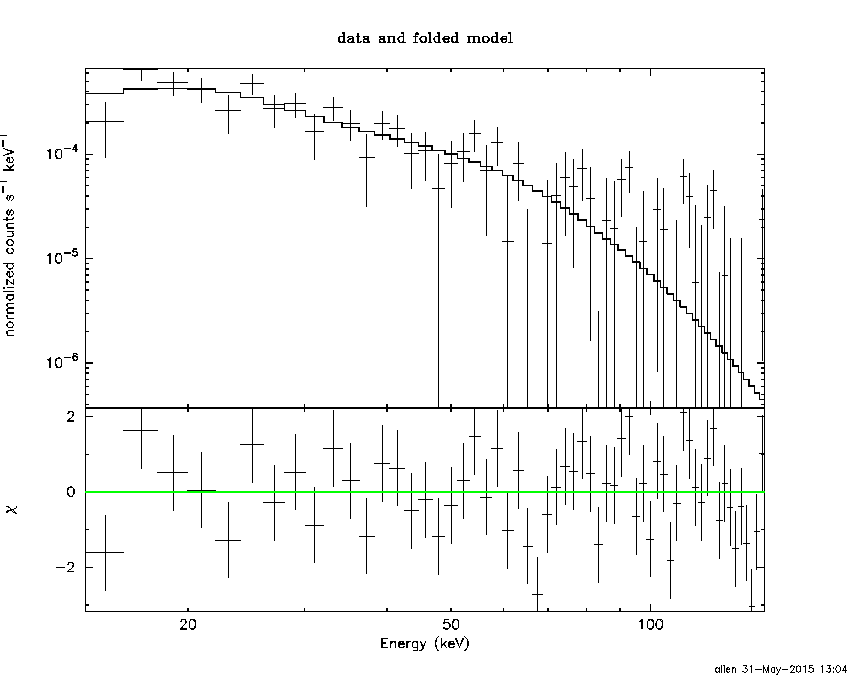
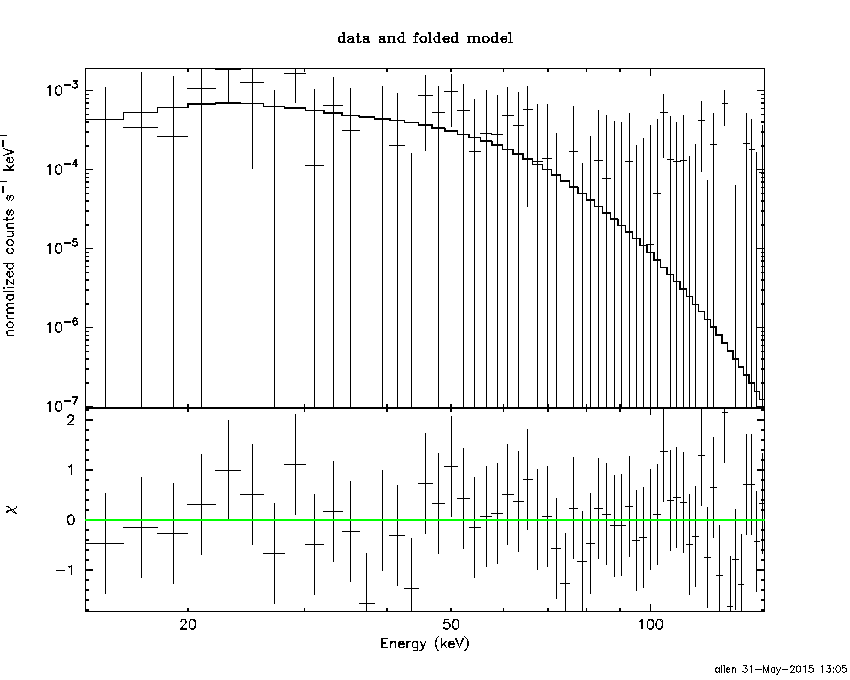
Pre-slew spectrum (Pre-slew PHA with pre-slew DRM)
Power-law model

Spectral model in power-law:
------------------------------------------------------------
Parameters  : value       lower 90%   higher 90%
Photon index: 1.97859     ( -0.231259   0.246528 )
Norm@50keV  : 6.62190E-04    ( -0.00011209   0.000109724 )
------------------------------------------------------------
#Fit statistic : Chi-Squared =          75.49 using 59 PHA bins.
# Reduced chi-squared =          1.324 for     57 degrees of freedom
# Null hypothesis probability =   5.108270e-02

Photon flux (15-150 keV)    in 132.9 sec: 9.83632E-02 ( -0.0125913  0.0125913 ) ph/cm2/s
Energy fluence (15-150 keV)             : 8.10744e-07 ( -1.28107e-07  1.32699e-07 ) ergs/cm2
Cutoff power-law model
Spectral model in the cutoff power-law:
------------------------------------------------------------
Parameters  : value       lower 90%   higher 90%
Photon index: 0.968750     ( -1.46668   1.0156 )
Epeak [keV] : 39.3918      (   )
Norm@50keV  : 2.71696E-03    (     )
------------------------------------------------------------
#Fit statistic : Chi-Squared =          72.60 using 59 PHA bins.
# Reduced chi-squared =          1.296 for     56 degrees of freedom
# Null hypothesis probability =   6.710794e-02

Photon flux (15-150 keV)    in 132.9 sec: 9.50406E-02 ( -0.0128976  0.0129774 ) ph/cm2/s
Energy fluence (15-150 keV)             : 7.20297e-07 ( -1.38163e-07  1.56849e-07 ) ergs/cm2
Band function
Spectral model in the Band function:
------------------------------------------------------------
Parameters  : value       lower 90%   higher 90%
alpha       : 5.00000   ( -6.86153   -5 )
beta        : -2.16749    ( -0.273546   0.29127 )
Epeak [keV] : 22.2990      ( -5.73821 4.85484 )
Norm@50keV   : 234.197    ( -29.5956   1455.7 )
------------------------------------------------------------
#Fit statistic : Chi-Squared =          71.90 using 59 PHA bins.
# Reduced chi-squared =          1.307 for     55 degrees of freedom
# Null hypothesis probability =   6.266215e-02

Photon flux (15-150 keV)    in 132.9 sec: 9.61620E-02 ( 6.90384  -0.01425 ) ph/cm2/s
Energy fluence (15-150 keV)             : 7.49318e-07 ( -7.48388e-07  -1.52782e-07 ) ergs/cm2
S(25-50 keV) vs. S(50-100 keV) plot
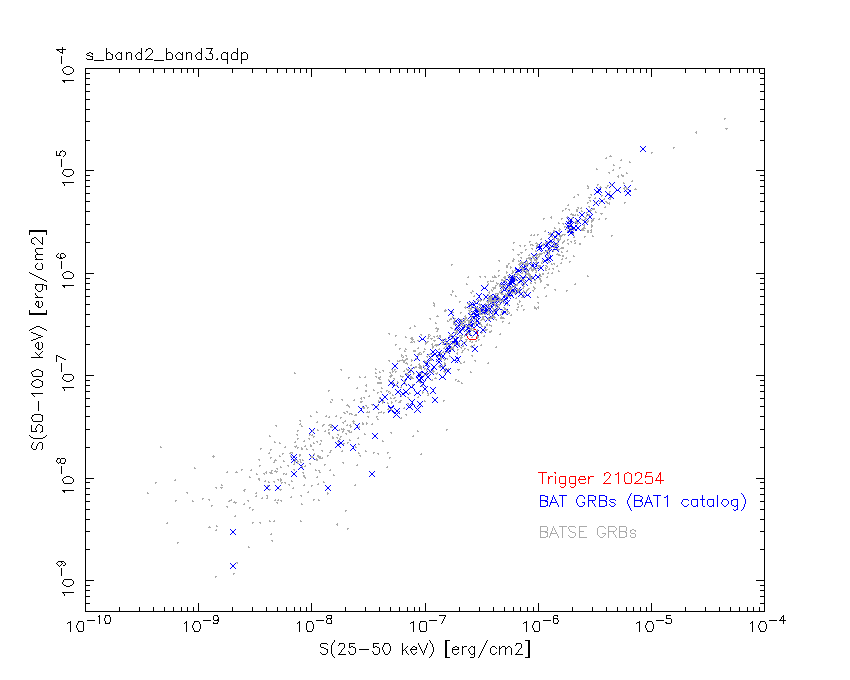
S(25-50 keV)  = 2.61e-07
S(50-100 keV) = 2.54e-07
T90 vs. Hardness ratio plot
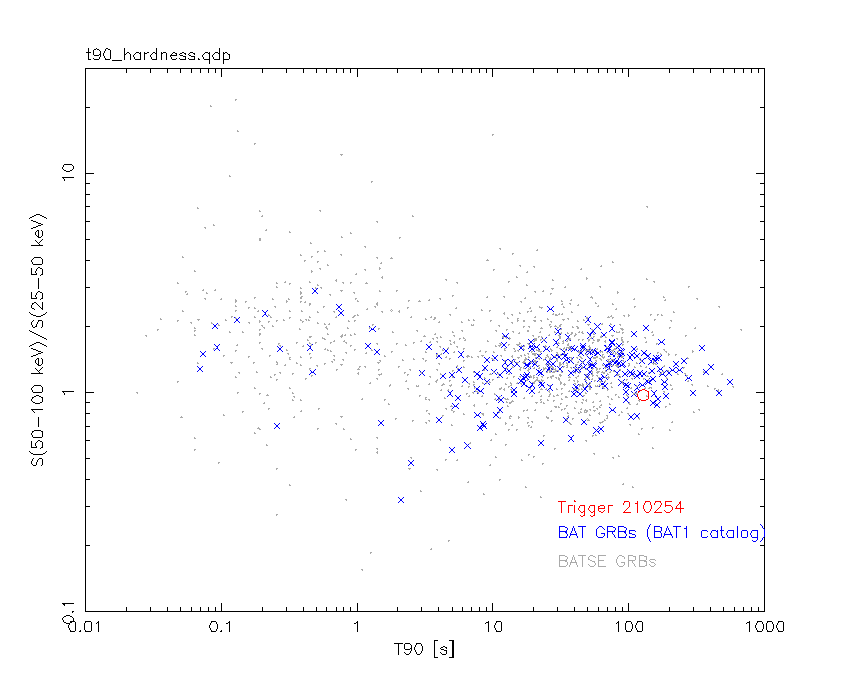
T90                                   = 128 sec.
Hardness ratio (energy fluence ratio) = 0.97318
Color vs. Color plot
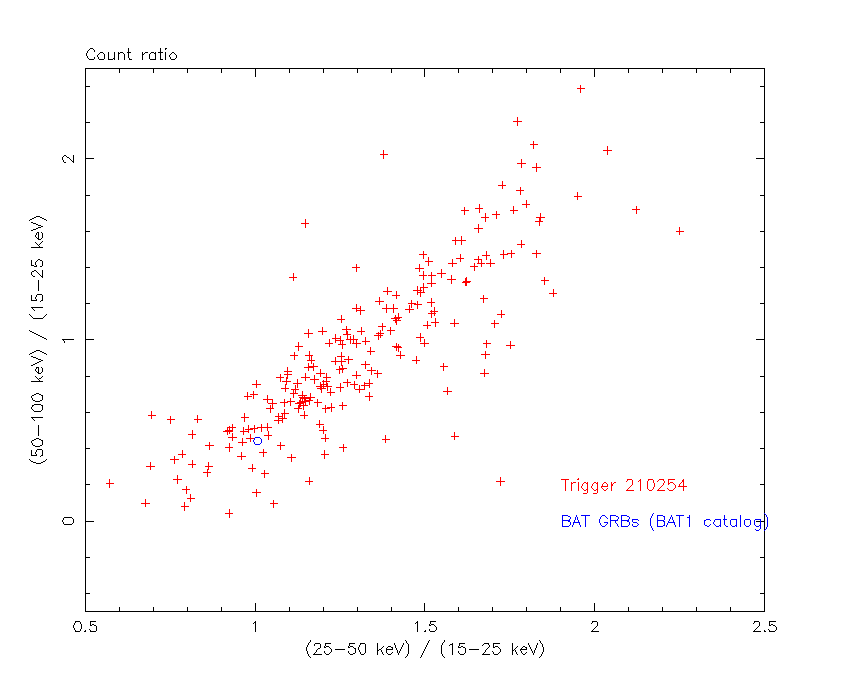
Count Ratio  (25-50 keV) / (15-25 keV) = 1.00713
Count Ratio (50-100 keV) / (15-25 keV) = 0.442449
Mask shadow pattern
IMX = -4.955832647741503E-01, IMY = 2.775087466512913E-01
TIME vs. PHA plot around the trigger time
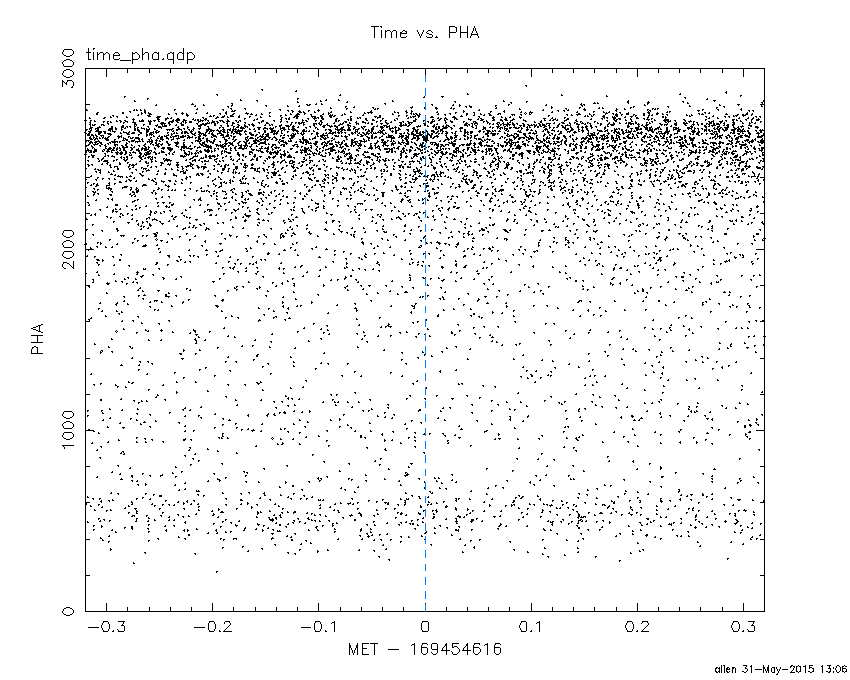
Blue+Cyan dotted lines: Time interval of the scaled map
From 0.000000 to 64.000000
TIME vs. DetID plot around the trigger time
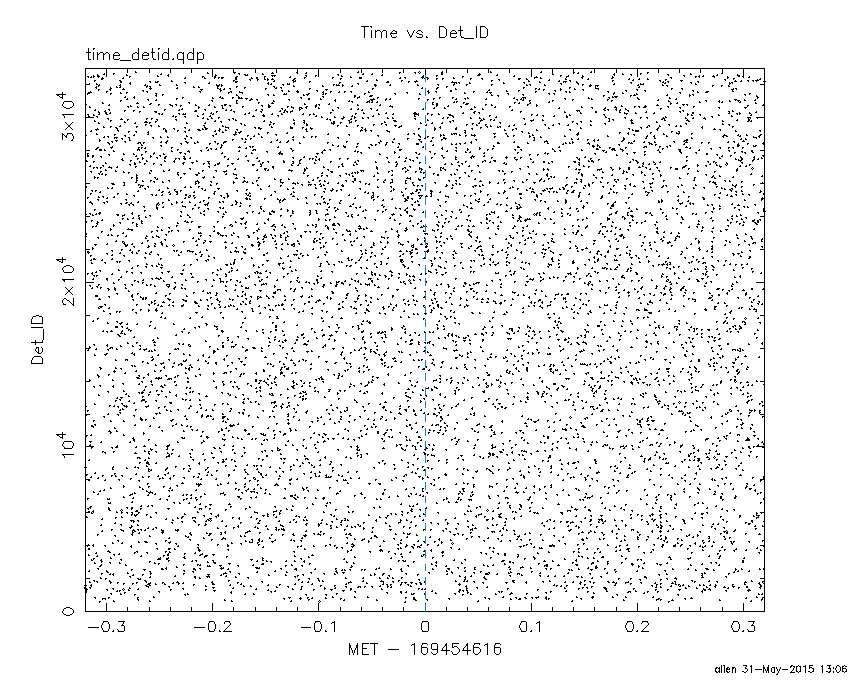
Blue+Cyan dotted lines: Time interval of the scaled map
From 0.000000 to 64.000000
100 us light curve (15-350 keV)
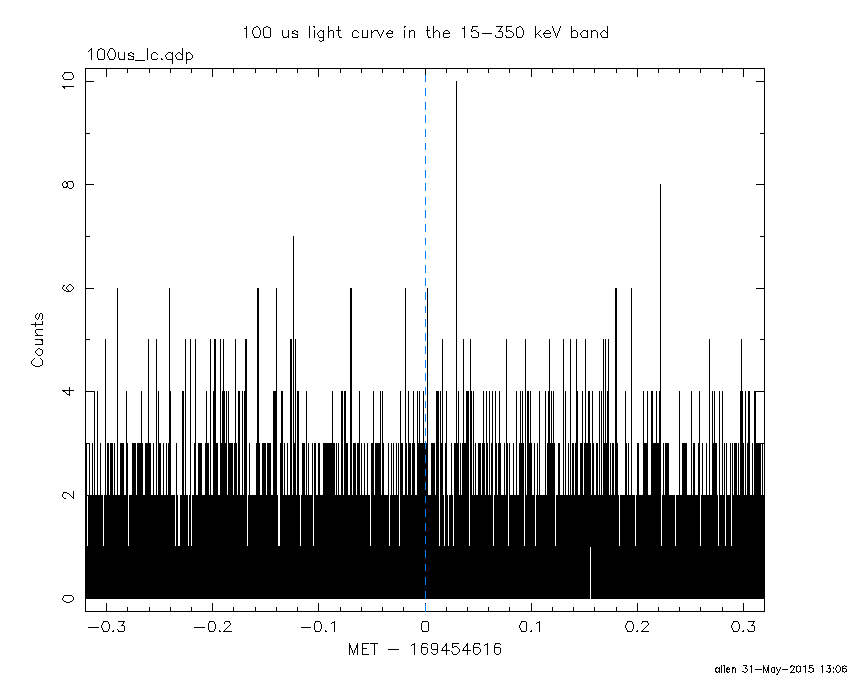
Blue+Cyan dotted lines: Time interval of the scaled map
From 0.000000 to 64.000000
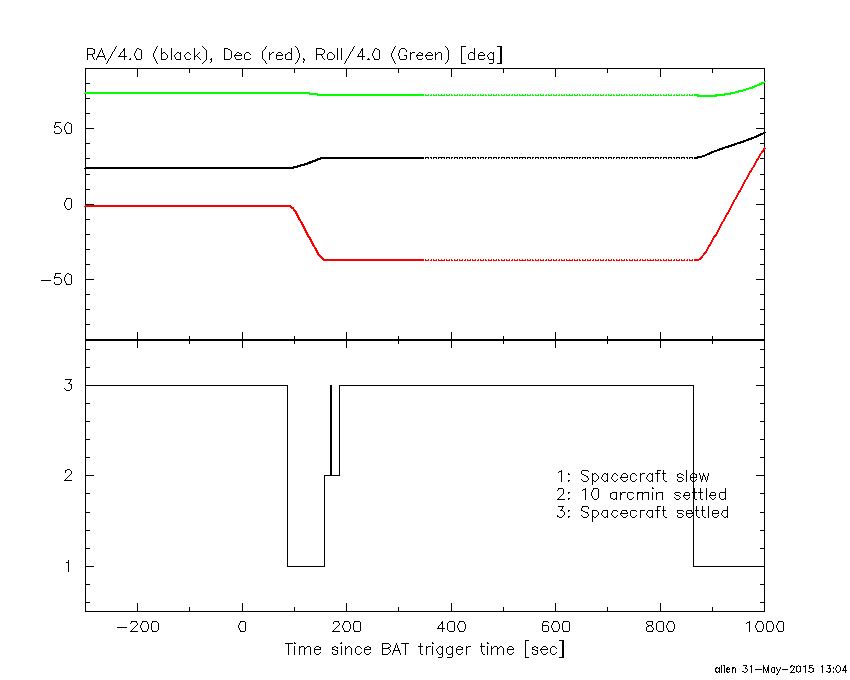
Spacecraft aspect plot
Bright source in the pre-burst/pre-slew/post-slew images
Pre-burst image of 15-350 keV band
Time interval of the image:
-239.000000 -47.000000

# RAcent  DECcent POSerr Theta    Phi  PeakCts   SNR AngSep     Name
#  [deg]    [deg]    ['] [deg]  [deg]                   [']
 83.6353  22.0215    0.3  26.1  -50.9   8.2302  41.4    0.4	Crab
 99.9223 -37.5788    2.0  36.6  150.3   1.4683   5.7 ------	UNKNOWN
105.2838  25.4302    2.6  28.1   -6.1   0.8020   4.4 ------	UNKNOWN
Pre-slew background subtracted image of 15-350 keV band
Time interval of the image:
-47.000000 85.900600

# RAcent  DECcent POSerr Theta    Phi  PeakCts   SNR AngSep     Name
#  [deg]    [deg]    ['] [deg]  [deg]                   [']
 83.5790  21.8827   31.8  26.0  -51.2  -0.0632  -0.4    8.5	Crab
130.8134 -15.4545    2.6  37.3   90.1   1.9158   4.5 ------	UNKNOWN
119.4129  -9.3544    2.5  24.8   85.7   0.8782   4.7 ------	UNKNOWN
 94.2353 -10.4400    2.6   9.4  165.7   0.6196   4.5 ------	UNKNOWN
103.2059  14.1031    2.8  16.9    0.8   0.5561   4.1 ------	UNKNOWN
 71.1738 -18.1266    1.5  29.6 -150.8   1.3257   7.6 ------	UNKNOWN
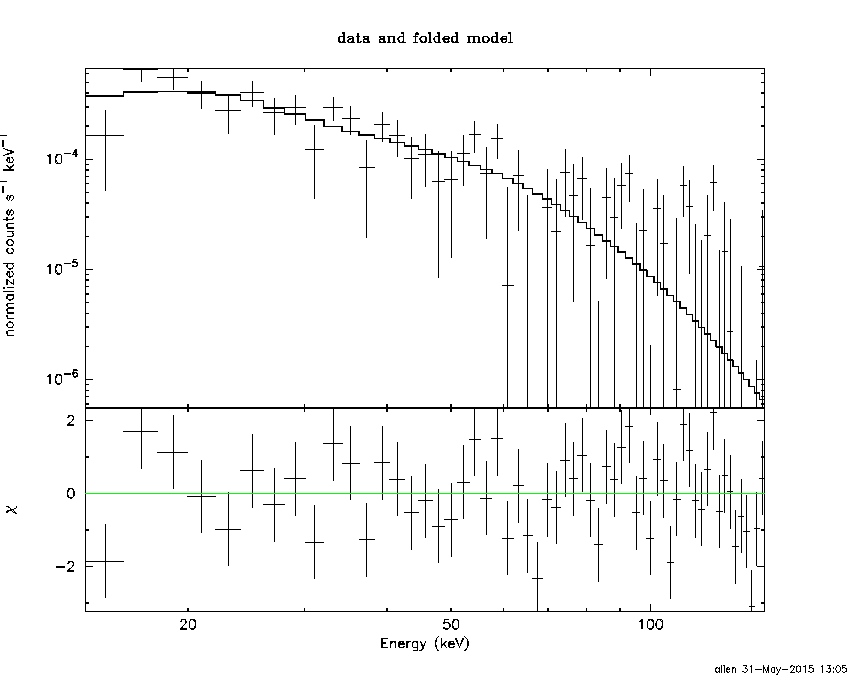
Post-slew image of 15-350 keV band
Time interval of the image:
Plot creation:
Sun May 31 13:06:14 EDT 2015