Click here for the BAT GCN circular template
Image
Pre-slew 15.0-350.0 keV image (Event data)
#   RAcent    DECcent   POSerr    Theta     Phi              Peak Cts       SNR   Name
  232.8338     0.2958   0.0103    24.8540    52.1007         0.7632742     18.646 TRIG_00211957

Foreground time interval of the image:
 -1.360   9.933 (delta_t =  11.293 [sec])
Background time interval of the image:
-239.168  -1.360 (delta_t = 237.808 [sec])
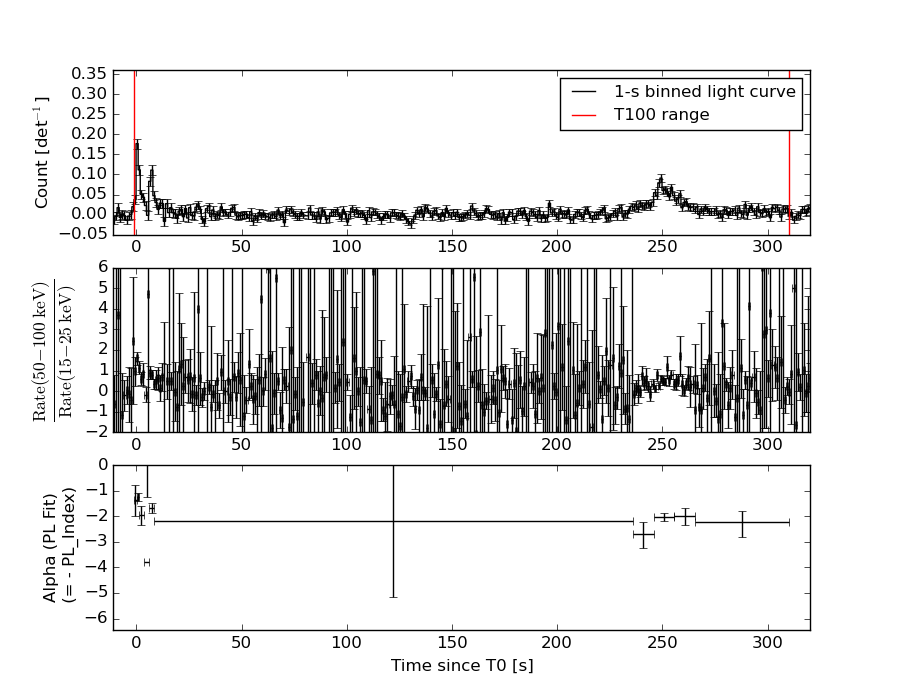
Lightcurves
Notes:
- 1) The mask-weighted light curves are using the flight position.
- 2) Multiple plots of different time binning/intervals are shown to cover all scenarios of short/long GRBs, rate/image triggers, and real/false positives.
- 3) For all the mask-weighted lightcurves, the y-axis units are counts/sec/det where a det is 0.4 x 0.4 = 0.16 sq cm.
- 4) The verticle lines correspond to following: green dotted lines are T50 interval, black dotted lines are T90 interval, blue solid line(s) is a spacecraft slew start time, and orange solid line(s) is a spacecraft slew end time.
- 5) Time of each bin is in the middle of the bin.
1 s binning
From T0-310 s to T0+310 s

From T100_start - 20 s to T100_end + 30 s

Full time interval

64 ms binning
Full time interval

From T100_start to T100_end

From T0-5 sec to T0+5 sec
16 ms binning
From T100_start-5 s to T100_start+5 s

Blue+Cyan dotted lines: Time interval of the scaled map
From 0.000000 to 0.512000
8 ms binning
From T100_start-3 s to T100_start+3 s

Blue+Cyan dotted lines: Time interval of the scaled map
From 0.000000 to 0.512000
2 ms binning
From T100_start-1 s to T100_start+1 s

Blue+Cyan dotted lines: Time interval of the scaled map
From 0.000000 to 0.512000
SN=5 or 10 sec. binning (whichever binning is satisfied first)
SN=5 or 10 sec. binning (T < 200 sec)
Quad-rate summed light curves (from T0-300s to T0+1000s)

Spectral Evolution
Spectra
Notes:
- 1) The fitting includes the systematic errors.
- 2) When the burst includes telescope slew time periods, the fitting uses an average response file made from multiple 5-s response files through out the slew time plus single time preiod for the non-slew times, and weighted by the total counts in the corresponding time period using addrmf. An average response file is needed becuase a spectral fit using the pre-slew DRM will introduce some errors in both a spectral shape and a normalization if the PHA file contains a lot of the slew/post-slew time interval.
- 3) For fits to more complicated models (e.g. a power-law over a cutoff power-law), the BAT team has decided to require a chi-square improvement of more than 6 for each extra dof.
Time averaged spectrum fit using the average DRM
Power-law model

Multiple GTIs in the spectrum
tstart tstop
-1.360000 79.842100
80.832000 310.172000

Spectral model in power-law:
------------------------------------------------------------
Parameters  : value       lower 90%   higher 90%
Photon index: 1.96077     ( -0.215901   0.227342 )
Norm@50keV  : 4.52427E-04    ( -6.1674e-05   5.92804e-05 )
------------------------------------------------------------
#Fit statistic : Chi-Squared =          66.05 using 59 PHA bins.
# Reduced chi-squared =          1.159 for     57 degrees of freedom
# Null hypothesis probability =   1.925837e-01

Photon flux (15-150 keV)    in 310.5 sec: 6.66686E-02 ( -0.00671346  0.00671697 ) ph/cm2/s
Energy fluence (15-150 keV)             : 1.29324e-06 ( -1.6391e-07  1.68183e-07 ) ergs/cm2
Cutoff power-law model

Multiple GTIs in the spectrum
tstart tstop
-1.360000 79.842100
80.832000 310.172000
Spectral model in the cutoff power-law:
------------------------------------------------------------
Parameters  : value       lower 90%   higher 90%
Photon index: 2.13036     (     )
Epeak [keV] : 54.7067      (   )
Norm@50keV  : 3.54129E-04    (     )
------------------------------------------------------------
#Fit statistic : Chi-Squared =          64.21 using 59 PHA bins.
# Reduced chi-squared =          1.147 for     56 degrees of freedom
# Null hypothesis probability =   2.109898e-01

Photon flux (15-150 keV)    in 310.5 sec: 6.66281E-02 ( -0.0066795  0.0067103 ) ph/cm2/s
Energy fluence (15-150 keV)             : 1.2874e-06 ( -1.56712e-07  1.5679e-07 ) ergs/cm2
Band function

Multiple GTIs in the spectrum
tstart tstop
-1.360000 79.842100
80.832000 310.172000

Spectral model in the Band function:
------------------------------------------------------------
Parameters  : value       lower 90%   higher 90%
alpha       : -1.51798   ( 1.51949   1.51949 )
beta        : -1.96051    ( -0.248307   0.215784 )
Epeak [keV] : 14.0866      ( -13.6202 -13.6202 )
Norm@50keV   : 1.28126E-03    ( -0.00129199   0.00355244 )
------------------------------------------------------------
#Fit statistic : Chi-Squared =          66.05 using 59 PHA bins.
# Reduced chi-squared =          1.201 for     55 degrees of freedom
# Null hypothesis probability =   1.461424e-01

Photon flux (15-150 keV)    in 310.5 sec:  (    ) ph/cm2/s
Energy fluence (15-150 keV)             : 0 ( 0  0 ) ergs/cm2
Single BB

Spectral model blackbody:
------------------------------------------------------------
Parameters  : value    Lower 90%  Upper 90%
kT [keV]    : 8.09078  (  )
R^2/D10^2   : 6.35871E-02  (   )
(R is the radius in km and D10 is the distance to the source in units of 10 kpc)
------------------------------------------------------------
#Fit statistic : Chi-Squared =         117.55 using 59 PHA bins.
# Reduced chi-squared =         2.0624 for     57 degrees of freedom
# Null hypothesis probability =   4.276645e-06

Energy  Fluence     90% Error
[keV]   [erg/cm2]   [erg/cm2]
15- 25  2.356e-07   4.932e-08
25- 50  4.206e-07   6.676e-08
50-150  1.146e-07   4.286e-08
15-150  7.708e-07   1.275e-07
Thermal bremsstrahlung (OTTB)

Spectral model: thermal bremsstrahlung
------------------------------------------------------------
Parameters  : value         Lower 90%    Upper 90%
kT [keV]    : 83.8727       (-29.3943      61.0568)
Norm        : 0.300063       (-0.0474493     0.0654693)
------------------------------------------------------------
#Fit statistic : Chi-Squared =          74.41 using 59 PHA bins.
# Reduced chi-squared =          1.305 for     57 degrees of freedom
# Null hypothesis probability =   6.055912e-02

Energy  Fluence     90% Error
[keV]   [erg/cm2]   [erg/cm2]
15- 25  2.424e-07   3.647e-08
25- 50  4.036e-07   4.580e-08
50-150  5.877e-07   2.644e-07
15-150  1.234e-06   3.044e-07
Double BB

Spectral model: bbodyrad<1> + bbodyrad<2>
------------------------------------------------------------
Parameters  : value         Lower 90%    Upper 90%
kT1 [keV]   : 4.88859        (-0.748236      0.865926)
R1^2/D10^2  : 0.423597        (-0.215108      0.478244)
kT2 [keV]   : 28.4794        (-6.96855      12.9215)
R2^2/D10^2  : 5.61171E-04    (-0.000372247   0.00083582)
------------------------------------------------------------
#Fit statistic : Chi-Squared =          56.15 using 59 PHA bins.
# Reduced chi-squared =          1.021 for     55 degrees of freedom
# Null hypothesis probability =   4.315868e-01

Energy  Fluence     90% Error
[keV]   [erg/cm2]   [erg/cm2]
15- 25  3.148e-07   1.170e-07
25- 50  3.180e-07   9.146e-08
50-150  8.100e-07   4.551e-07
15-150  1.443e-06   4.987e-07
Peak spectrum fit
Power-law model

Time interval is from    0.144 sec. to    1.144 sec.

Spectral model in power-law:
------------------------------------------------------------
Parameters  : value       lower 90%   higher 90%
Photon index: 1.29997     ( -0.168861   0.168911 )
Norm@50keV  : 1.39663E-02    ( -0.00142914   0.00142761 )
------------------------------------------------------------
#Fit statistic : Chi-Squared =          70.11 using 59 PHA bins.
# Reduced chi-squared =          1.230 for     57 degrees of freedom
# Null hypothesis probability =   1.139140e-01

Photon flux (15-150 keV)    in 1 sec: 1.66621 ( -0.172497  0.172704 ) ph/cm2/s
Energy fluence (15-150 keV)             : 1.38013e-07 ( -1.56888e-08  1.5822e-08 ) ergs/cm2
Cutoff power-law model

Time interval is from    0.144 sec. to    1.144 sec.
Spectral model in the cutoff power-law:
------------------------------------------------------------
Parameters  : value       lower 90%   higher 90%
Photon index: 0.336056     ( -0.92838   0.757631 )
Epeak [keV] : 89.7918      ( -22.1984 128.223 )
Norm@50keV  : 4.12090E-02    ( -0.0232476   0.0722748 )
------------------------------------------------------------
#Fit statistic : Chi-Squared =          65.21 using 59 PHA bins.
# Reduced chi-squared =          1.164 for     56 degrees of freedom
# Null hypothesis probability =   1.871355e-01

Photon flux (15-150 keV)    in 1 sec: 1.60521 ( -0.18073  0.17958 ) ph/cm2/s
Energy fluence (15-150 keV)             : 1.29933e-07 ( -1.7227e-08  1.7295e-08 ) ergs/cm2
Band function

Time interval is from    0.144 sec. to    1.144 sec.

Spectral model in the Band function:
------------------------------------------------------------
Parameters  : value       lower 90%   higher 90%
alpha       : -0.153815   ( -0.927402   2.53461 )
beta        : -2.02961    ( 2.02769   0.64242 )
Epeak [keV] : 80.0206      ( -38.5248 119.18 )
Norm@50keV   : 5.23531E-02    ( -0.0527775   2.46606 )
------------------------------------------------------------
#Fit statistic : Chi-Squared =          65.12 using 59 PHA bins.
# Reduced chi-squared =          1.184 for     55 degrees of freedom
# Null hypothesis probability =   1.651166e-01

Photon flux (15-150 keV)    in 1 sec: 1.60125 ( 5.39875  -0.18035 ) ph/cm2/s
Energy fluence (15-150 keV)             : 1.30194e-07 ( 0  0 ) ergs/cm2
Single BB

Spectral model blackbody:
------------------------------------------------------------
Parameters  : value    Lower 90%  Upper 90%
kT [keV]    : 16.8204  (-1.90501  2.22507)
R^2/D10^2   : 0.137483  (-0.0474881   0.0696114)
(R is the radius in km and D10 is the distance to the source in units of 10 kpc)
------------------------------------------------------------
#Fit statistic : Chi-Squared =          73.48 using 59 PHA bins.
# Reduced chi-squared =          1.289 for     57 degrees of freedom
# Null hypothesis probability =   6.987515e-02

Energy  Fluence     90% Error
[keV]   [erg/cm2]   [erg/cm2]
15- 25  7.945e-09   1.532e-09
25- 50  3.485e-08   5.160e-09
50-150  7.016e-08   1.276e-08
15-150  1.130e-07   1.562e-08
Thermal bremsstrahlung (OTTB)

Spectral model: thermal bremsstrahlung
------------------------------------------------------------
Parameters  : value         Lower 90%    Upper 90%
kT [keV]    : 200.000       (      )
Norm        : 6.89314       (-0.705735     0.705706)
------------------------------------------------------------
#Fit statistic : Chi-Squared =          73.66 using 59 PHA bins.
# Reduced chi-squared =          1.292 for     57 degrees of freedom
# Null hypothesis probability =   6.793333e-02

Energy  Fluence     90% Error
[keV]   [erg/cm2]   [erg/cm2]
15- 25  1.716e-08   5.515e-09
25- 50  3.302e-08   1.731e-08
50-150  7.241e-08   3.935e-08
15-150  1.226e-07   5.764e-08
Double BB

Spectral model: bbodyrad<1> + bbodyrad<2>
------------------------------------------------------------
Parameters  : value         Lower 90%    Upper 90%
kT1 [keV]   : 8.44592        (-7.36691      -8.53789)
R1^2/D10^2  : 0.622429        (-0.429964      0)
kT2 [keV]   : 23.9883        (-7.70592      -24.4177)
R2^2/D10^2  : 3.20451E-02    (-0.0291323   0.112264)
------------------------------------------------------------
#Fit statistic : Chi-Squared =          66.12 using 59 PHA bins.
# Reduced chi-squared =          1.202 for     55 degrees of freedom
# Null hypothesis probability =   1.449309e-01

Energy  Fluence     90% Error
[keV]   [erg/cm2]   [erg/cm2]
15- 25  1.161e-08   6.500e-09
25- 50  3.416e-08   1.814e-08
50-150  8.291e-08   4.440e-08
15-150  1.287e-07   6.610e-08
Pre-slew spectrum (Pre-slew PHA with pre-slew DRM)
Power-law model

Spectral model in power-law:
------------------------------------------------------------
Parameters  : value       lower 90%   higher 90%
Photon index: 1.61819     ( -0.159298   0.1624 )
Norm@50keV  : 4.09856E-03    ( -0.000389843   0.000384946 )
------------------------------------------------------------
#Fit statistic : Chi-Squared =          41.28 using 59 PHA bins.
# Reduced chi-squared =         0.7242 for     57 degrees of freedom
# Null hypothesis probability =   9.418893e-01

Photon flux (15-150 keV)    in 11.29 sec: 0.529695 ( -0.0466504  0.0466948 ) ph/cm2/s
Energy fluence (15-150 keV)             : 4.31822e-07 ( -4.41577e-08  4.47058e-08 ) ergs/cm2
Cutoff power-law model

Spectral model in the cutoff power-law:
------------------------------------------------------------
Parameters  : value       lower 90%   higher 90%
Photon index: 1.58957     (     )
Epeak [keV] : 684.775      (   )
Norm@50keV  : 4.24386E-03    (     )
------------------------------------------------------------
#Fit statistic : Chi-Squared =          41.27 using 59 PHA bins.
# Reduced chi-squared =         0.7370 for     56 degrees of freedom
# Null hypothesis probability =   9.295187e-01

Photon flux (15-150 keV)    in 11.29 sec: 0.528456 ( -0.048112  0.047687 ) ph/cm2/s
Energy fluence (15-150 keV)             : 4.30007e-07 ( -4.85188e-08  4.62867e-08 ) ergs/cm2
Band function

Spectral model in the Band function:
------------------------------------------------------------
Parameters  : value       lower 90%   higher 90%
alpha       : -1.22011   ( 1.21851   6.21284 )
beta        : -1.62622    ( 1.63028   0.169034 )
Epeak [keV] : 45.9480      ( -45.0763 -45.0763 )
Norm@50keV   : 8.30571E-03    ( -0.00522275   0 )
------------------------------------------------------------
#Fit statistic : Chi-Squared =          41.20 using 59 PHA bins.
# Reduced chi-squared =         0.7491 for     55 degrees of freedom
# Null hypothesis probability =   9.162532e-01

Photon flux (15-150 keV)    in 11.29 sec:  (    ) ph/cm2/s
Energy fluence (15-150 keV)             : 0 ( 0  0 ) ergs/cm2
S(25-50 keV) vs. S(50-100 keV) plot

S(25-50 keV)  = 3.85e-07
S(50-100 keV) = 3.95e-07
T90 vs. Hardness ratio plot

T90                                   = 298.040000021458 sec.
Hardness ratio (energy fluence ratio) = 1.02597
Color vs. Color plot
Count Ratio  (25-50 keV) / (15-25 keV) = 0.779961
Count Ratio (50-100 keV) / (15-25 keV) = 0.631581
Mask shadow pattern

IMX = 2.845381887767856E-01, IMY = -3.655144875083937E-01
TIME vs. PHA plot around the trigger time

Blue+Cyan dotted lines: Time interval of the scaled map
From 0.000000 to 0.512000
TIME vs. DetID plot around the trigger time

Blue+Cyan dotted lines: Time interval of the scaled map
From 0.000000 to 0.512000
100 us light curve (15-350 keV)

Blue+Cyan dotted lines: Time interval of the scaled map
From 0.000000 to 0.512000
Spacecraft aspect plot

Bright source in the pre-burst/pre-slew/post-slew images
Pre-burst image of 15-350 keV band
Time interval of the image:
-239.168000 -1.360000

# RAcent  DECcent POSerr Theta    Phi  PeakCts   SNR AngSep     Name
#  [deg]    [deg]    ['] [deg]  [deg]                   [']
254.2914  35.3213   84.8  51.8   -0.4   0.0563   0.1    8.2	Her X-1
166.0482 -30.8355    2.7  54.2  177.0   2.4392   4.2 ------	UNKNOWN
214.0225  55.7399    2.7  50.7  -44.5   3.4892   4.2 ------	UNKNOWN
206.6188  53.5641    3.0  48.4  -50.0   3.3319   3.9 ------	UNKNOWN
Pre-slew background subtracted image of 15-350 keV band
Time interval of the image:
-1.360000 9.932600

# RAcent  DECcent POSerr Theta    Phi  PeakCts   SNR AngSep     Name
#  [deg]    [deg]    ['] [deg]  [deg]                   [']
254.5850  35.2875    4.6  52.0   -0.2   0.2192   2.5    7.1	Her X-1
232.8338   0.2957    0.6  24.9   52.1   0.7633  18.6 ------	UNKNOWN
Post-slew image of 15-350 keV band
Time interval of the image:
59.332650 79.842100
80.832000 962.923200

# RAcent  DECcent POSerr Theta    Phi  PeakCts   SNR AngSep     Name
#  [deg]    [deg]    ['] [deg]  [deg]                   [']
244.9741 -15.6363    0.2  19.9   78.6  31.0780  50.4    0.4	Sco X-1
254.6990  35.2475    0.0  40.5  -37.1   0.9651   1.1   13.1	Her X-1
262.9527 -24.7708    5.6  38.4   67.9   3.3680   2.1    3.4	GX 1+4
268.3854  -1.5452    2.5  35.6   28.0   3.5794   4.6    5.7	SW J1753.5-0127
274.0269 -14.0600    3.0  43.2   46.1   5.6933   3.9    1.9	GX 17+2
Plot creation:
Sun May 31 13:02:52 EDT 2015