Special notes of this burst
Image
Pre-slew 15.0-50.0 keV image (Event data)

#RAcent DECcent POSerr Theta  Phi  Peak_Cts  SNR Name
337.242 -10.905 0.000 25.123 148.851 0.123 8.011 TRIG_00213486

Image time interval: 0.000 to 4.096 [sec]
Lightcurves
Notes:
- 1) The mask-weighted light curves are using the flight position.
- 2) Multiple plots of different time binning/intervals are shown to cover all scenarios of short/long GRBs, rate/image triggers, and real/false positives.
- 3) For all the mask-weighted lightcurves, the y-axis units are counts/sec/det where a det is 0.4 x 0.4 = 0.16 sq cm.
- 4) The verticle lines correspond to following: green dotted lines are T50 interval, black dotted lines are T90 interval, blue solid line(s) is a spacecraft slew start time, and orange solid line(s) is a spacecraft slew end time.
- 5) Time of each bin is in the middle of the bin.
1 s binning
From T0-310 s to T0+310 s

From T100_start - 20 s to T100_end + 30 s

Full time interval
64 ms binning
Full time interval

From T100_start to T100_end

From T0-5 sec to T0+5 sec

16 ms binning
From T100_start-5 s to T100_start+5 s

Blue+Cyan dotted lines: Time interval of the scaled map
From 0.000000 to 4.096000
8 ms binning
From T100_start-3 s to T100_start+3 s

Blue+Cyan dotted lines: Time interval of the scaled map
From 0.000000 to 4.096000
2 ms binning
From T100_start-1 s to T100_start+1 s
Blue+Cyan dotted lines: Time interval of the scaled map
From 0.000000 to 4.096000
SN=5 or 10 sec. binning (whichever binning is satisfied first)

SN=5 or 10 sec. binning (T < 200 sec)

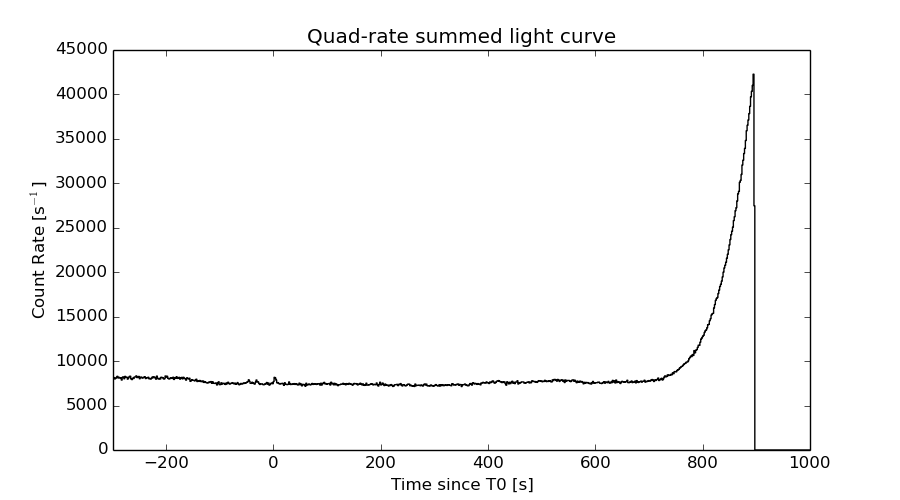
Quad-rate summed light curves (from T0-300s to T0+1000s)
Spectral Evolution

Spectra
Notes:
- 1) The fitting includes the systematic errors.
- 2) When the burst includes telescope slew time periods, the fitting uses an average response file made from multiple 5-s response files through out the slew time plus single time preiod for the non-slew times, and weighted by the total counts in the corresponding time period using addrmf. An average response file is needed becuase a spectral fit using the pre-slew DRM will introduce some errors in both a spectral shape and a normalization if the PHA file contains a lot of the slew/post-slew time interval.
- 3) For fits to more complicated models (e.g. a power-law over a cutoff power-law), the BAT team has decided to require a chi-square improvement of more than 6 for each extra dof.
Time averaged spectrum fit using the average DRM
Power-law model

Time interval is from  -63.248 sec. to   32.752 sec.

Spectral model in power-law:
------------------------------------------------------------
Parameters  : value       lower 90%   higher 90%
Photon index: 2.05392     ( -0.393319   0.453088 )
Norm@50keV  : 4.22780E-04    ( -0.000124944   0.000118021 )
------------------------------------------------------------
#Fit statistic : Chi-Squared =          41.52 using 59 PHA bins.
# Reduced chi-squared =         0.7285 for     57 degrees of freedom
# Null hypothesis probability =   9.385169e-01

Photon flux (15-150 keV)    in 96 sec: 6.50415E-02 ( -0.0131122  0.0131132 ) ph/cm2/s
Energy fluence (15-150 keV)             : 3.75592e-07 ( -9.65933e-08  1.02045e-07 ) ergs/cm2
Cutoff power-law model

Time interval is from  -63.248 sec. to   32.752 sec.
Spectral model in the cutoff power-law:
------------------------------------------------------------
Parameters  : value       lower 90%   higher 90%
Photon index: 2.07142     (     )
Epeak [keV] : 139.754      (   )
Norm@50keV  : 4.11897E-04    (     )
------------------------------------------------------------
#Fit statistic : Chi-Squared =          41.52 using 59 PHA bins.
# Reduced chi-squared =         0.7414 for     56 degrees of freedom
# Null hypothesis probability =   9.255615e-01

Photon flux (15-150 keV)    in 96 sec: 6.50222E-02 ( -0.0131175  0.0130775 ) ph/cm2/s
Energy fluence (15-150 keV)             : 3.75056e-07 ( -1.07346e-07  7.73962e-08 ) ergs/cm2
Band function

Time interval is from  -63.248 sec. to   32.752 sec.

Spectral model in the Band function:
------------------------------------------------------------
Parameters  : value       lower 90%   higher 90%
alpha       : -1.71422   ( 1.71566   1.71566 )
beta        : -2.05290    ( 2.05347   0.393231 )
Epeak [keV] : 12.5239      ( -11.9154 -11.9154 )
Norm@50keV   : 8.95323E-04    ( -0.000546283   0.0726035 )
------------------------------------------------------------
#Fit statistic : Chi-Squared =          41.52 using 59 PHA bins.
# Reduced chi-squared =         0.7550 for     55 degrees of freedom
# Null hypothesis probability =   9.103668e-01

Photon flux (15-150 keV)    in 96 sec:  (    ) ph/cm2/s
Energy fluence (15-150 keV)             : 0 ( 0  0 ) ergs/cm2
Single BB

Spectral model blackbody:
------------------------------------------------------------
Parameters  : value    Lower 90%  Upper 90%
kT [keV]    : 9.32581  (-2.48293  3.11254)
R^2/D10^2   : 3.83963E-02  (-0.0253219   0.087869)
(R is the radius in km and D10 is the distance to the source in units of 10 kpc)
------------------------------------------------------------
#Fit statistic : Chi-Squared =          49.54 using 59 PHA bins.
# Reduced chi-squared =         0.8692 for     57 degrees of freedom
# Null hypothesis probability =   7.480210e-01

Energy  Fluence     90% Error
[keV]   [erg/cm2]   [erg/cm2]
15- 25  6.350e-08   2.588e-08
25- 50  1.426e-07   5.442e-08
50-150  6.057e-08   3.290e-08
15-150  2.666e-07   1.117e-07
Thermal bremsstrahlung (OTTB)

Spectral model: thermal bremsstrahlung
------------------------------------------------------------
Parameters  : value         Lower 90%    Upper 90%
kT [keV]    : 61.1785       (-29.0751      86.7189)
Norm        : 0.336336       (-0.0993549     0.159425)
------------------------------------------------------------
#Fit statistic : Chi-Squared =          42.27 using 59 PHA bins.
# Reduced chi-squared =         0.7415 for     57 degrees of freedom
# Null hypothesis probability =   9.274095e-01

Energy  Fluence     90% Error
[keV]   [erg/cm2]   [erg/cm2]
15- 25  8.140e-08   2.551e-08
25- 50  1.246e-07   4.082e-08
50-150  1.441e-07   9.510e-08
15-150  3.501e-07   1.338e-07
Double BB

Spectral model: bbodyrad<1> + bbodyrad<2>
------------------------------------------------------------
Parameters  : value         Lower 90%    Upper 90%
kT1 [keV]   : 4.04912        (-1.94053      2.80373)
R1^2/D10^2  : 0.771232        (-0.670175      26.1189)
kT2 [keV]   : 16.2361        (-5.76965      19.1527)
R2^2/D10^2  : 3.65555E-03    (-0.00344163   0.0113429)
------------------------------------------------------------
#Fit statistic : Chi-Squared =          41.29 using 59 PHA bins.
# Reduced chi-squared =         0.7507 for     55 degrees of freedom
# Null hypothesis probability =   9.146441e-01

Energy  Fluence     90% Error
[keV]   [erg/cm2]   [erg/cm2]
15- 25  9.048e-08   4.886e-08
25- 50  1.079e-07   5.688e-08
50-150  1.508e-07   9.869e-08
15-150  3.492e-07   1.849e-07
Peak spectrum fit
Power-law model

Time interval is from    8.252 sec. to    9.252 sec.

Spectral model in power-law:
------------------------------------------------------------
Parameters  : value       lower 90%   higher 90%
Photon index: 10.0000     (     )
Norm@50keV  : 9.92330E-08    ( -9.82667e-08   -9.82667e-08 )
------------------------------------------------------------
#Fit statistic : Chi-Squared =          52.68 using 59 PHA bins.
# Reduced chi-squared =         0.9243 for     57 degrees of freedom
# Null hypothesis probability =   6.375550e-01

Photon flux (15-150 keV)    in 1 sec: 2.95873E-02 2.77539E-02 ( -0.0295873  0.124165 ) ph/cm2/s
Energy fluence (15-150 keV)             : 6.0488e-19 ( -8.0578e-10  8.30466e-09 ) ergs/cm2
Cutoff power-law model

Time interval is from    8.252 sec. to    9.252 sec.
Spectral model in the cutoff power-law:
------------------------------------------------------------
Parameters  : value       lower 90%   higher 90%
Photon index: -9.98105     (     )
Epeak [keV] : 48.0057      ( -47.6986 -47.6986 )
Norm@50keV  : 336.409    (     )
------------------------------------------------------------
#Fit statistic : Chi-Squared =          52.66 using 59 PHA bins.
# Reduced chi-squared =         0.9404 for     56 degrees of freedom
# Null hypothesis probability =   6.018992e-01

Photon flux (15-150 keV)    in 1 sec: 8.19379E-03 ( -0.00819379  0.140468 ) ph/cm2/s
Energy fluence (15-150 keV)             : 4.51164e-20 ( 0  0 ) ergs/cm2
Band function

Time interval is from    8.252 sec. to    9.252 sec.

Spectral model in the Band function:
------------------------------------------------------------
Parameters  : value       lower 90%   higher 90%
alpha       : -9.81322   ( 9.81322   9.81322 )
beta        : -10.0000    ( 10   10 )
Epeak [keV] : 14.7041      ( -14.7041 -14.7041 )
Norm@50keV   : 1.34059E-05    (     )
------------------------------------------------------------
#Fit statistic : Chi-Squared =          52.68 using 59 PHA bins.
# Reduced chi-squared =         0.9579 for     55 degrees of freedom
# Null hypothesis probability =   5.635919e-01

Photon flux (15-150 keV)    in 1 sec:  (    ) ph/cm2/s
Energy fluence (15-150 keV)             : 0 ( 0  0 ) ergs/cm2
Single BB
Spectral model blackbody:
------------------------------------------------------------
Parameters  : value    Lower 90%  Upper 90%
kT [keV]    : 0.760385  (-10.6951  -10.6951)
R^2/D10^2   : 1.62919E+07  (-1.79629e+07   -1.79629e+07)
(R is the radius in km and D10 is the distance to the source in units of 10 kpc)
------------------------------------------------------------
#Fit statistic : Chi-Squared =          52.44 using 59 PHA bins.
# Reduced chi-squared =         0.9199 for     57 degrees of freedom
# Null hypothesis probability =   6.467412e-01

Energy  Fluence     90% Error
[keV]   [erg/cm2]   [erg/cm2]
15- 25  5.821e-10   6.145e-10
25- 50  1.587e-09   2.150e-09
50-150  1.003e-09   1.297e-09
15-150  3.172e-09   2.945e-09
Thermal bremsstrahlung (OTTB)

Spectral model: thermal bremsstrahlung
------------------------------------------------------------
Parameters  : value         Lower 90%    Upper 90%
kT [keV]    : 0.928627       (-0.921843      -0.921843)
Norm        : 3.15821E+06       (-3.863e+06     -3.863e+06)
------------------------------------------------------------
#Fit statistic : Chi-Squared =          52.44 using 59 PHA bins.
# Reduced chi-squared =         0.9199 for     57 degrees of freedom
# Null hypothesis probability =   6.467187e-01

Energy  Fluence     90% Error
[keV]   [erg/cm2]   [erg/cm2]
15- 25  6.621e-10   1.468e-10
25- 50  1.320e-12   4.568e-14
50-150  3.004e-19   2.622e-20
15-150  6.634e-10   1.713e-10
Double BB

------------------------------------------------------------
#Fit statistic : Chi-Squared =          52.20 using 59 PHA bins.
#Fit statistic : Chi-Squared =          52.06 using 59 PHA bins.
#Fit statistic : Chi-Squared =          52.00 using 59 PHA bins.
#Fit statistic : Chi-Squared =          51.98 using 59 PHA bins.
# Reduced chi-squared =         0.9492 for     55 degrees of freedom
# Reduced chi-squared =         0.9465 for     55 degrees of freedom
# Reduced chi-squared =         0.9454 for     55 degrees of freedom
# Reduced chi-squared =         0.9451 for     55 degrees of freedom
# Null hypothesis probability =   5.821061e-01
# Null hypothesis probability =   5.878317e-01
# Null hypothesis probability =   5.900282e-01
# Null hypothesis probability =   5.907645e-01

Energy  Fluence     90% Error
[keV]   [erg/cm2]   [erg/cm2]
15- 25  9.332e-10   3.877e-10
25- 50  1.175e-09   8.590e-10
50-150  9.474e-10   1.693e-09
15-150  3.055e-09   3.258e-09
Pre-slew spectrum (Pre-slew PHA with pre-slew DRM)
Power-law model

Spectral model in power-law:
------------------------------------------------------------
Parameters  : value       lower 90%   higher 90%
Photon index: 2.05392     ( -0.393319   0.453088 )
Norm@50keV  : 4.22780E-04    ( -0.000124944   0.000118021 )
------------------------------------------------------------
#Fit statistic : Chi-Squared =          41.52 using 59 PHA bins.
# Reduced chi-squared =         0.7285 for     57 degrees of freedom
# Null hypothesis probability =   9.385169e-01

Photon flux (15-150 keV)    in 96 sec: 6.50415E-02 ( -0.0131122  0.0131132 ) ph/cm2/s
Energy fluence (15-150 keV)             : 3.75592e-07 ( -9.65933e-08  1.02045e-07 ) ergs/cm2
Cutoff power-law model
Spectral model in the cutoff power-law:
------------------------------------------------------------
Parameters  : value       lower 90%   higher 90%
Photon index: 2.07142     (     )
Epeak [keV] : 139.754      (   )
Norm@50keV  : 4.11897E-04    (     )
------------------------------------------------------------
#Fit statistic : Chi-Squared =          41.52 using 59 PHA bins.
# Reduced chi-squared =         0.7414 for     56 degrees of freedom
# Null hypothesis probability =   9.255615e-01

Photon flux (15-150 keV)    in 96 sec: 6.50222E-02 ( -0.0131175  0.0130775 ) ph/cm2/s
Energy fluence (15-150 keV)             : 3.75056e-07 ( -1.07346e-07  7.73962e-08 ) ergs/cm2
Band function

Spectral model in the Band function:
------------------------------------------------------------
Parameters  : value       lower 90%   higher 90%
alpha       : -1.71422   ( 1.71566   1.71566 )
beta        : -2.05290    ( 2.05347   0.393231 )
Epeak [keV] : 12.5239      ( -11.9154 -11.9154 )
Norm@50keV   : 8.95323E-04    ( -0.000546283   0.0726035 )
------------------------------------------------------------
#Fit statistic : Chi-Squared =          41.52 using 59 PHA bins.
# Reduced chi-squared =         0.7550 for     55 degrees of freedom
# Null hypothesis probability =   9.103668e-01

Photon flux (15-150 keV)    in 96 sec:  (    ) ph/cm2/s
Energy fluence (15-150 keV)             : 0 ( 0  0 ) ergs/cm2
S(25-50 keV) vs. S(50-100 keV) plot

S(25-50 keV)  = 1.15e-07
S(50-100 keV) = 1.11e-07
T90 vs. Hardness ratio plot
T90                                   = 96 sec.
Hardness ratio (energy fluence ratio) = 0.965217
Color vs. Color plot

Count Ratio  (25-50 keV) / (15-25 keV) = 1.0286
Count Ratio (50-100 keV) / (15-25 keV) = 0.524464
Mask shadow pattern
IMX = -0.401323066356, IMY = -0.242564705896
TIME vs. PHA plot around the trigger time

Blue+Cyan dotted lines: Time interval of the scaled map
From 0.000000 to 4.096000
TIME vs. DetID plot around the trigger time

Blue+Cyan dotted lines: Time interval of the scaled map
From 0.000000 to 4.096000
100 us light curve (15-350 keV)

Blue+Cyan dotted lines: Time interval of the scaled map
From 0.000000 to 4.096000
Spacecraft aspect plot

Bright source in the pre-burst/pre-slew/post-slew images
Pre-burst image of 15-350 keV band
Time interval of the image:
-90.747400 -63.248000

# RAcent  DECcent POSerr Theta    Phi  PeakCts   SNR AngSep     Name
#  [deg]    [deg]    ['] [deg]  [deg]                   [']
313.3389 -19.0665    2.2  40.9  113.2   0.9922   5.3 ------	UNKNOWN
 15.9772  -1.9235    3.0  31.4 -121.0   0.2349   3.9 ------	UNKNOWN
  4.4140  28.0471    2.3  56.2 -151.5   1.0963   5.1 ------	UNKNOWN
Pre-slew background subtracted image of 15-350 keV band
Time interval of the image:
-63.248000 32.752000

# RAcent  DECcent POSerr Theta    Phi  PeakCts   SNR AngSep     Name
#  [deg]    [deg]    ['] [deg]  [deg]                   [']
340.8480 -68.0528    2.2  41.5   29.9   1.7879   5.2 ------	UNKNOWN
333.2556 -41.9486    2.4  24.1   68.3   1.0568   4.7 ------	UNKNOWN
Post-slew image of 15-350 keV band
Time interval of the image:
97.852600 274.852600

# RAcent  DECcent POSerr Theta    Phi  PeakCts   SNR AngSep     Name
#  [deg]    [deg]    ['] [deg]  [deg]                   [']
326.0490  38.2929    6.8  50.3 -170.1   0.5268   1.7    6.0	Cyg X-2
307.2726 -30.6007    2.8  34.1   71.5   1.1758   4.2 ------	UNKNOWN
345.1280 -43.2068    2.7  33.0   10.8   0.7012   4.3 ------	UNKNOWN
331.3574  48.2172    3.0  59.4 -163.2   3.4898   3.9 ------	UNKNOWN
 29.8313 -44.0363    2.3  55.9  -22.2   2.1923   5.0 ------	UNKNOWN
Plot creation:
Wed Nov 25 17:02:59 EST 2015