Special notes of this burst
Image
Pre-slew 15.0-350.0 keV image (Event data)
#   RAcent    DECcent   POSerr    Theta     Phi              Peak Cts       SNR   Name
   42.0409    14.7513   0.0078    40.8451   -42.2657         2.7397407     24.593 TRIG_00213934

Foreground time interval of the image:
 -0.756  37.096 (delta_t =  37.852 [sec])
Background time interval of the image:
-239.376  -0.756 (delta_t = 238.620 [sec])
Lightcurves
Notes:
- 1) The mask-weighted light curves are using the flight position.
- 2) Multiple plots of different time binning/intervals are shown to cover all scenarios of short/long GRBs, rate/image triggers, and real/false positives.
- 3) For all the mask-weighted lightcurves, the y-axis units are counts/sec/det where a det is 0.4 x 0.4 = 0.16 sq cm.
- 4) The verticle lines correspond to following: green dotted lines are T50 interval, black dotted lines are T90 interval, blue solid line(s) is a spacecraft slew start time, and orange solid line(s) is a spacecraft slew end time.
- 5) Time of each bin is in the middle of the bin.
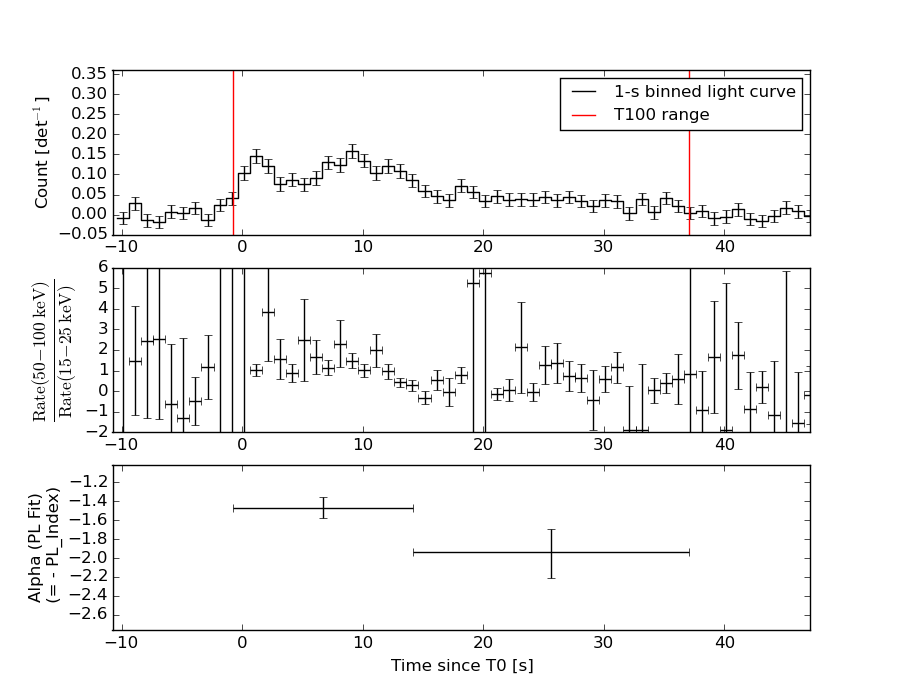
1 s binning
From T0-310 s to T0+310 s
From T100_start - 20 s to T100_end + 30 s
Full time interval
64 ms binning
Full time interval
From T100_start to T100_end
From T0-5 sec to T0+5 sec
16 ms binning
From T100_start-5 s to T100_start+5 s
Blue+Cyan dotted lines: Time interval of the scaled map
From 0.000000 to 1.024000
8 ms binning
From T100_start-3 s to T100_start+3 s
Blue+Cyan dotted lines: Time interval of the scaled map
From 0.000000 to 1.024000
2 ms binning
From T100_start-1 s to T100_start+1 s
Blue+Cyan dotted lines: Time interval of the scaled map
From 0.000000 to 1.024000
SN=5 or 10 sec. binning (whichever binning is satisfied first)
SN=5 or 10 sec. binning (T < 200 sec)
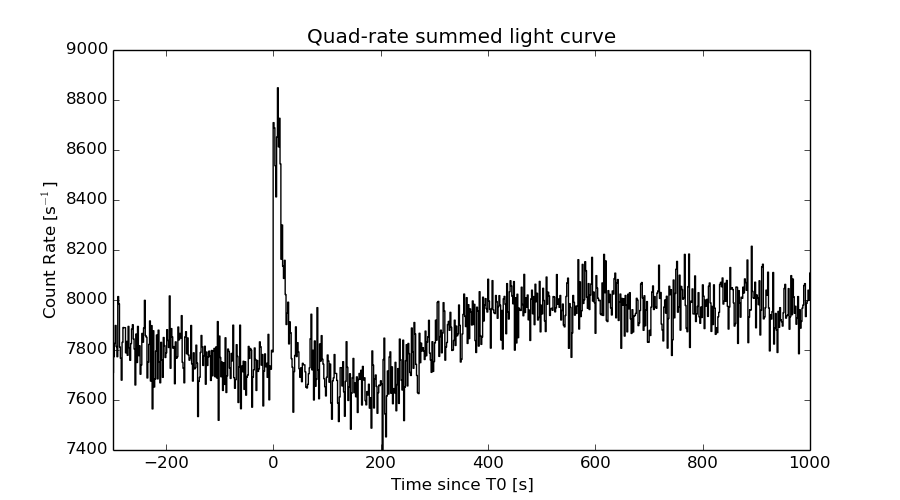
Quad-rate summed light curves (from T0-300s to T0+1000s)
Spectral Evolution
Spectra
Notes:
- 1) The fitting includes the systematic errors.
- 2) When the burst includes telescope slew time periods, the fitting uses an average response file made from multiple 5-s response files through out the slew time plus single time preiod for the non-slew times, and weighted by the total counts in the corresponding time period using addrmf. An average response file is needed becuase a spectral fit using the pre-slew DRM will introduce some errors in both a spectral shape and a normalization if the PHA file contains a lot of the slew/post-slew time interval.
- 3) For fits to more complicated models (e.g. a power-law over a cutoff power-law), the BAT team has decided to require a chi-square improvement of more than 6 for each extra dof.
Time averaged spectrum fit using the average DRM
Power-law model

Time interval is from   -0.756 sec. to   37.096 sec.

Spectral model in power-law:
------------------------------------------------------------
Parameters  : value       lower 90%   higher 90%
Photon index: 1.62314     ( -0.115142   0.116286 )
Norm@50keV  : 4.68594E-03    ( -0.000312567   0.000311 )
------------------------------------------------------------
#Fit statistic : Chi-Squared =          55.23 using 59 PHA bins.
# Reduced chi-squared =         0.9689 for     57 degrees of freedom
# Null hypothesis probability =   5.418840e-01

Photon flux (15-150 keV)    in 37.85 sec: 0.606562 ( -0.040217  0.0402835 ) ph/cm2/s
Energy fluence (15-150 keV)             : 1.65425e-06 ( -1.17491e-07  1.18145e-07 ) ergs/cm2
Cutoff power-law model
Time interval is from   -0.756 sec. to   37.096 sec.
Spectral model in the cutoff power-law:
------------------------------------------------------------
Parameters  : value       lower 90%   higher 90%
Photon index: 1.51887     ( -0.436629   0.209876 )
Epeak [keV] : 229.629      ( -229.629 -229.629 )
Norm@50keV  : 5.29553E-03    ( -0.00128876   0.00341516 )
------------------------------------------------------------
#Fit statistic : Chi-Squared =          55.04 using 59 PHA bins.
# Reduced chi-squared =         0.9828 for     56 degrees of freedom
# Null hypothesis probability =   5.113657e-01

Photon flux (15-150 keV)    in 37.85 sec: 0.603414 ( -0.041889  0.041795 ) ph/cm2/s
Energy fluence (15-150 keV)             : 1.64207e-06 ( -6.43791e-08  1.26964e-07 ) ergs/cm2
Band function

Time interval is from   -0.756 sec. to   37.096 sec.

Spectral model in the Band function:
------------------------------------------------------------
Parameters  : value       lower 90%   higher 90%
alpha       : 2.76266   ( -2.76241   -2.76241 )
beta        : -1.68448    ( -0.15808   0.13942 )
Epeak [keV] : 25.4498      ( -25.4478 98.3416 )
Norm@50keV   : 11.0658    ( -11.0526   275.854 )
------------------------------------------------------------
#Fit statistic : Chi-Squared =          53.88 using 59 PHA bins.
# Reduced chi-squared =         0.9796 for     55 degrees of freedom
# Null hypothesis probability =   5.174809e-01

Photon flux (15-150 keV)    in 37.85 sec: 0.598315 ( 6.40168  -0.042317 ) ph/cm2/s
Energy fluence (15-150 keV)             : 0 ( 0  0 ) ergs/cm2
Single BB
Spectral model blackbody:
------------------------------------------------------------
Parameters  : value    Lower 90%  Upper 90%
kT [keV]    : 13.8970  (  )
R^2/D10^2   : 8.54357E-02  (   )
(R is the radius in km and D10 is the distance to the source in units of 10 kpc)
------------------------------------------------------------
#Fit statistic : Chi-Squared =         125.94 using 59 PHA bins.
# Reduced chi-squared =         2.2095 for     57 degrees of freedom
# Null hypothesis probability =   4.077301e-07

Energy  Fluence     90% Error
[keV]   [erg/cm2]   [erg/cm2]
15- 25  1.320e-07   1.652e-08
25- 50  4.874e-07   4.466e-08
50-150  6.174e-07   8.895e-08
15-150  1.237e-06   9.538e-08
Thermal bremsstrahlung (OTTB)
Spectral model: thermal bremsstrahlung
------------------------------------------------------------
Parameters  : value         Lower 90%    Upper 90%
kT [keV]    : 172.989       (-48.2674      -172.324)
Norm        : 2.46426       (-0.175289     0.197869)
------------------------------------------------------------
#Fit statistic : Chi-Squared =          55.93 using 59 PHA bins.
# Reduced chi-squared =         0.9812 for     57 degrees of freedom
# Null hypothesis probability =   5.152648e-01

Energy  Fluence     90% Error
[keV]   [erg/cm2]   [erg/cm2]
15- 25  2.363e-07   2.174e-08
25- 50  4.466e-07   7.689e-08
50-150  9.321e-07   3.741e-07
15-150  1.615e-06   5.344e-07
Double BB
Spectral model: bbodyrad<1> + bbodyrad<2>
------------------------------------------------------------
Parameters  : value         Lower 90%    Upper 90%
kT1 [keV]   : 6.96187        (-1.09317      1.21265)
R1^2/D10^2  : 0.732605        (-0.313199      0.624662)
kT2 [keV]   : 28.3807        (-5.25378      8.6628)
R2^2/D10^2  : 5.33202E-03    (-0.00312816   0.00577586)
------------------------------------------------------------
#Fit statistic : Chi-Squared =          52.05 using 59 PHA bins.
# Reduced chi-squared =         0.9463 for     55 degrees of freedom
# Null hypothesis probability =   5.881942e-01

Energy  Fluence     90% Error
[keV]   [erg/cm2]   [erg/cm2]
15- 25  2.410e-07   4.391e-08
25- 50  4.493e-07   7.937e-08
50-150  9.665e-07   3.090e-07
15-150  1.657e-06   4.296e-07
Peak spectrum fit
Power-law model
Time interval is from    8.640 sec. to    9.640 sec.

Spectral model in power-law:
------------------------------------------------------------
Parameters  : value       lower 90%   higher 90%
Photon index: 1.37694     ( -0.270636   0.273358 )
Norm@50keV  : 1.21225E-02    ( -0.00196005   0.00195783 )
------------------------------------------------------------
#Fit statistic : Chi-Squared =          67.73 using 59 PHA bins.
# Reduced chi-squared =          1.188 for     57 degrees of freedom
# Null hypothesis probability =   1.562446e-01

Photon flux (15-150 keV)    in 1 sec: 1.46876 ( -0.244946  0.245908 ) ph/cm2/s
Energy fluence (15-150 keV)             : 1.17702e-07 ( -2.06001e-08  2.07743e-08 ) ergs/cm2
Cutoff power-law model

Time interval is from    8.640 sec. to    9.640 sec.
Spectral model in the cutoff power-law:
------------------------------------------------------------
Parameters  : value       lower 90%   higher 90%
Photon index: 0.529962     ( -1.4326   0.962505 )
Epeak [keV] : 98.9576      ( -32.1248 -99.065 )
Norm@50keV  : 2.91104E-02    ( -0.0180573   0.0838066 )
------------------------------------------------------------
#Fit statistic : Chi-Squared =          65.97 using 59 PHA bins.
# Reduced chi-squared =          1.178 for     56 degrees of freedom
# Null hypothesis probability =   1.701439e-01

Photon flux (15-150 keV)    in 1 sec: 1.41307 ( -0.25813  0.25706 ) ph/cm2/s
Energy fluence (15-150 keV)             : 1.14711e-07 ( -2.10698e-08  2.1286e-08 ) ergs/cm2
Band function
Time interval is from    8.640 sec. to    9.640 sec.

Spectral model in the Band function:
------------------------------------------------------------
Parameters  : value       lower 90%   higher 90%
alpha       : -0.535002   ( -0.720171   1.49212 )
beta        : -10.0000    ( 10   5.32907e-15 )
Epeak [keV] : 99.1657      ( -32.2636 -99.1674 )
Norm@50keV   : 2.89743E-02    ( -0.0179766   0.0841106 )
------------------------------------------------------------
#Fit statistic : Chi-Squared =          65.97 using 59 PHA bins.
# Reduced chi-squared =          1.199 for     55 degrees of freedom
# Null hypothesis probability =   1.477205e-01

Photon flux (15-150 keV)    in 1 sec: 1.43308 ( 5.56692  -0.23783 ) ph/cm2/s
Energy fluence (15-150 keV)             : 1.14933e-07 ( -1.14926e-07  -2.10255e-08 ) ergs/cm2
Single BB
Spectral model blackbody:
------------------------------------------------------------
Parameters  : value    Lower 90%  Upper 90%
kT [keV]    : 18.9892  (-3.20301  3.95625)
R^2/D10^2   : 7.94388E-02  (-0.0377829   0.0693298)
(R is the radius in km and D10 is the distance to the source in units of 10 kpc)
------------------------------------------------------------
#Fit statistic : Chi-Squared =          70.15 using 59 PHA bins.
# Reduced chi-squared =          1.231 for     57 degrees of freedom
# Null hypothesis probability =   1.132388e-01

Energy  Fluence     90% Error
[keV]   [erg/cm2]   [erg/cm2]
15- 25  5.632e-09   1.961e-09
25- 50  2.708e-08   7.330e-09
50-150  7.174e-08   2.225e-08
15-150  1.044e-07   2.423e-08
Thermal bremsstrahlung (OTTB)
Spectral model: thermal bremsstrahlung
------------------------------------------------------------
Parameters  : value         Lower 90%    Upper 90%
kT [keV]    : 200.000       (      )
Norm        : 6.12512       (-0.989106     0.989013)
------------------------------------------------------------
#Fit statistic : Chi-Squared =          68.27 using 59 PHA bins.
# Reduced chi-squared =          1.198 for     57 degrees of freedom
# Null hypothesis probability =   1.458501e-01

Energy  Fluence     90% Error
[keV]   [erg/cm2]   [erg/cm2]
15- 25  1.525e-08   8.805e-09
25- 50  2.934e-08   1.649e-08
50-150  6.435e-08   3.609e-08
15-150  1.090e-07   6.135e-08
Double BB
Spectral model: bbodyrad<1> + bbodyrad<2>
------------------------------------------------------------
Parameters  : value         Lower 90%    Upper 90%
kT1 [keV]   : 3.83122        (-1.97659      2.56255)
R1^2/D10^2  : 13.5064        (-12.709      1178.37)
kT2 [keV]   : 21.8855        (-4.11821      6.06095)
R2^2/D10^2  : 4.57822E-02    (-0.0265005   0.0378184)
------------------------------------------------------------
#Fit statistic : Chi-Squared =          62.46 using 59 PHA bins.
# Reduced chi-squared =          1.136 for     55 degrees of freedom
# Null hypothesis probability =   2.284277e-01

Energy  Fluence     90% Error
[keV]   [erg/cm2]   [erg/cm2]
15- 25  1.400e-08   7.368e-09
25- 50  2.461e-08   9.146e-09
50-150  7.676e-08   3.439e-08
15-150  1.154e-07   4.121e-08
Pre-slew spectrum (Pre-slew PHA with pre-slew DRM)
Power-law model
Spectral model in power-law:
------------------------------------------------------------
Parameters  : value       lower 90%   higher 90%
Photon index: 1.62314     ( -0.115142   0.116286 )
Norm@50keV  : 4.68594E-03    ( -0.000312567   0.000311 )
------------------------------------------------------------
#Fit statistic : Chi-Squared =          55.23 using 59 PHA bins.
# Reduced chi-squared =         0.9689 for     57 degrees of freedom
# Null hypothesis probability =   5.418840e-01

Photon flux (15-150 keV)    in 37.85 sec: 0.606562 ( -0.040217  0.0402835 ) ph/cm2/s
Energy fluence (15-150 keV)             : 1.65425e-06 ( -1.17491e-07  1.18145e-07 ) ergs/cm2
Cutoff power-law model

Spectral model in the cutoff power-law:
------------------------------------------------------------
Parameters  : value       lower 90%   higher 90%
Photon index: 1.51887     ( -0.436629   0.209864 )
Epeak [keV] : 229.629      ( -229.629 -229.629 )
Norm@50keV  : 5.29553E-03    ( -0.00128876   0.00341516 )
------------------------------------------------------------
#Fit statistic : Chi-Squared =          55.04 using 59 PHA bins.
# Reduced chi-squared =         0.9828 for     56 degrees of freedom
# Null hypothesis probability =   5.113657e-01

Photon flux (15-150 keV)    in 37.85 sec: 0.603414 ( -0.041889  0.041795 ) ph/cm2/s
Energy fluence (15-150 keV)             : 1.64207e-06 ( -6.43791e-08  1.26964e-07 ) ergs/cm2
Band function
Spectral model in the Band function:
------------------------------------------------------------
Parameters  : value       lower 90%   higher 90%
alpha       : 2.76266   ( -2.76241   -2.76241 )
beta        : -1.68448    ( -0.15808   0.13942 )
Epeak [keV] : 25.4498      ( -25.4478 95.5754 )
Norm@50keV   : 11.0658    ( -11.0526   275.86 )
------------------------------------------------------------
#Fit statistic : Chi-Squared =          53.88 using 59 PHA bins.
# Reduced chi-squared =         0.9796 for     55 degrees of freedom
# Null hypothesis probability =   5.174809e-01

Photon flux (15-150 keV)    in 37.85 sec: 0.598315 ( 6.40168  -0.042317 ) ph/cm2/s
Energy fluence (15-150 keV)             : 0 ( 0  0 ) ergs/cm2
S(25-50 keV) vs. S(50-100 keV) plot
S(25-50 keV)  = 4.33e-07
S(50-100 keV) = 5.63e-07
T90 vs. Hardness ratio plot
T90                                   = 31.5839999914169 sec.
Hardness ratio (energy fluence ratio) = 1.30023
Color vs. Color plot
Count Ratio  (25-50 keV) / (15-25 keV) = 1.41464
Count Ratio (50-100 keV) / (15-25 keV) = 1.05882
Mask shadow pattern
IMX = 6.397969315378035E-01, IMY = 5.814696975838327E-01
TIME vs. PHA plot around the trigger time
Blue+Cyan dotted lines: Time interval of the scaled map
From 0.000000 to 1.024000
TIME vs. DetID plot around the trigger time
Blue+Cyan dotted lines: Time interval of the scaled map
From 0.000000 to 1.024000
100 us light curve (15-350 keV)
Blue+Cyan dotted lines: Time interval of the scaled map
From 0.000000 to 1.024000
Spacecraft aspect plot
Bright source in the pre-burst/pre-slew/post-slew images
Pre-burst image of 15-350 keV band
Time interval of the image:
-239.376000 -0.756000

# RAcent  DECcent POSerr Theta    Phi  PeakCts   SNR AngSep     Name
#  [deg]    [deg]    ['] [deg]  [deg]                   [']
326.1747  38.3672    5.3  32.4  105.1   0.6584   2.2    2.7	Cyg X-2
  1.8166  -5.1477    2.3  50.3   20.6   2.6963   5.0  327.5	UNKNOWN
 19.2680   0.2904    3.0  45.3   -3.2   1.1075   3.9 ------	UNKNOWN
212.9160  76.0105    3.0  58.3 -175.5   3.7405   3.8 ------	UNKNOWN
Pre-slew background subtracted image of 15-350 keV band
Time interval of the image:
-0.756000 37.096000

# RAcent  DECcent POSerr Theta    Phi  PeakCts   SNR AngSep     Name
#  [deg]    [deg]    ['] [deg]  [deg]                   [']
326.3373  38.3967    7.5  32.3  105.0  -0.1736  -1.5    9.0	Cyg X-2
 42.0408  14.7512    0.5  40.8  -42.3   2.7401  24.6 ------	UNKNOWN
Post-slew image of 15-350 keV band
Time interval of the image:
376.024600 962.687300

# RAcent  DECcent POSerr Theta    Phi  PeakCts   SNR AngSep     Name
#  [deg]    [deg]    ['] [deg]  [deg]                   [']
135.5667 -40.5447    1.5  42.9  165.9   5.1313   7.6    1.8	Vela X-1
110.4684 -29.6773    2.4  47.9 -162.1   2.9952   4.8 ------	UNKNOWN
Plot creation:
Sun May 31 12:48:22 EDT 2015