Special notes of this burst
Image
Pre-slew 15.0-350.0 keV image (Event data)
#   RAcent    DECcent   POSerr    Theta     Phi              Peak Cts       SNR   Name
  320.8752   -53.0261   0.0055    44.1310    34.1709         7.4414648     35.163 TRIG_00214805

Foreground time interval of the image:
 -1.496  14.941 (delta_t =  16.437 [sec])
Background time interval of the image:
-239.760  -1.496 (delta_t = 238.264 [sec])
Lightcurves
Notes:
- 1) The mask-weighted light curves are using the flight position.
- 2) Multiple plots of different time binning/intervals are shown to cover all scenarios of short/long GRBs, rate/image triggers, and real/false positives.
- 3) For all the mask-weighted lightcurves, the y-axis units are counts/sec/det where a det is 0.4 x 0.4 = 0.16 sq cm.
- 4) The verticle lines correspond to following: green dotted lines are T50 interval, black dotted lines are T90 interval, blue solid line(s) is a spacecraft slew start time, and orange solid line(s) is a spacecraft slew end time.
- 5) Time of each bin is in the middle of the bin.
1 s binning
From T0-310 s to T0+310 s
From T100_start - 20 s to T100_end + 30 s

Full time interval

64 ms binning
Full time interval

From T100_start to T100_end

From T0-5 sec to T0+5 sec

16 ms binning
From T100_start-5 s to T100_start+5 s
Blue+Cyan dotted lines: Time interval of the scaled map
From 0.000000 to 1.024000
8 ms binning
From T100_start-3 s to T100_start+3 s
Blue+Cyan dotted lines: Time interval of the scaled map
From 0.000000 to 1.024000
2 ms binning
From T100_start-1 s to T100_start+1 s
Blue+Cyan dotted lines: Time interval of the scaled map
From 0.000000 to 1.024000
SN=5 or 10 sec. binning (whichever binning is satisfied first)
SN=5 or 10 sec. binning (T < 200 sec)

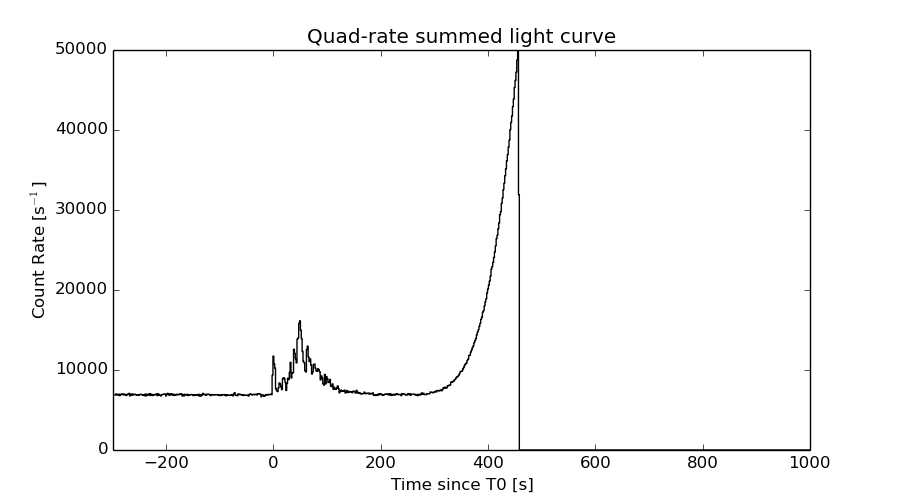
Quad-rate summed light curves (from T0-300s to T0+1000s)
Spectral Evolution

Spectra
Notes:
- 1) The fitting includes the systematic errors.
- 2) When the burst includes telescope slew time periods, the fitting uses an average response file made from multiple 5-s response files through out the slew time plus single time preiod for the non-slew times, and weighted by the total counts in the corresponding time period using addrmf. An average response file is needed becuase a spectral fit using the pre-slew DRM will introduce some errors in both a spectral shape and a normalization if the PHA file contains a lot of the slew/post-slew time interval.
- 3) For fits to more complicated models (e.g. a power-law over a cutoff power-law), the BAT team has decided to require a chi-square improvement of more than 6 for each extra dof.
Time averaged spectrum fit using the average DRM
Power-law model

Time interval is from   -1.496 sec. to  179.080 sec.

Spectral model in power-law:
------------------------------------------------------------
Parameters  : value       lower 90%   higher 90%
Photon index: 2.03655     ( -0.0365574   0.0367046 )
Norm@50keV  : 1.24314E-02    ( -0.000209102   0.000209085 )
------------------------------------------------------------
#Fit statistic : Chi-Squared =          48.38 using 59 PHA bins.
# Reduced chi-squared =         0.8488 for     57 degrees of freedom
# Null hypothesis probability =   7.848226e-01

Photon flux (15-150 keV)    in 180.6 sec: 1.89674 ( -0.0445293  0.0449315 ) ph/cm2/s
Energy fluence (15-150 keV)             : 2.075e-05 ( -3.50564e-07  3.50666e-07 ) ergs/cm2
Cutoff power-law model

Time interval is from   -1.496 sec. to  179.080 sec.
Spectral model in the cutoff power-law:
------------------------------------------------------------
Parameters  : value       lower 90%   higher 90%
Photon index: 2.33949     (     )
Epeak [keV] : 136.389      (   )
Norm@50keV  : 9.42767E-03    ( -0.0008223   0.00112772 )
------------------------------------------------------------
#Fit statistic : Chi-Squared =          34.01 using 59 PHA bins.
# Reduced chi-squared =         0.6073 for     56 degrees of freedom
# Null hypothesis probability =   9.911389e-01

Photon flux (15-150 keV)    in 180.6 sec: 1.89497 ( -0.04445  0.04494 ) ph/cm2/s
Energy fluence (15-150 keV)             : 2.07462e-05 ( -3.48558e-07  3.50183e-07 ) ergs/cm2
Band function

Time interval is from   -1.496 sec. to  179.080 sec.

Spectral model in the Band function:
------------------------------------------------------------
Parameters  : value       lower 90%   higher 90%
alpha       : -1.64038   ( 1.64061   1.64061 )
beta        : -2.03654    ( -0.0367111   0.0365708 )
Epeak [keV] : 13.7029      ( -13.5983 9979.93 )
Norm@50keV   : 2.96907E-02    ( -0.0106689   0.767442 )
------------------------------------------------------------
#Fit statistic : Chi-Squared =          48.38 using 59 PHA bins.
# Reduced chi-squared =         0.8797 for     55 degrees of freedom
# Null hypothesis probability =   7.237279e-01

Photon flux (15-150 keV)    in 180.6 sec:  (    ) ph/cm2/s
Energy fluence (15-150 keV)             : 0 ( 0  0 ) ergs/cm2
Single BB

Spectral model blackbody:
------------------------------------------------------------
Parameters  : value    Lower 90%  Upper 90%
kT [keV]    : 14.0770  (  )
R^2/D10^2   : 0.202607  (   )
(R is the radius in km and D10 is the distance to the source in units of 10 kpc)
------------------------------------------------------------
#Fit statistic : Chi-Squared =        1143.74 using 59 PHA bins.
# Reduced chi-squared =        20.0656 for     57 degrees of freedom
# Null hypothesis probability =  5.347762e-202

Energy  Fluence     90% Error
[keV]   [erg/cm2]   [erg/cm2]
15- 25  1.531e-06   6.059e-08
25- 50  5.725e-06   1.535e-07
50-150  7.491e-06   2.185e-07
15-150  1.475e-05   2.628e-07
Thermal bremsstrahlung (OTTB)

Spectral model: thermal bremsstrahlung
------------------------------------------------------------
Parameters  : value         Lower 90%    Upper 90%
kT [keV]    : 89.3657       (      )
Norm        : 7.82999       (     )
------------------------------------------------------------
#Fit statistic : Chi-Squared =         169.05 using 59 PHA bins.
# Reduced chi-squared =         2.9658 for     57 degrees of freedom
# Null hypothesis probability =   4.917095e-13

Energy  Fluence     90% Error
[keV]   [erg/cm2]   [erg/cm2]
15- 25  3.689e-06   1.219e-07
25- 50  6.230e-06   1.409e-07
50-150  9.445e-06   2.727e-07
15-150  1.936e-05   3.431e-07
Double BB

Spectral model: bbodyrad<1> + bbodyrad<2>
------------------------------------------------------------
Parameters  : value         Lower 90%    Upper 90%
kT1 [keV]   : 6.62376        (-0.321855      0.335666)
R1^2/D10^2  : 3.14213        (-0.585075      0.747854)
kT2 [keV]   : 26.3142        (-1.46878      1.68556)
R2^2/D10^2  : 1.47963E-02    (-0.00305635   0.00361251)
------------------------------------------------------------
#Fit statistic : Chi-Squared =          62.65 using 59 PHA bins.
# Reduced chi-squared =          1.139 for     55 degrees of freedom
# Null hypothesis probability =   2.233958e-01

Energy  Fluence     90% Error
[keV]   [erg/cm2]   [erg/cm2]
15- 25  4.076e-06   2.456e-07
25- 50  6.438e-06   1.851e-07
50-150  9.880e-06   3.431e-07
15-150  2.039e-05   5.328e-07
Peak spectrum fit
Power-law model

Time interval is from   -1.324 sec. to   -0.324 sec.

Spectral model in power-law:
------------------------------------------------------------
Parameters  : value       lower 90%   higher 90%
Photon index: 1.59796     ( -0.10219   0.10353 )
Norm@50keV  : 8.94811E-02    ( -0.00544234   0.00542329 )
------------------------------------------------------------
#Fit statistic : Chi-Squared =          52.44 using 59 PHA bins.
# Reduced chi-squared =         0.9201 for     57 degrees of freedom
# Null hypothesis probability =   6.464515e-01

Photon flux (15-150 keV)    in 1 sec: 11.4915 ( -0.703693  0.704726 ) ph/cm2/s
Energy fluence (15-150 keV)             : 8.37046e-07 ( -5.42344e-08  5.44242e-08 ) ergs/cm2
Cutoff power-law model

Time interval is from   -1.324 sec. to   -0.324 sec.
Spectral model in the cutoff power-law:
------------------------------------------------------------
Parameters  : value       lower 90%   higher 90%
Photon index: 1.38236     ( -0.429692   0.269352 )
Epeak [keV] : 147.865      ( -67.1244 -147.913 )
Norm@50keV  : 0.114519    ( -0.0292837   0.0705795 )
------------------------------------------------------------
#Fit statistic : Chi-Squared =          51.60 using 59 PHA bins.
# Reduced chi-squared =         0.9214 for     56 degrees of freedom
# Null hypothesis probability =   6.420733e-01

Photon flux (15-150 keV)    in 1 sec: 11.3863 ( -0.7279  0.7288 ) ph/cm2/s
Energy fluence (15-150 keV)             : 8.27797e-07 ( -5.7764e-08  5.7362e-08 ) ergs/cm2
Band function

Time interval is from   -1.324 sec. to   -0.324 sec.

Spectral model in the Band function:
------------------------------------------------------------
Parameters  : value       lower 90%   higher 90%
alpha       : -1.03648   ( 1.03595   1.03595 )
beta        : -1.72265    ( 1.72175   0.193762 )
Epeak [keV] : 69.9881      ( -68.5337 -68.5337 )
Norm@50keV   : 0.186370    ( -0.103324   0 )
------------------------------------------------------------
#Fit statistic : Chi-Squared =          51.00 using 59 PHA bins.
# Reduced chi-squared =         0.9274 for     55 degrees of freedom
# Null hypothesis probability =   6.279939e-01

Photon flux (15-150 keV)    in 1 sec:  (    ) ph/cm2/s
Energy fluence (15-150 keV)             : 8.25095e-07 ( 0  0 ) ergs/cm2
Single BB

Spectral model blackbody:
------------------------------------------------------------
Parameters  : value    Lower 90%  Upper 90%
kT [keV]    : 14.4986  (  )
R^2/D10^2   : 1.44452  (   )
(R is the radius in km and D10 is the distance to the source in units of 10 kpc)
------------------------------------------------------------
#Fit statistic : Chi-Squared =         121.34 using 59 PHA bins.
# Reduced chi-squared =         2.1288 for     57 degrees of freedom
# Null hypothesis probability =   1.501761e-06

Energy  Fluence     90% Error
[keV]   [erg/cm2]   [erg/cm2]
15- 25  6.389e-08   7.165e-09
25- 50  2.459e-07   1.785e-08
50-150  3.463e-07   3.780e-08
15-150  6.561e-07   4.340e-08
Thermal bremsstrahlung (OTTB)

Spectral model: thermal bremsstrahlung
------------------------------------------------------------
Parameters  : value         Lower 90%    Upper 90%
kT [keV]    : 187.749       (-49.1152      -187.749)
Norm        : 46.7590       (-2.91556     3.20959)
------------------------------------------------------------
#Fit statistic : Chi-Squared =          51.77 using 59 PHA bins.
# Reduced chi-squared =         0.9082 for     57 degrees of freedom
# Null hypothesis probability =   6.710107e-01

Energy  Fluence     90% Error
[keV]   [erg/cm2]   [erg/cm2]
15- 25  1.173e-07   1.000e-08
25- 50  2.241e-07   3.900e-08
50-150  4.816e-07   1.807e-07
15-150  8.230e-07   2.351e-07
Double BB

Spectral model: bbodyrad<1> + bbodyrad<2>
------------------------------------------------------------
Parameters  : value         Lower 90%    Upper 90%
kT1 [keV]   : 7.90025        (-1.63144      1.6628)
R1^2/D10^2  : 8.47723        (-3.74979      9.5623)
kT2 [keV]   : 29.4407        (-6.5473      13.6472)
R2^2/D10^2  : 8.56146E-02    (-0.0611723   0.135555)
------------------------------------------------------------
#Fit statistic : Chi-Squared =          55.59 using 59 PHA bins.
# Reduced chi-squared =          1.011 for     55 degrees of freedom
# Null hypothesis probability =   4.524147e-01

Energy  Fluence     90% Error
[keV]   [erg/cm2]   [erg/cm2]
15- 25  1.065e-07   1.992e-08
25- 50  2.342e-07   4.435e-08
50-150  4.841e-07   1.502e-07
15-150  8.248e-07   2.070e-07
Pre-slew spectrum (Pre-slew PHA with pre-slew DRM)
Power-law model

Spectral model in power-law:
------------------------------------------------------------
Parameters  : value       lower 90%   higher 90%
Photon index: 1.66688     ( -0.0628397   0.0632 )
Norm@50keV  : 3.06336E-02    ( -0.00102476   0.00102364 )
------------------------------------------------------------
#Fit statistic : Chi-Squared =          36.77 using 59 PHA bins.
# Reduced chi-squared =         0.6450 for     57 degrees of freedom
# Null hypothesis probability =   9.828737e-01

Photon flux (15-150 keV)    in 16.44 sec: 4.02254 ( -0.148959  0.14978 ) ph/cm2/s
Energy fluence (15-150 keV)             : 4.67618e-06 ( -1.62165e-07  1.6248e-07 ) ergs/cm2
Cutoff power-law model

Spectral model in the cutoff power-law:
------------------------------------------------------------
Parameters  : value       lower 90%   higher 90%
Photon index: 1.66796     ( -0.0653217   0.061706 )
Epeak [keV] : 9999.36      ( -9999.35 -9999.36 )
Norm@50keV  : 3.06415E-02    ( -0.00102455   0.00596577 )
------------------------------------------------------------
#Fit statistic : Chi-Squared =          36.79 using 59 PHA bins.
# Reduced chi-squared =         0.6570 for     56 degrees of freedom
# Null hypothesis probability =   9.779170e-01

Photon flux (15-150 keV)    in 16.44 sec: 4.02587 ( -0.15478  0.14439 ) ph/cm2/s
Energy fluence (15-150 keV)             : 4.67619e-06 ( -1.61622e-07  1.6948e-07 ) ergs/cm2
Band function

Spectral model in the Band function:
------------------------------------------------------------
Parameters  : value       lower 90%   higher 90%
alpha       : -1.24383   ( 1.24147   1.24147 )
beta        : -1.67041    ( -7.6222   0.0656165 )
Epeak [keV] : 42.3346      ( -41.8091 -41.8091 )
Norm@50keV   : 6.43753E-02    ( -0.0361572   0 )
------------------------------------------------------------
#Fit statistic : Chi-Squared =          36.69 using 59 PHA bins.
# Reduced chi-squared =         0.6671 for     55 degrees of freedom
# Null hypothesis probability =   9.727781e-01

Photon flux (15-150 keV)    in 16.44 sec:  (    ) ph/cm2/s
Energy fluence (15-150 keV)             : 0 ( 0  0 ) ergs/cm2
S(25-50 keV) vs. S(50-100 keV) plot

S(25-50 keV)  = 6.31e-06
S(50-100 keV) = 6.15e-06
T90 vs. Hardness ratio plot

T90                                   = 109.104000002146 sec.
Hardness ratio (energy fluence ratio) = 0.974643
Color vs. Color plot

Count Ratio  (25-50 keV) / (15-25 keV) = 0.951798
Count Ratio (50-100 keV) / (15-25 keV) = 0.521164
Mask shadow pattern

IMX = 8.026413408118448E-01, IMY = -5.448789100544709E-01
TIME vs. PHA plot around the trigger time

Blue+Cyan dotted lines: Time interval of the scaled map
From 0.000000 to 1.024000
TIME vs. DetID plot around the trigger time
Blue+Cyan dotted lines: Time interval of the scaled map
From 0.000000 to 1.024000
100 us light curve (15-350 keV)

Blue+Cyan dotted lines: Time interval of the scaled map
From 0.000000 to 1.024000
Spacecraft aspect plot

Bright source in the pre-burst/pre-slew/post-slew images
Pre-burst image of 15-350 keV band
Time interval of the image:
-239.760000 -1.496000

# RAcent  DECcent POSerr Theta    Phi  PeakCts   SNR AngSep     Name
#  [deg]    [deg]    ['] [deg]  [deg]                   [']
326.2800  38.3693    9.4  50.3 -171.2   0.4745   1.2    5.8	Cyg X-2
300.0699 -29.6653    2.8  39.4   76.0   2.4648   4.2 ------	UNKNOWN
 28.8172 -50.6670    2.8  57.8  -15.9   3.1134   4.1 ------	UNKNOWN
 29.8613 -28.4624    3.4  52.1  -42.2   3.0662   3.4 ------	UNKNOWN
Pre-slew background subtracted image of 15-350 keV band
Time interval of the image:
-1.496000 14.940590

# RAcent  DECcent POSerr Theta    Phi  PeakCts   SNR AngSep     Name
#  [deg]    [deg]    ['] [deg]  [deg]                   [']
326.2619  38.3674    8.9  50.3 -171.2  -0.1299  -1.3    5.1	Cyg X-2
297.0859  21.6184    3.6  51.1  149.6   0.7025   3.2 ------	UNKNOWN
320.8752 -53.0261    0.3  44.1   34.2   7.4416  35.2 ------	UNKNOWN
303.5568   4.8176    2.8  37.1  133.4   0.4816   4.1 ------	UNKNOWN
349.8328  32.6791    2.5  45.2 -145.0   0.3397   4.6 ------	UNKNOWN
  6.8129  23.4731    2.2  44.9 -120.1   0.8123   5.2 ------	UNKNOWN
Post-slew image of 15-350 keV band
Time interval of the image:
80.340590 482.320000

# RAcent  DECcent POSerr Theta    Phi  PeakCts   SNR AngSep     Name
#  [deg]    [deg]    ['] [deg]  [deg]                   [']
264.7984 -44.4279   13.8  36.9   69.3   1.9539   0.8    2.7	4U 1735-44
276.1027 -30.4229   15.0  39.4   96.1  -2.4561  -0.8    9.8	H1820-303
285.0043 -25.0440   10.3  38.7  111.2  -2.9865  -1.1    7.6	HT1900.1-2455
264.4403 -59.0110    2.6  31.1   45.3   5.4591   4.3 ------	UNKNOWN
217.8149 -71.2094    2.3  44.5   15.7   8.3265   5.0 ------	UNKNOWN
320.9232 -53.0304    1.6   0.1 -122.1   5.1790   7.2 ------	UNKNOWN
250.2160 -85.8225    4.1  35.7   -4.2   2.7881   2.9 ------	UNKNOWN
 47.5577 -83.2779    2.3  37.1  -22.1   4.9517   5.1 ------	UNKNOWN
 11.7357 -30.1810    2.2  43.2 -112.1  14.3766   5.2 ------	UNKNOWN
Plot creation:
Sun May 31 12:46:30 EDT 2015