Special notes of this burst
Image
Pre-slew 15.0-350.0 keV image (Event data)
#   RAcent    DECcent   POSerr    Theta     Phi              Peak Cts       SNR   Name
    7.8216   -33.7481   0.0064    18.5157   -12.0979         0.8527661     30.052 TRIG_00217805

Foreground time interval of the image:
 -0.260  10.181 (delta_t =  10.441 [sec])
Background time interval of the image:
-239.320  -0.260 (delta_t = 239.060 [sec])
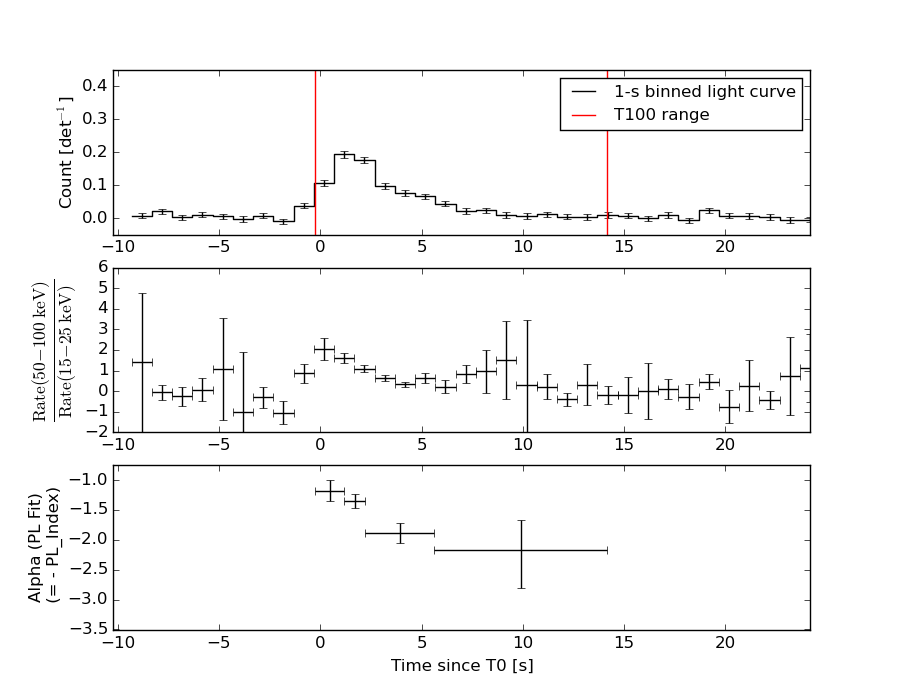
Lightcurves
Notes:
- 1) The mask-weighted light curves are using the flight position.
- 2) Multiple plots of different time binning/intervals are shown to cover all scenarios of short/long GRBs, rate/image triggers, and real/false positives.
- 3) For all the mask-weighted lightcurves, the y-axis units are counts/sec/det where a det is 0.4 x 0.4 = 0.16 sq cm.
- 4) The verticle lines correspond to following: green dotted lines are T50 interval, black dotted lines are T90 interval, blue solid line(s) is a spacecraft slew start time, and orange solid line(s) is a spacecraft slew end time.
- 5) Time of each bin is in the middle of the bin.
1 s binning
From T0-310 s to T0+310 s
From T100_start - 20 s to T100_end + 30 s
Full time interval

64 ms binning
Full time interval
From T100_start to T100_end
From T0-5 sec to T0+5 sec
16 ms binning
From T100_start-5 s to T100_start+5 s

Blue+Cyan dotted lines: Time interval of the scaled map
From 0.000000 to 0.512000
8 ms binning
From T100_start-3 s to T100_start+3 s

Blue+Cyan dotted lines: Time interval of the scaled map
From 0.000000 to 0.512000
2 ms binning
From T100_start-1 s to T100_start+1 s
Blue+Cyan dotted lines: Time interval of the scaled map
From 0.000000 to 0.512000
SN=5 or 10 sec. binning (whichever binning is satisfied first)
SN=5 or 10 sec. binning (T < 200 sec)
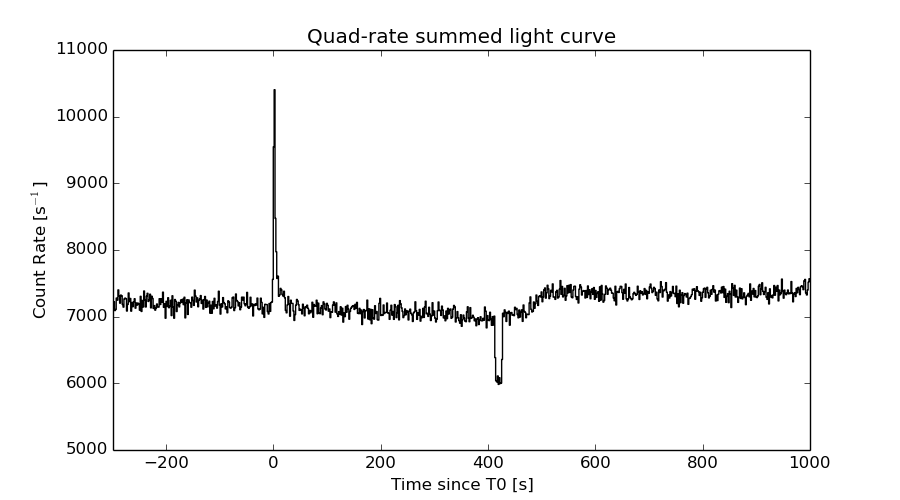
Quad-rate summed light curves (from T0-300s to T0+1000s)
Spectral Evolution
Spectra
Notes:
- 1) The fitting includes the systematic errors.
- 2) When the burst includes telescope slew time periods, the fitting uses an average response file made from multiple 5-s response files through out the slew time plus single time preiod for the non-slew times, and weighted by the total counts in the corresponding time period using addrmf. An average response file is needed becuase a spectral fit using the pre-slew DRM will introduce some errors in both a spectral shape and a normalization if the PHA file contains a lot of the slew/post-slew time interval.
- 3) For fits to more complicated models (e.g. a power-law over a cutoff power-law), the BAT team has decided to require a chi-square improvement of more than 6 for each extra dof.
Time averaged spectrum fit using the average DRM
Power-law model

Time interval is from   -0.260 sec. to   14.176 sec.

Spectral model in power-law:
------------------------------------------------------------
Parameters  : value       lower 90%   higher 90%
Photon index: 1.64057     ( -0.116532   0.118324 )
Norm@50keV  : 3.70845E-03    ( -0.000257961   0.000255974 )
------------------------------------------------------------
#Fit statistic : Chi-Squared =          60.90 using 59 PHA bins.
# Reduced chi-squared =          1.068 for     57 degrees of freedom
# Null hypothesis probability =   3.373225e-01

Photon flux (15-150 keV)    in 14.44 sec: 0.482738 ( -0.0316276  0.0316572 ) ph/cm2/s
Energy fluence (15-150 keV)             : 4.98515e-07 ( -3.70442e-08  3.7384e-08 ) ergs/cm2
Cutoff power-law model

Time interval is from   -0.260 sec. to   14.176 sec.
Spectral model in the cutoff power-law:
------------------------------------------------------------
Parameters  : value       lower 90%   higher 90%
Photon index: 1.21956     ( -0.495065   0.441972 )
Epeak [keV] : 88.9475      ( -25.8019 -88.9475 )
Norm@50keV  : 6.14165E-03    ( -0.00247883   0.00482136 )
------------------------------------------------------------
#Fit statistic : Chi-Squared =          58.29 using 59 PHA bins.
# Reduced chi-squared =          1.041 for     56 degrees of freedom
# Null hypothesis probability =   3.910468e-01

Photon flux (15-150 keV)    in 14.44 sec: 0.472529 ( -0.033374  0.033351 ) ph/cm2/s
Energy fluence (15-150 keV)             : 4.8057e-07 ( -4.15482e-08  4.1863e-08 ) ergs/cm2
Band function
Time interval is from   -0.260 sec. to   14.176 sec.

Spectral model in the Band function:
------------------------------------------------------------
Parameters  : value       lower 90%   higher 90%
alpha       : -1.21960   ( -0.441879   0.49062 )
beta        : -10.0000    ( 10   20 )
Epeak [keV] : 88.9396      ( -22.1347 -88.9396 )
Norm@50keV   : 6.14053E-03    ( -0.00247732   0.00482322 )
------------------------------------------------------------
#Fit statistic : Chi-Squared =          58.29 using 59 PHA bins.
# Reduced chi-squared =          1.060 for     55 degrees of freedom
# Null hypothesis probability =   3.552418e-01

Photon flux (15-150 keV)    in 14.44 sec: 0.471996 ( 6.528  -0.03282 ) ph/cm2/s
Energy fluence (15-150 keV)             : 4.80247e-07 ( 0  0 ) ergs/cm2
Single BB

Spectral model blackbody:
------------------------------------------------------------
Parameters  : value    Lower 90%  Upper 90%
kT [keV]    : 13.5672  (-1.12013  1.22965)
R^2/D10^2   : 7.50005E-02  (-0.0200477   0.0272554)
(R is the radius in km and D10 is the distance to the source in units of 10 kpc)
------------------------------------------------------------
#Fit statistic : Chi-Squared =         108.18 using 59 PHA bins.
# Reduced chi-squared =         1.8980 for     57 degrees of freedom
# Null hypothesis probability =   5.062617e-05

Energy  Fluence     90% Error
[keV]   [erg/cm2]   [erg/cm2]
15- 25  4.221e-08   4.744e-09
25- 50  1.521e-07   1.259e-08
50-150  1.813e-07   2.693e-08
15-150  3.756e-07   3.126e-08
Thermal bremsstrahlung (OTTB)

Spectral model: thermal bremsstrahlung
------------------------------------------------------------
Parameters  : value         Lower 90%    Upper 90%
kT [keV]    : 156.135       (-44.3642      -155.198)
Norm        : 1.98128       (-0.141009     0.172426)
------------------------------------------------------------
#Fit statistic : Chi-Squared =          58.40 using 59 PHA bins.
# Reduced chi-squared =          1.025 for     57 degrees of freedom
# Null hypothesis probability =   4.238131e-01

Energy  Fluence     90% Error
[keV]   [erg/cm2]   [erg/cm2]
15- 25  7.322e-08   6.274e-09
25- 50  1.365e-07   2.244e-08
50-150  2.739e-07   1.096e-07
15-150  4.836e-07   1.308e-07
Double BB
Spectral model: bbodyrad<1> + bbodyrad<2>
------------------------------------------------------------
Parameters  : value         Lower 90%    Upper 90%
kT1 [keV]   : 5.79905        (-1.26394      1.51509)
R1^2/D10^2  : 0.969100        (-0.537193      1.55171)
kT2 [keV]   : 21.2001        (-3.26192      5.07857)
R2^2/D10^2  : 1.23182E-02    (-0.00691688   0.0112564)
------------------------------------------------------------
#Fit statistic : Chi-Squared =          57.55 using 59 PHA bins.
# Reduced chi-squared =          1.046 for     55 degrees of freedom
# Null hypothesis probability =   3.811131e-01

Energy  Fluence     90% Error
[keV]   [erg/cm2]   [erg/cm2]
15- 25  7.449e-08   2.307e-08
25- 50  1.328e-07   3.213e-08
50-150  2.651e-07   7.097e-08
15-150  4.723e-07   1.123e-07
Peak spectrum fit
Power-law model
Time interval is from    1.120 sec. to    2.120 sec.

Spectral model in power-law:
------------------------------------------------------------
Parameters  : value       lower 90%   higher 90%
Photon index: 1.33091     ( -0.118367   0.118322 )
Norm@50keV  : 1.59181E-02    ( -0.00111959   0.00111841 )
------------------------------------------------------------
#Fit statistic : Chi-Squared =          59.82 using 59 PHA bins.
# Reduced chi-squared =          1.049 for     57 degrees of freedom
# Null hypothesis probability =   3.737892e-01

Photon flux (15-150 keV)    in 1 sec: 1.91031 ( -0.136007  0.136125 ) ph/cm2/s
Energy fluence (15-150 keV)             : 1.56147e-07 ( -1.223e-08  1.23006e-08 ) ergs/cm2
Cutoff power-law model
Time interval is from    1.120 sec. to    2.120 sec.
Spectral model in the cutoff power-law:
------------------------------------------------------------
Parameters  : value       lower 90%   higher 90%
Photon index: 0.844645     ( -0.526872   0.469738 )
Epeak [keV] : 121.922      ( -39.5078 1099.55 )
Norm@50keV  : 2.77833E-02    ( -0.0113413   0.02231 )
------------------------------------------------------------
#Fit statistic : Chi-Squared =          56.68 using 59 PHA bins.
# Reduced chi-squared =          1.012 for     56 degrees of freedom
# Null hypothesis probability =   4.493155e-01

Photon flux (15-150 keV)    in 1 sec: 1.87560 ( -0.14021  0.14015 ) ph/cm2/s
Energy fluence (15-150 keV)             : 1.51076e-07 ( -1.3441e-08  1.3366e-08 ) ergs/cm2
Band function
Time interval is from    1.120 sec. to    2.120 sec.

Spectral model in the Band function:
------------------------------------------------------------
Parameters  : value       lower 90%   higher 90%
alpha       : 1.22634   ( -1.50177   -0.390407 )
beta        : -1.54282    ( 1.5376   0.200077 )
Epeak [keV] : 42.2668      ( -24.5091 127.93 )
Norm@50keV   : 0.661076    ( -0.663892   120.476 )
------------------------------------------------------------
#Fit statistic : Chi-Squared =          54.28 using 59 PHA bins.
# Reduced chi-squared =         0.9870 for     55 degrees of freedom
# Null hypothesis probability =   5.019840e-01

Photon flux (15-150 keV)    in 1 sec:  (    ) ph/cm2/s
Energy fluence (15-150 keV)             : 0 ( 0  0 ) ergs/cm2
Single BB

Spectral model blackbody:
------------------------------------------------------------
Parameters  : value    Lower 90%  Upper 90%
kT [keV]    : 16.2022  (-1.42675  1.60885)
R^2/D10^2   : 0.174032  (-0.0482816   0.0649874)
(R is the radius in km and D10 is the distance to the source in units of 10 kpc)
------------------------------------------------------------
#Fit statistic : Chi-Squared =          91.79 using 59 PHA bins.
# Reduced chi-squared =          1.610 for     57 degrees of freedom
# Null hypothesis probability =   2.384571e-03

Energy  Fluence     90% Error
[keV]   [erg/cm2]   [erg/cm2]
15- 25  9.419e-09   1.264e-09
25- 50  4.006e-08   4.115e-09
50-150  7.385e-08   9.770e-09
15-150  1.233e-07   1.025e-08
Thermal bremsstrahlung (OTTB)

Spectral model: thermal bremsstrahlung
------------------------------------------------------------
Parameters  : value         Lower 90%    Upper 90%
kT [keV]    : 200.000       (      )
Norm        : 7.90109       (-0.554487     0.554454)
------------------------------------------------------------
#Fit statistic : Chi-Squared =          66.58 using 59 PHA bins.
# Reduced chi-squared =          1.168 for     57 degrees of freedom
# Null hypothesis probability =   1.807080e-01

Energy  Fluence     90% Error
[keV]   [erg/cm2]   [erg/cm2]
15- 25  1.968e-08   1.595e-09
25- 50  3.785e-08   4.060e-09
50-150  8.302e-08   2.358e-08
15-150  1.405e-07   3.448e-08
Double BB

Spectral model: bbodyrad<1> + bbodyrad<2>
------------------------------------------------------------
Parameters  : value         Lower 90%    Upper 90%
kT1 [keV]   : 9.10672        (-1.84144      2.01796)
R1^2/D10^2  : 0.799348        (-0.343938      0.734545)
kT2 [keV]   : 33.5983        (-8.59572      22.6616)
R2^2/D10^2  : 1.09800E-02    (-0.00858363   0.0123231)
------------------------------------------------------------
#Fit statistic : Chi-Squared =          53.75 using 59 PHA bins.
# Reduced chi-squared =         0.9773 for     55 degrees of freedom
# Null hypothesis probability =   5.223356e-01

Energy  Fluence     90% Error
[keV]   [erg/cm2]   [erg/cm2]
15- 25  1.479e-08   3.830e-09
25- 50  3.973e-08   1.028e-08
50-150  9.903e-08   4.368e-08
15-150  1.535e-07   5.449e-08
Pre-slew spectrum (Pre-slew PHA with pre-slew DRM)
Power-law model

Spectral model in power-law:
------------------------------------------------------------
Parameters  : value       lower 90%   higher 90%
Photon index: 1.58842     ( -0.104944   0.10614 )
Norm@50keV  : 4.94590E-03    ( -0.000307692   0.000306146 )
------------------------------------------------------------
#Fit statistic : Chi-Squared =          59.34 using 59 PHA bins.
# Reduced chi-squared =          1.041 for     57 degrees of freedom
# Null hypothesis probability =   3.904805e-01

Photon flux (15-150 keV)    in 10.44 sec: 0.633314 ( -0.0381636  0.0382052 ) ph/cm2/s
Energy fluence (15-150 keV)             : 4.83593e-07 ( -3.24716e-08  3.27125e-08 ) ergs/cm2
Cutoff power-law model

Spectral model in the cutoff power-law:
------------------------------------------------------------
Parameters  : value       lower 90%   higher 90%
Photon index: 1.00475     ( -0.466826   0.421878 )
Epeak [keV] : 83.5956      ( -18.3528 84.4487 )
Norm@50keV  : 9.82086E-03    ( -0.00376039   0.00695749 )
------------------------------------------------------------
#Fit statistic : Chi-Squared =          53.54 using 59 PHA bins.
# Reduced chi-squared =         0.9560 for     56 degrees of freedom
# Null hypothesis probability =   5.685884e-01

Photon flux (15-150 keV)    in 10.44 sec: 0.614761 ( -0.040325  0.040322 ) ph/cm2/s
Energy fluence (15-150 keV)             : 4.61348e-07 ( -3.60441e-08  3.63322e-08 ) ergs/cm2
Band function

Spectral model in the Band function:
------------------------------------------------------------
Parameters  : value       lower 90%   higher 90%
alpha       : -1.00482   ( -0.448519   0.438561 )
beta        : -10.0000    ( 10   6.03961e-14 )
Epeak [keV] : 83.5898      ( -18.3644 84.3263 )
Norm@50keV   : 9.81905E-03    ( -0.00375893   0.00696671 )
------------------------------------------------------------
#Fit statistic : Chi-Squared =          53.54 using 59 PHA bins.
# Reduced chi-squared =         0.9734 for     55 degrees of freedom
# Null hypothesis probability =   5.306124e-01

Photon flux (15-150 keV)    in 10.44 sec: 0.614378 ( 6.38562  -0.037181 ) ph/cm2/s
Energy fluence (15-150 keV)             : 4.63277e-07 ( 0  0 ) ergs/cm2
S(25-50 keV) vs. S(50-100 keV) plot
S(25-50 keV)  = 1.32e-07
S(50-100 keV) = 1.69e-07
T90 vs. Hardness ratio plot

T90                                   = 10.027999997139 sec.
Hardness ratio (energy fluence ratio) = 1.2803
Color vs. Color plot

Count Ratio  (25-50 keV) / (15-25 keV) = 1.23394
Count Ratio (50-100 keV) / (15-25 keV) = 0.853864
Mask shadow pattern

IMX = 3.274621348539180E-01, IMY = 7.018943057258914E-02
TIME vs. PHA plot around the trigger time

Blue+Cyan dotted lines: Time interval of the scaled map
From 0.000000 to 0.512000
TIME vs. DetID plot around the trigger time
Blue+Cyan dotted lines: Time interval of the scaled map
From 0.000000 to 0.512000
100 us light curve (15-350 keV)

Blue+Cyan dotted lines: Time interval of the scaled map
From 0.000000 to 0.512000
Spacecraft aspect plot
Bright source in the pre-burst/pre-slew/post-slew images
Pre-burst image of 15-350 keV band
Time interval of the image:
-239.320000 -0.260000

# RAcent  DECcent POSerr Theta    Phi  PeakCts   SNR AngSep     Name
#  [deg]    [deg]    ['] [deg]  [deg]                   [']
333.5886  24.9389    2.3  48.6  168.2   1.8946   5.0 ------	UNKNOWN
 19.3824 -69.5483    2.7  53.4    7.5   2.6420   4.2 ------	UNKNOWN
  8.1104 -10.2665    3.0  13.1 -107.1   0.5442   3.8 ------	UNKNOWN
356.8363  41.4005    3.9  59.3 -163.2   3.4776   3.0 ------	UNKNOWN
Pre-slew background subtracted image of 15-350 keV band
Time interval of the image:
-0.260000 10.180600

# RAcent  DECcent POSerr Theta    Phi  PeakCts   SNR AngSep     Name
#  [deg]    [deg]    ['] [deg]  [deg]                   [']
  7.8217 -33.7481    0.4  18.5  -12.1   0.8526  30.0 ------	UNKNOWN
Post-slew image of 15-350 keV band
Time interval of the image:
51.380600 408.280600

# RAcent  DECcent POSerr Theta    Phi  PeakCts   SNR AngSep     Name
#  [deg]    [deg]    ['] [deg]  [deg]                   [']
339.8295 -75.4756    3.1  43.8   24.0   1.6843   3.8 ------	UNKNOWN
 66.3741 -81.4291    2.6  52.1    4.9   2.5906   4.5 ------	UNKNOWN
 27.6975 -65.2923    2.5  33.8   -0.6   1.2640   4.7 ------	UNKNOWN
 36.5486 -58.2088    2.4  31.1  -15.2   0.9895   4.8 ------	UNKNOWN
 51.2481 -65.6604    2.3  41.0  -11.4   1.4287   5.1 ------	UNKNOWN
 91.7792 -58.7525    2.9  58.7  -22.9   5.3874   3.9 ------	UNKNOWN
 50.7217 -25.6886    3.0  37.9  -76.4   2.0149   3.9 ------	UNKNOWN
Plot creation:
Sun May 31 12:42:25 EDT 2015