Special notes of this burst
Image
Pre-slew 15.0-350.0 keV image (Event data)

#   RAcent    DECcent   POSerr    Theta     Phi              Peak Cts       SNR   Name
  170.8546    28.9692   0.0255    12.9818  -130.5169         0.1131700      7.530 TRIG_00219646

Foreground time interval of the image:
 -0.224   2.776 (delta_t =   3.000 [sec])
Background time interval of the image:
-239.224  -0.224 (delta_t = 239.000 [sec])
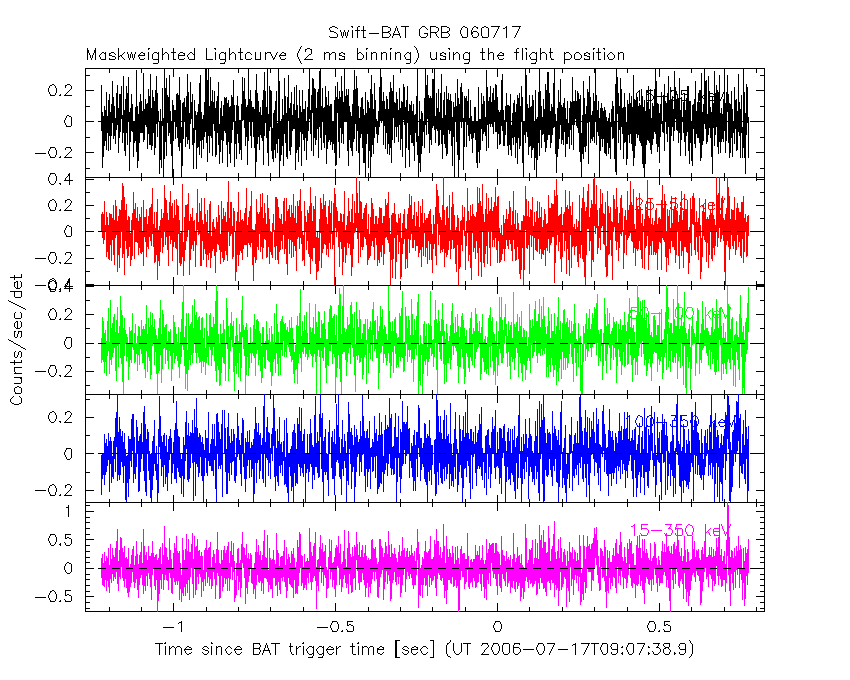
Lightcurves
Notes:
- 1) The mask-weighted light curves are using the flight position.
- 2) Multiple plots of different time binning/intervals are shown to cover all scenarios of short/long GRBs, rate/image triggers, and real/false positives.
- 3) For all the mask-weighted lightcurves, the y-axis units are counts/sec/det where a det is 0.4 x 0.4 = 0.16 sq cm.
- 4) The verticle lines correspond to following: green dotted lines are T50 interval, black dotted lines are T90 interval, blue solid line(s) is a spacecraft slew start time, and orange solid line(s) is a spacecraft slew end time.
- 5) Time of each bin is in the middle of the bin.
1 s binning
From T0-310 s to T0+310 s

From T100_start - 20 s to T100_end + 30 s
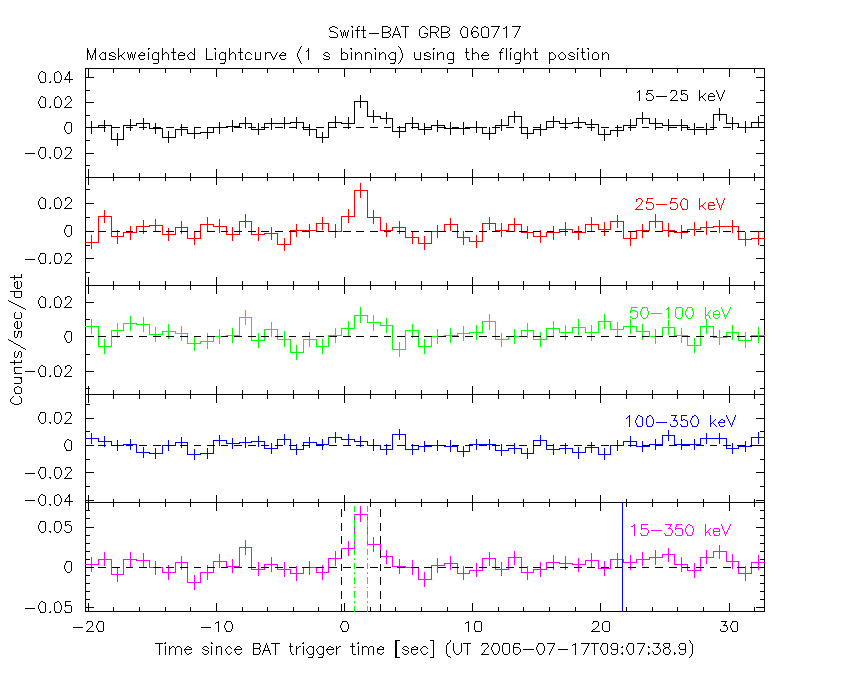
Full time interval

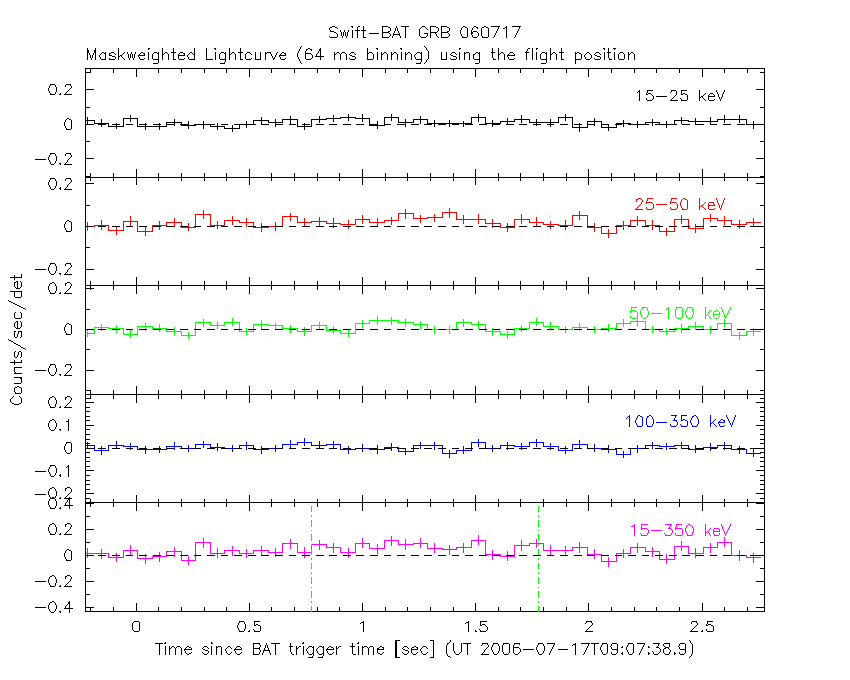
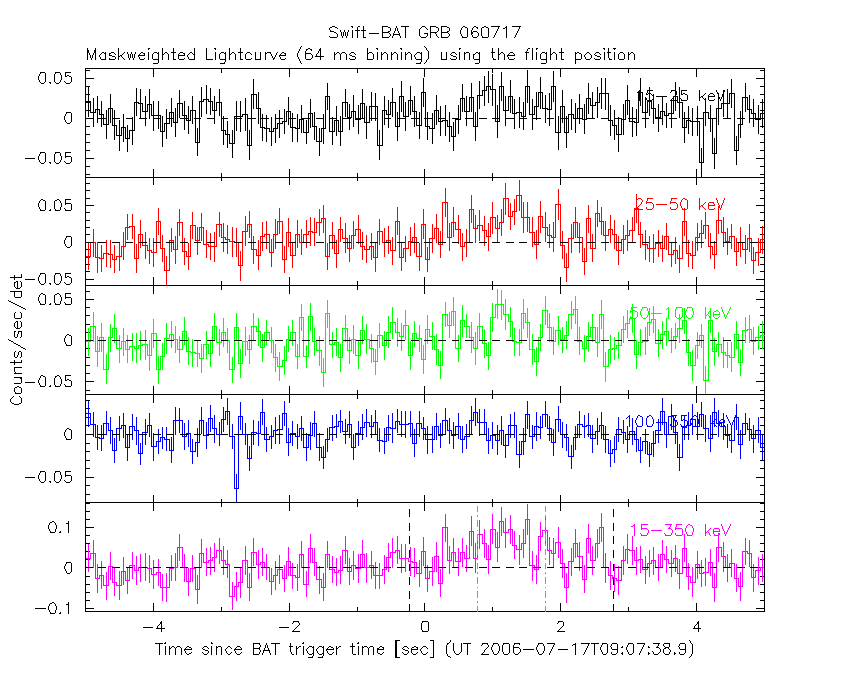
64 ms binning
Full time interval

From T100_start to T100_end
From T0-5 sec to T0+5 sec
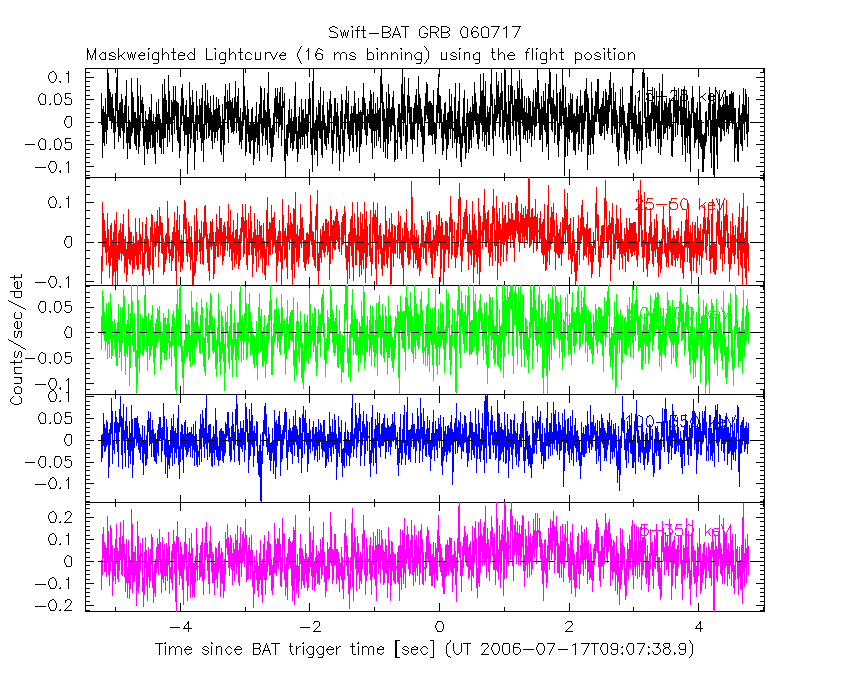
16 ms binning
From T100_start-5 s to T100_start+5 s
8 ms binning
From T100_start-3 s to T100_start+3 s

2 ms binning
From T100_start-1 s to T100_start+1 s
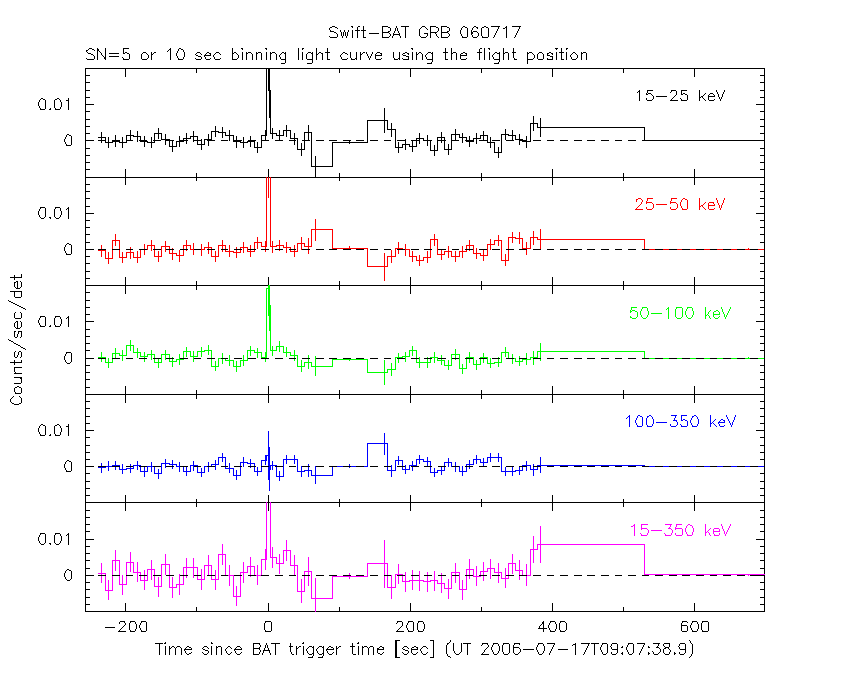
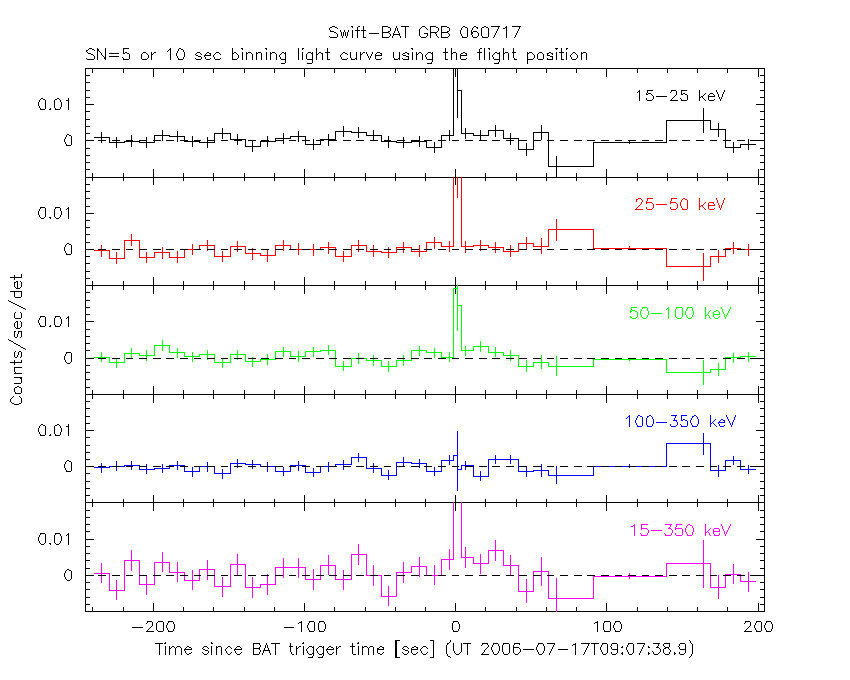
SN=5 or 10 sec. binning (whichever binning is satisfied first)
SN=5 or 10 sec. binning (T < 200 sec)
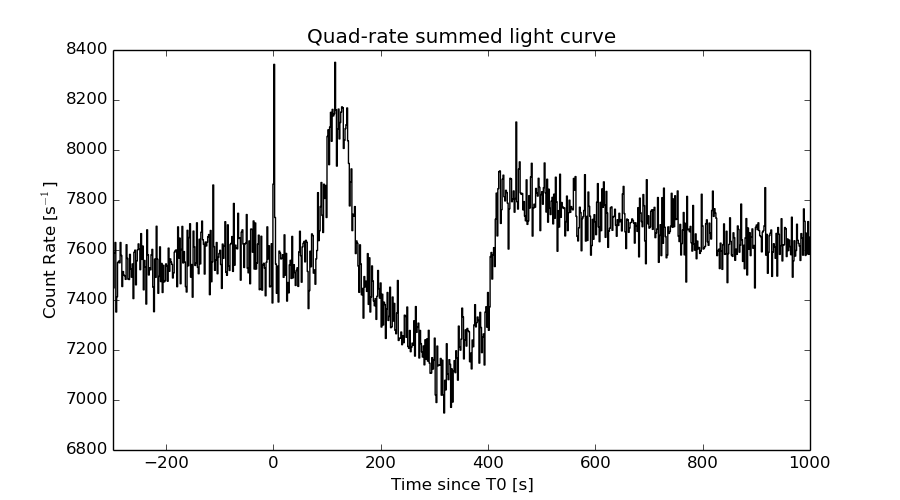
Quad-rate summed light curves (from T0-300s to T0+1000s)
Spectral Evolution

Spectra
Notes:
- 1) The fitting includes the systematic errors.
- 2) When the burst includes telescope slew time periods, the fitting uses an average response file made from multiple 5-s response files through out the slew time plus single time preiod for the non-slew times, and weighted by the total counts in the corresponding time period using addrmf. An average response file is needed becuase a spectral fit using the pre-slew DRM will introduce some errors in both a spectral shape and a normalization if the PHA file contains a lot of the slew/post-slew time interval.
- 3) For fits to more complicated models (e.g. a power-law over a cutoff power-law), the BAT team has decided to require a chi-square improvement of more than 6 for each extra dof.
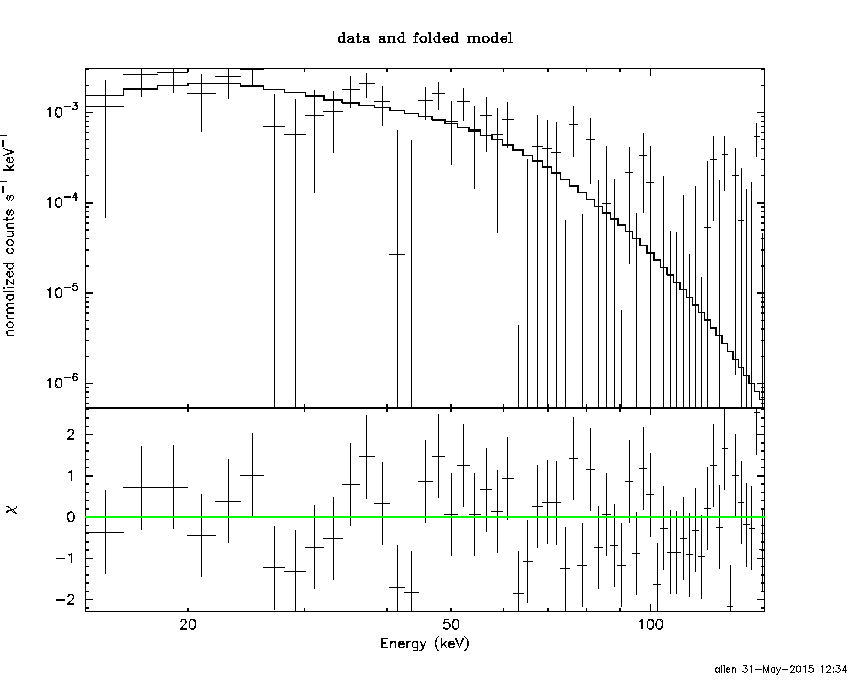
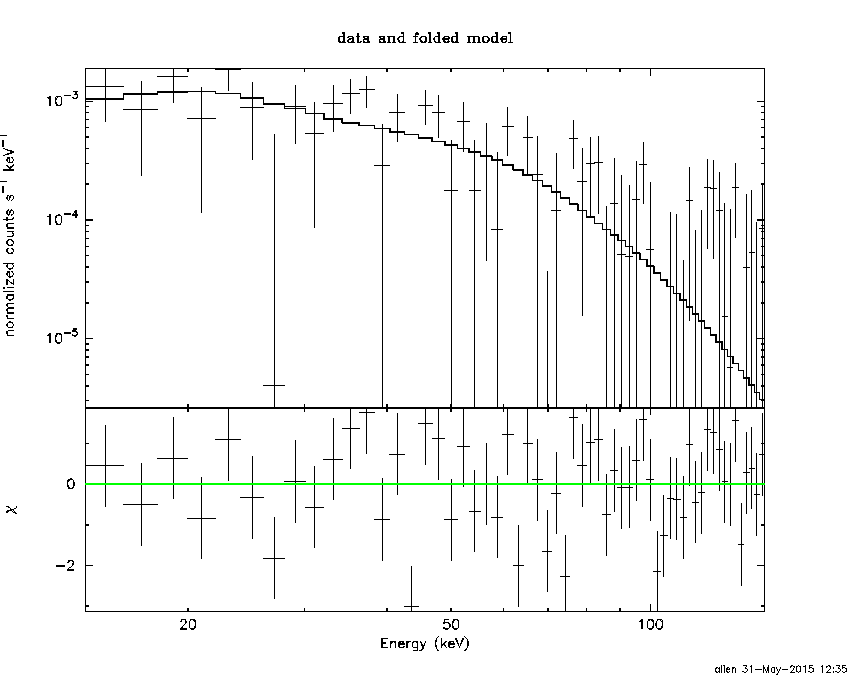
Time averaged spectrum fit using the average DRM
Power-law model
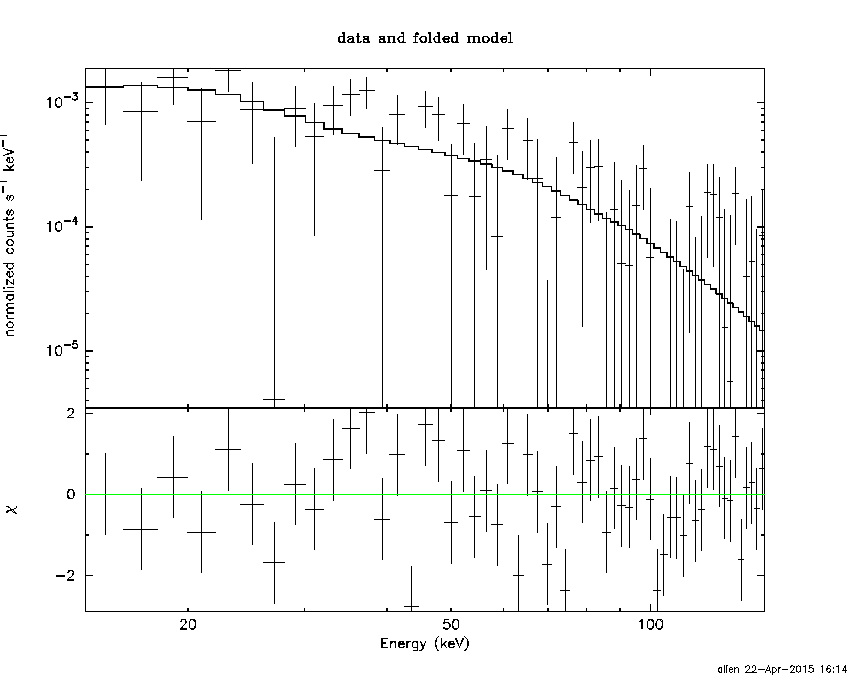
Time interval is from   -0.224 sec. to    2.776 sec.

Spectral model in power-law:
------------------------------------------------------------
Parameters  : value       lower 90%   higher 90%
Photon index: 1.66342     ( -0.340055   0.362037 )
Norm@50keV  : 2.35983E-03    ( -0.00054713   0.000531052 )
------------------------------------------------------------
#Fit statistic : Chi-Squared =          71.20 using 59 PHA bins.
# Reduced chi-squared =          1.249 for     57 degrees of freedom
# Null hypothesis probability =   9.775051e-02

Photon flux (15-150 keV)    in 3 sec: 0.309513 ( -0.0617288  0.061732 ) ph/cm2/s
Energy fluence (15-150 keV)             : 6.57573e-08 ( -1.57552e-08  1.64019e-08 ) ergs/cm2
Cutoff power-law model

Time interval is from   -0.224 sec. to    2.776 sec.
Spectral model in the cutoff power-law:
------------------------------------------------------------
Parameters  : value       lower 90%   higher 90%
Photon index: 0.396484     ( -2.75703   1.71503 )
Epeak [keV] : 53.8295      ( -16.0283 -53.8259 )
Norm@50keV  : 1.24052E-02    ( -0.0124108   0.48101 )
------------------------------------------------------------
#Fit statistic : Chi-Squared =          69.65 using 59 PHA bins.
# Reduced chi-squared =          1.244 for     56 degrees of freedom
# Null hypothesis probability =   1.038365e-01

Photon flux (15-150 keV)    in 3 sec: 0.295697 ( -0.064454  0.064615 ) ph/cm2/s
Energy fluence (15-150 keV)             : 5.75403e-08 ( -1.63596e-08  1.96368e-08 ) ergs/cm2
Band function
Time interval is from   -0.224 sec. to    2.776 sec.

Spectral model in the Band function:
------------------------------------------------------------
Parameters  : value       lower 90%   higher 90%
alpha       : 0.362968   ( -0.666391   4.07869 )
beta        : -2.42618    ( 2.42595   0.957586 )
Epeak [keV] : 45.2431      ( -44.0202 28.8299 )
Norm@50keV   : 3.77028E-02    ( -0.0369047   115.67 )
------------------------------------------------------------
#Fit statistic : Chi-Squared =          69.34 using 59 PHA bins.
# Reduced chi-squared =          1.261 for     55 degrees of freedom
# Null hypothesis probability =   9.237834e-02

Photon flux (15-150 keV)    in 3 sec:  (    ) ph/cm2/s
Energy fluence (15-150 keV)             : 5.95872e-08 ( 0  0 ) ergs/cm2
Single BB

Spectral model blackbody:
------------------------------------------------------------
Parameters  : value    Lower 90%  Upper 90%
kT [keV]    : 11.6488  (-2.26374  2.98065)
R^2/D10^2   : 8.76443E-02  (-0.0496546   0.104562)
(R is the radius in km and D10 is the distance to the source in units of 10 kpc)
------------------------------------------------------------
#Fit statistic : Chi-Squared =          71.25 using 59 PHA bins.
# Reduced chi-squared =          1.250 for     57 degrees of freedom
# Null hypothesis probability =   9.711358e-02

Energy  Fluence     90% Error
[keV]   [erg/cm2]   [erg/cm2]
15- 25  7.523e-09   2.856e-09
25- 50  2.285e-08   7.837e-09
50-150  1.827e-08   9.288e-09
15-150  4.864e-08   1.588e-08
Thermal bremsstrahlung (OTTB)

Spectral model: thermal bremsstrahlung
------------------------------------------------------------
Parameters  : value         Lower 90%    Upper 90%
kT [keV]    : 126.212       (-66.5803      -124.334)
Norm        : 1.31581       (-0.286321     0.410887)
------------------------------------------------------------
#Fit statistic : Chi-Squared =          70.30 using 59 PHA bins.
# Reduced chi-squared =          1.233 for     57 degrees of freedom
# Null hypothesis probability =   1.109756e-01

Energy  Fluence     90% Error
[keV]   [erg/cm2]   [erg/cm2]
15- 25  1.026e-08   5.799e-09
25- 50  1.851e-08   1.052e-08
50-150  3.385e-08   2.281e-08
15-150  6.262e-08   3.823e-08
Double BB
------------------------------------------------------------
#Fit statistic : Chi-Squared =          69.96 using 59 PHA bins.
#Fit statistic : Chi-Squared =          69.44 using 59 PHA bins.
#Fit statistic : Chi-Squared =          69.42 using 59 PHA bins.
#Fit statistic : Chi-Squared =          69.40 using 59 PHA bins.
# Reduced chi-squared =          1.272 for     55 degrees of freedom
# Reduced chi-squared =          1.263 for     55 degrees of freedom
# Reduced chi-squared =          1.262 for     55 degrees of freedom
# Reduced chi-squared =          1.262 for     55 degrees of freedom
# Null hypothesis probability =   8.427236e-02
# Null hypothesis probability =   9.107295e-02
# Null hypothesis probability =   9.130785e-02
# Null hypothesis probability =   9.156452e-02

Energy  Fluence     90% Error
[keV]   [erg/cm2]   [erg/cm2]
15- 25  8.922e-09   4.515e-09
25- 50  2.103e-08   1.208e-08
50-150  2.141e-08   1.416e-08
15-150  5.136e-08   2.637e-08
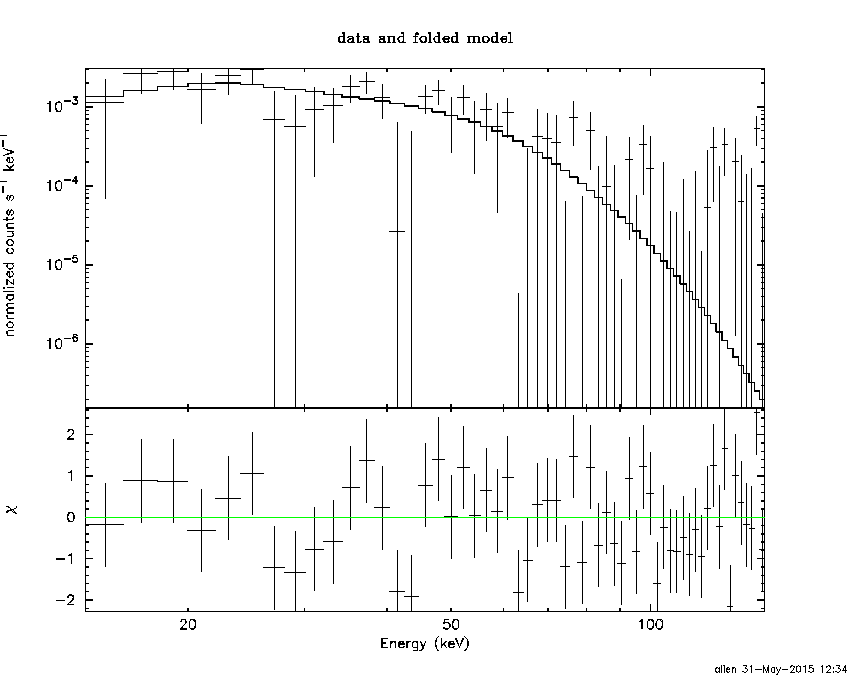
Peak spectrum fit
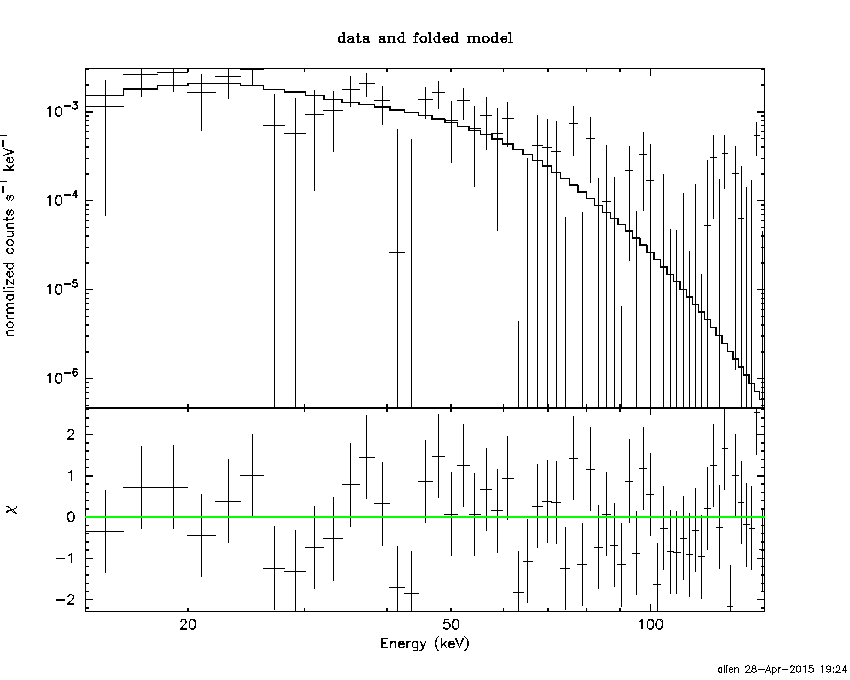
Power-law model

Time interval is from    0.776 sec. to    1.776 sec.

Spectral model in power-law:
------------------------------------------------------------
Parameters  : value       lower 90%   higher 90%
Photon index: 1.86176     ( -0.331047   0.366829 )
Norm@50keV  : 3.65040E-03    ( -0.000954378   0.000931508 )
------------------------------------------------------------
#Fit statistic : Chi-Squared =          68.99 using 59 PHA bins.
# Reduced chi-squared =          1.210 for     57 degrees of freedom
# Null hypothesis probability =   1.326098e-01

Photon flux (15-150 keV)    in 1 sec: 0.515560 ( -0.108024  0.108067 ) ph/cm2/s
Energy fluence (15-150 keV)             : 3.35538e-08 ( -8.49226e-09  8.89484e-09 ) ergs/cm2
Cutoff power-law model
Time interval is from    0.776 sec. to    1.776 sec.
Spectral model in the cutoff power-law:
------------------------------------------------------------
Parameters  : value       lower 90%   higher 90%
Photon index: -0.771391     ( -2.87206   1.85938 )
Epeak [keV] : 43.8607      ( -8.60403 13.5996 )
Norm@50keV  : 0.119270    ( -0.139205   5.2081 )
------------------------------------------------------------
#Fit statistic : Chi-Squared =          61.88 using 59 PHA bins.
# Reduced chi-squared =          1.105 for     56 degrees of freedom
# Null hypothesis probability =   2.742545e-01

Photon flux (15-150 keV)    in 1 sec: 0.492203 ( -0.106068  0.106754 ) ph/cm2/s
Energy fluence (15-150 keV)             : 2.89305e-08 ( -6.8772e-09  8.036e-09 ) ergs/cm2
Band function
Time interval is from    0.776 sec. to    1.776 sec.

Spectral model in the Band function:
------------------------------------------------------------
Parameters  : value       lower 90%   higher 90%
alpha       : 0.789496   ( -1.8093   2.91743 )
beta        : -9.37167    ( 9.37167   19.3714 )
Epeak [keV] : 43.9255      ( -8.8273 13.2582 )
Norm@50keV   : 0.118819    ( -0.1265   5.19514 )
------------------------------------------------------------
#Fit statistic : Chi-Squared =          61.92 using 59 PHA bins.
# Reduced chi-squared =          1.126 for     55 degrees of freedom
# Null hypothesis probability =   2.429531e-01

Photon flux (15-150 keV)    in 1 sec:  (    ) ph/cm2/s
Energy fluence (15-150 keV)             : 0 ( 0  0 ) ergs/cm2
Single BB
Spectral model blackbody:
------------------------------------------------------------
Parameters  : value    Lower 90%  Upper 90%
kT [keV]    : 11.1669  (-1.96109  2.34484)
R^2/D10^2   : 0.180799  (-0.0926487   0.186122)
(R is the radius in km and D10 is the distance to the source in units of 10 kpc)
------------------------------------------------------------
#Fit statistic : Chi-Squared =          61.94 using 59 PHA bins.
# Reduced chi-squared =          1.087 for     57 degrees of freedom
# Null hypothesis probability =   3.044374e-01

Energy  Fluence     90% Error
[keV]   [erg/cm2]   [erg/cm2]
15- 25  4.724e-09   1.906e-09
25- 50  1.362e-08   4.453e-09
50-150  9.702e-09   4.688e-09
15-150  2.804e-08   8.790e-09
Thermal bremsstrahlung (OTTB)
Spectral model: thermal bremsstrahlung
------------------------------------------------------------
Parameters  : value         Lower 90%    Upper 90%
kT [keV]    : 73.7367       (-31.4099      85.2343)
Norm        : 2.56268       (-0.648482     0.853604)
------------------------------------------------------------
#Fit statistic : Chi-Squared =          65.79 using 59 PHA bins.
# Reduced chi-squared =          1.154 for     57 degrees of freedom
# Null hypothesis probability =   1.986889e-01

Energy  Fluence     90% Error
[keV]   [erg/cm2]   [erg/cm2]
15- 25  6.608e-09   2.209e-09
25- 50  1.066e-08   3.913e-09
50-150  1.422e-08   1.051e-08
15-150  3.149e-08   1.399e-08
Double BB
Spectral model: bbodyrad<1> + bbodyrad<2>
------------------------------------------------------------
Parameters  : value         Lower 90%    Upper 90%
kT1 [keV]   : 3.27981        (-3.46045      -3.46045)
R1^2/D10^2  : 4.47252        (-3.87654      -3.87654)
kT2 [keV]   : 11.9035        (-2.52157      -11.9987)
R2^2/D10^2  : 0.134473    (-0.130023   0.200681)
------------------------------------------------------------
#Fit statistic : Chi-Squared =          61.21 using 59 PHA bins.
# Reduced chi-squared =          1.113 for     55 degrees of freedom
# Null hypothesis probability =   2.629369e-01

Energy  Fluence     90% Error
[keV]   [erg/cm2]   [erg/cm2]
15- 25  5.452e-09   2.805e-09
25- 50  1.283e-08   7.400e-09
50-150  1.064e-08   6.735e-09
15-150  2.892e-08   1.641e-08
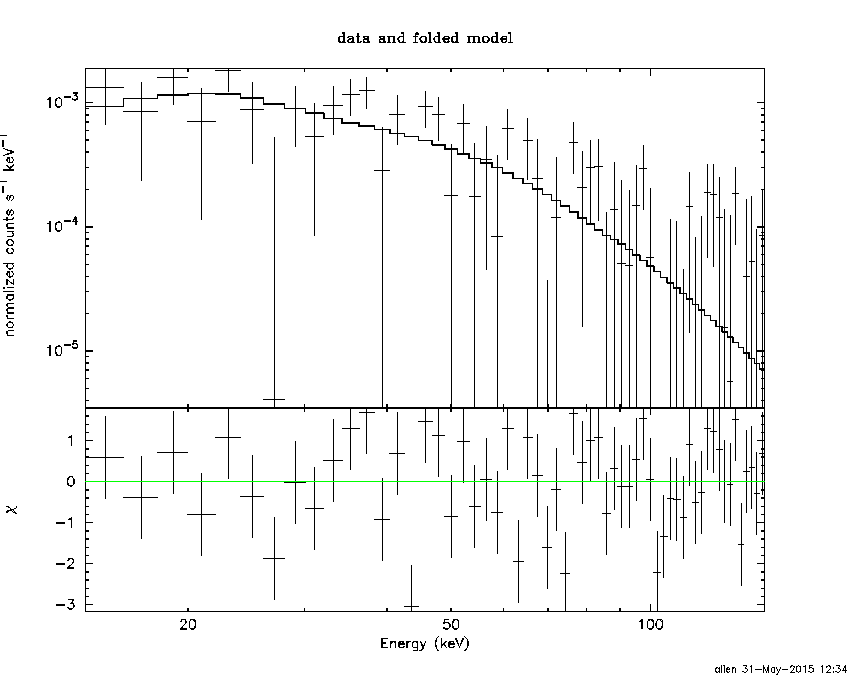
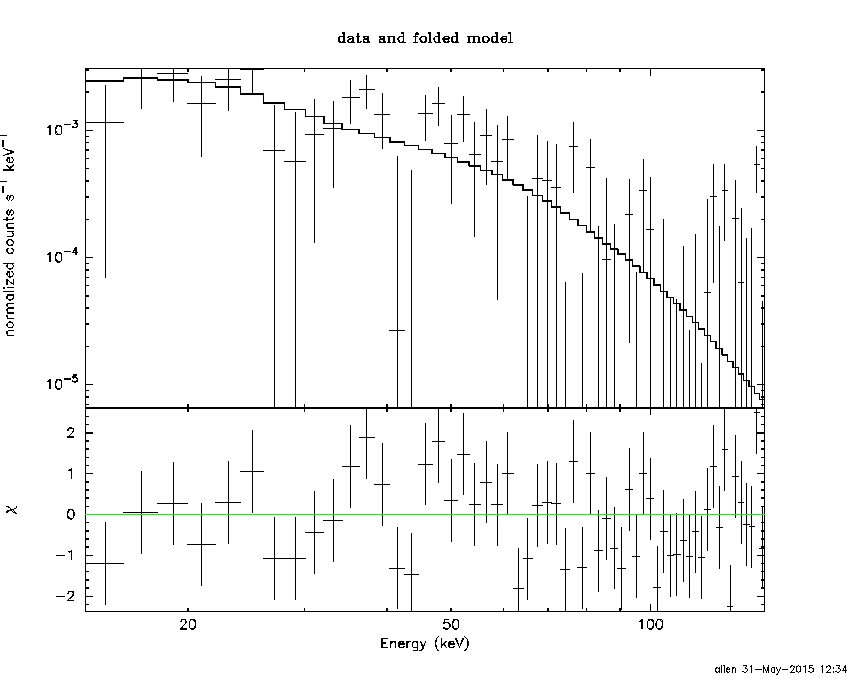
Pre-slew spectrum (Pre-slew PHA with pre-slew DRM)
Power-law model

Spectral model in power-law:
------------------------------------------------------------
Parameters  : value       lower 90%   higher 90%
Photon index: 1.66342     ( -0.340055   0.362037 )
Norm@50keV  : 2.35983E-03    ( -0.00054713   0.000531052 )
------------------------------------------------------------
#Fit statistic : Chi-Squared =          71.20 using 59 PHA bins.
# Reduced chi-squared =          1.249 for     57 degrees of freedom
# Null hypothesis probability =   9.775051e-02

Photon flux (15-150 keV)    in 3 sec: 0.309513 ( -0.0617288  0.061732 ) ph/cm2/s
Energy fluence (15-150 keV)             : 6.57573e-08 ( -1.57552e-08  1.64019e-08 ) ergs/cm2
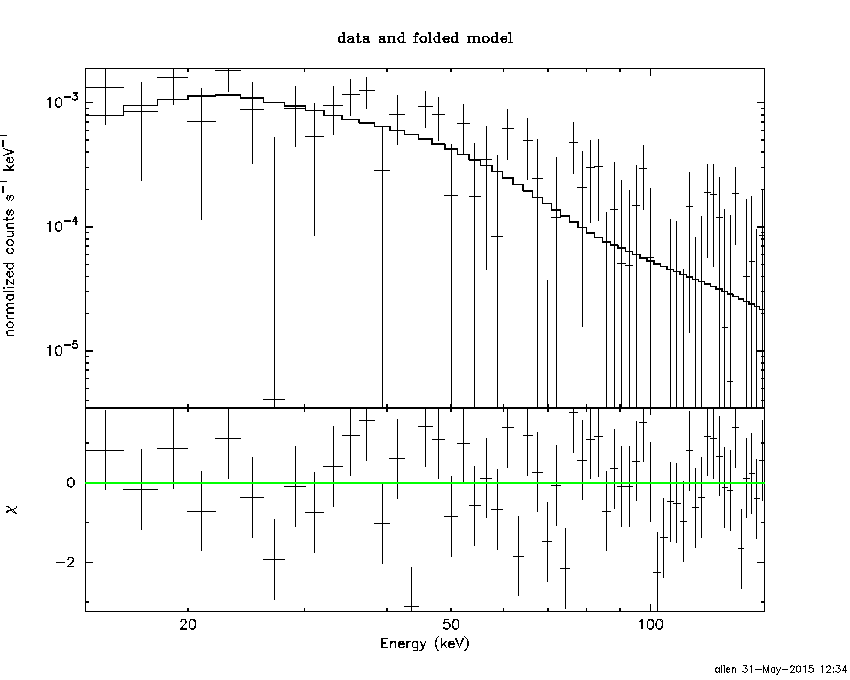
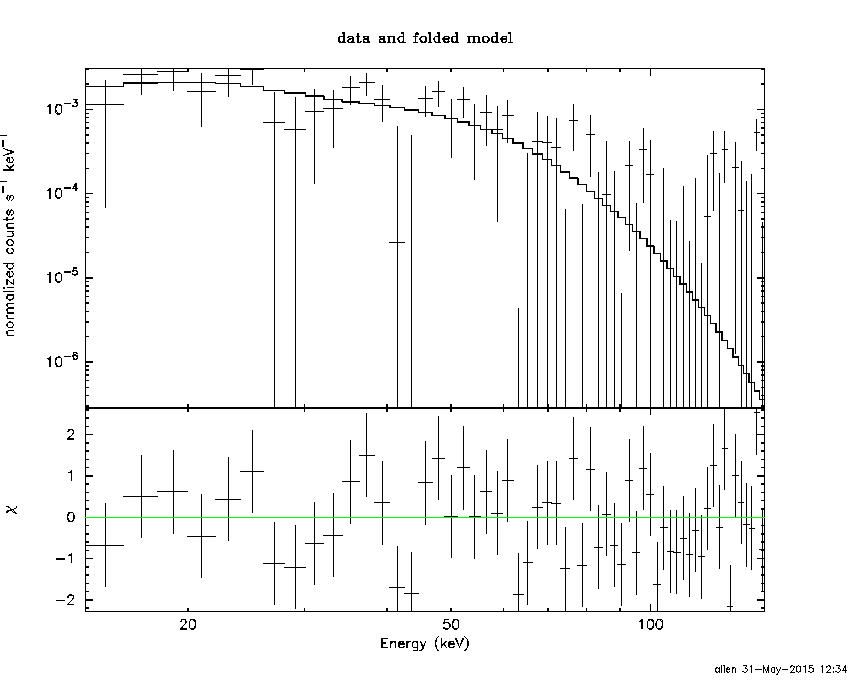
Cutoff power-law model
Spectral model in the cutoff power-law:
------------------------------------------------------------
Parameters  : value       lower 90%   higher 90%
Photon index: 0.396484     ( -2.75703   1.71503 )
Epeak [keV] : 53.8295      ( -16.0283 -53.8259 )
Norm@50keV  : 1.24052E-02    ( -0.0124108   0.48101 )
------------------------------------------------------------
#Fit statistic : Chi-Squared =          69.65 using 59 PHA bins.
# Reduced chi-squared =          1.244 for     56 degrees of freedom
# Null hypothesis probability =   1.038365e-01

Photon flux (15-150 keV)    in 3 sec: 0.295697 ( -0.064454  0.064615 ) ph/cm2/s
Energy fluence (15-150 keV)             : 5.75403e-08 ( -1.63596e-08  1.96368e-08 ) ergs/cm2
Band function

Spectral model in the Band function:
------------------------------------------------------------
Parameters  : value       lower 90%   higher 90%
alpha       : 0.362968   ( -0.666391   4.07868 )
beta        : -2.42618    ( 2.42595   0.957586 )
Epeak [keV] : 45.2431      ( -44.0202 28.8299 )
Norm@50keV   : 3.77028E-02    ( -0.0369047   115.67 )
------------------------------------------------------------
#Fit statistic : Chi-Squared =          69.34 using 59 PHA bins.
# Reduced chi-squared =          1.261 for     55 degrees of freedom
# Null hypothesis probability =   9.237834e-02

Photon flux (15-150 keV)    in 3 sec:  (    ) ph/cm2/s
Energy fluence (15-150 keV)             : 5.95872e-08 ( 0  0 ) ergs/cm2
S(25-50 keV) vs. S(50-100 keV) plot

S(25-50 keV)  = 1.75e-08
S(50-100 keV) = 2.21e-08
T90 vs. Hardness ratio plot
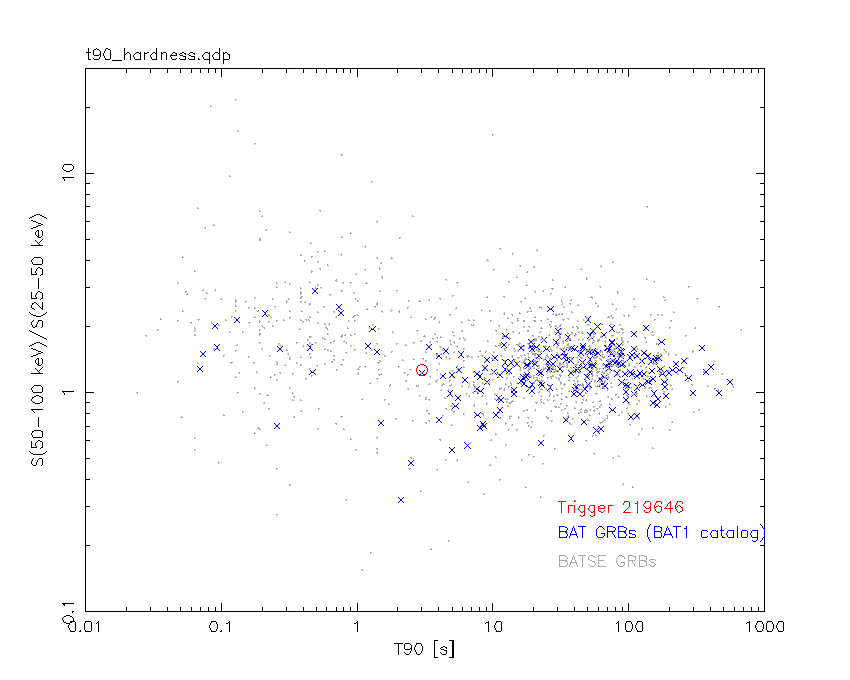
T90                                   = 3 sec.
Hardness ratio (energy fluence ratio) = 1.26286
Color vs. Color plot

Count Ratio  (25-50 keV) / (15-25 keV) = 1.47277
Count Ratio (50-100 keV) / (15-25 keV) = 0.740353
Mask shadow pattern
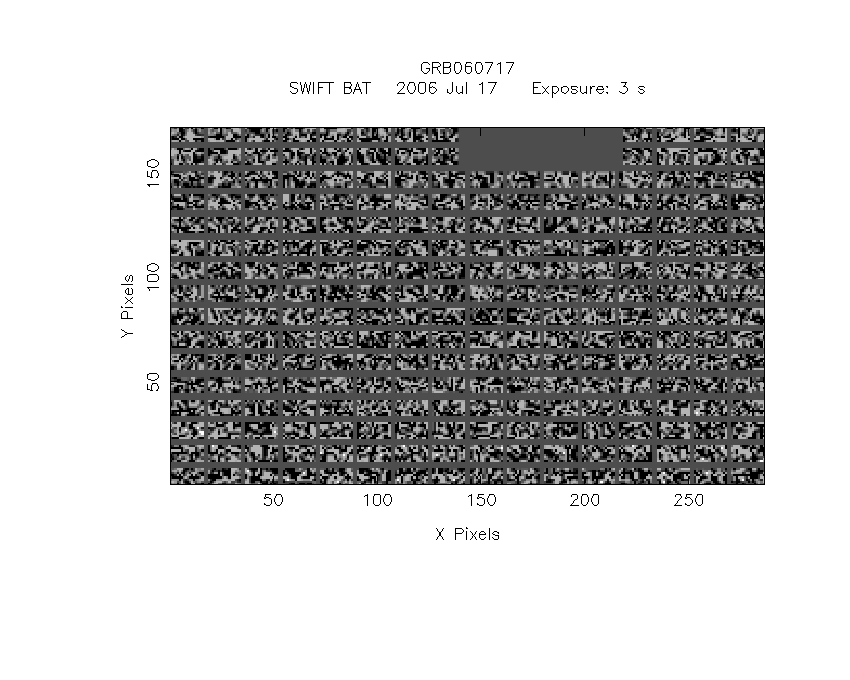
IMX = -1.497713022709813E-01, IMY = 1.752550698408311E-01
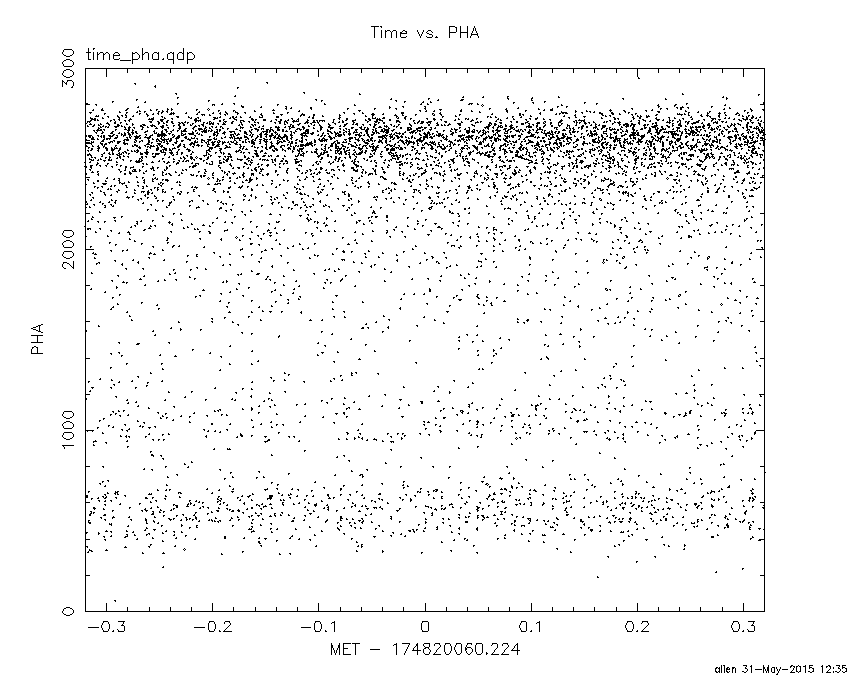
TIME vs. PHA plot around the trigger time
TIME vs. DetID plot around the trigger time

100 us light curve (15-350 keV)

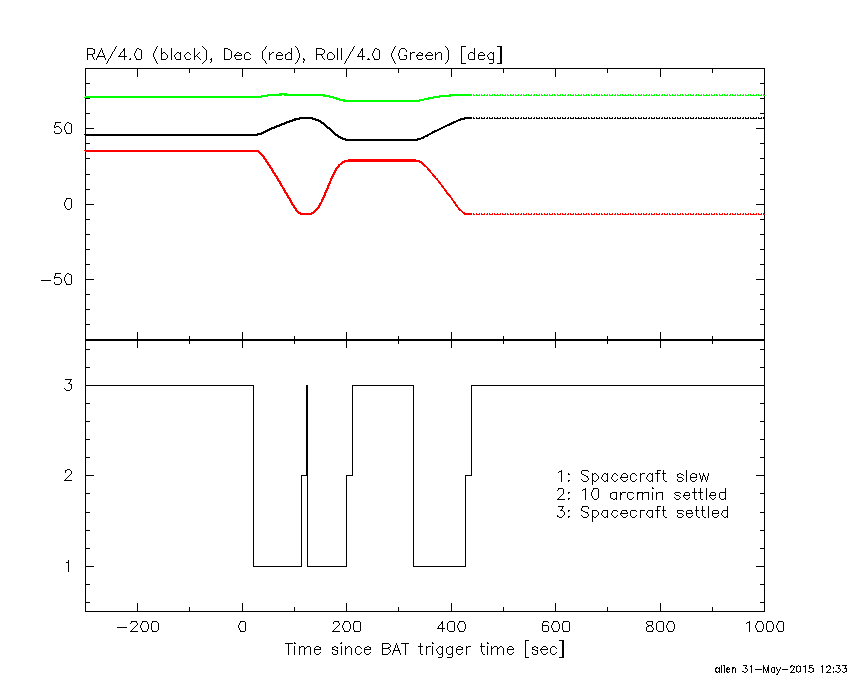
Spacecraft aspect plot
Bright source in the pre-burst/pre-slew/post-slew images
Pre-burst image of 15-350 keV band
Time interval of the image:
-239.224000 -0.224000

# RAcent  DECcent POSerr Theta    Phi  PeakCts   SNR AngSep     Name
#  [deg]    [deg]    ['] [deg]  [deg]                   [']
198.2285 -11.8471    2.9  49.3  148.0   2.6543   4.0 ------	UNKNOWN
188.1816   3.5067    2.7  32.3  158.7   0.9280   4.3 ------	UNKNOWN
166.1888  38.1875    2.0  14.5  -88.0   0.9531   5.9 ------	UNKNOWN
121.8879  56.3594    2.9  46.0  -56.6   3.3401   4.0 ------	UNKNOWN
Pre-slew background subtracted image of 15-350 keV band
Time interval of the image:
-0.224000 2.776000

# RAcent  DECcent POSerr Theta    Phi  PeakCts   SNR AngSep     Name
#  [deg]    [deg]    ['] [deg]  [deg]                   [']
170.8546  28.9692    1.5  13.0 -130.5   0.1132   7.5 ------	UNKNOWN
 99.9677  73.9814    2.9  54.4  -33.4   0.3014   4.0 ------	UNKNOWN
Post-slew image of 15-350 keV band
Time interval of the image:
113.076590 125.676600

# RAcent  DECcent POSerr Theta    Phi  PeakCts   SNR AngSep     Name
#  [deg]    [deg]    ['] [deg]  [deg]                   [']
245.0217 -15.6685    1.0  19.1  101.4   0.4420  11.8    3.0	Sco X-1
254.4791  35.4268    7.4  48.9   10.4   0.1428   1.5    5.2	Her X-1
256.1329 -37.8305    4.9  40.4  126.3   0.2177   2.4    7.0	4U 1700-377
256.5278 -36.5477   22.6  39.8  124.5   0.0483   0.5    8.7	GX 349+2
263.0074 -24.7644   35.5  38.2  103.8   0.0384   0.3    1.1	GX 1+4
268.3683  -1.3748    4.8  40.7   65.9  -0.3075  -2.4    4.7	SW J1753.5-0127
233.7346 -45.2038    2.3  39.0  154.9   0.2773   4.9 ------	UNKNOWN
219.7494 -25.5851    2.5  20.6 -177.2   0.1370   4.6 ------	UNKNOWN
235.9023  51.3323    1.9  58.3  -12.7   1.1707   6.2 ------	UNKNOWN
178.9688 -22.8464    2.4  49.8 -133.0   0.7344   4.7 ------	UNKNOWN
Plot creation:
Sun May 31 12:35:49 EDT 2015