Click here for the BAT GCN circular template
Image
Pre-slew 15.0-350.0 keV image (Event data)

#   RAcent    DECcent   POSerr    Theta     Phi              Peak Cts       SNR   Name
   18.4145   -48.3766   0.0090    35.0071   -20.2205         0.8312295     21.368 TRIG_00220020

Foreground time interval of the image:
 -0.320  10.229 (delta_t =  10.549 [sec])
Background time interval of the image:
-239.272  -0.320 (delta_t = 238.952 [sec])
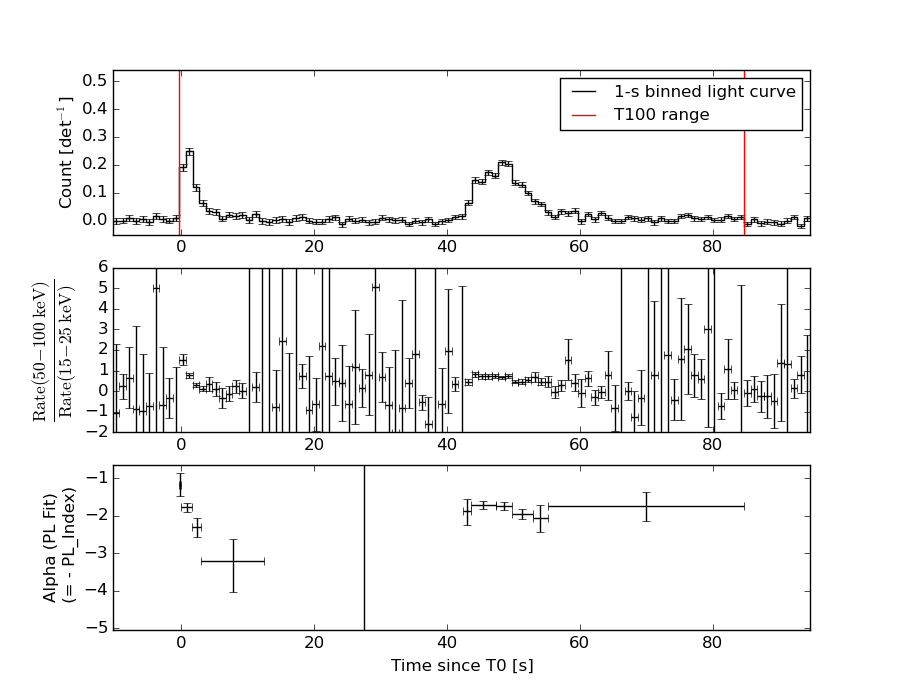
Lightcurves
Notes:
- 1) The mask-weighted light curves are using the flight position.
- 2) Multiple plots of different time binning/intervals are shown to cover all scenarios of short/long GRBs, rate/image triggers, and real/false positives.
- 3) For all the mask-weighted lightcurves, the y-axis units are counts/sec/det where a det is 0.4 x 0.4 = 0.16 sq cm.
- 4) The verticle lines correspond to following: green dotted lines are T50 interval, black dotted lines are T90 interval, blue solid line(s) is a spacecraft slew start time, and orange solid line(s) is a spacecraft slew end time.
- 5) Time of each bin is in the middle of the bin.
1 s binning
From T0-310 s to T0+310 s

From T100_start - 20 s to T100_end + 30 s

Full time interval

64 ms binning
Full time interval
From T100_start to T100_end

From T0-5 sec to T0+5 sec
16 ms binning
From T100_start-5 s to T100_start+5 s

Blue+Cyan dotted lines: Time interval of the scaled map
From 0.000000 to 0.512000
8 ms binning
From T100_start-3 s to T100_start+3 s

Blue+Cyan dotted lines: Time interval of the scaled map
From 0.000000 to 0.512000
2 ms binning
From T100_start-1 s to T100_start+1 s

Blue+Cyan dotted lines: Time interval of the scaled map
From 0.000000 to 0.512000
SN=5 or 10 sec. binning (whichever binning is satisfied first)
SN=5 or 10 sec. binning (T < 200 sec)

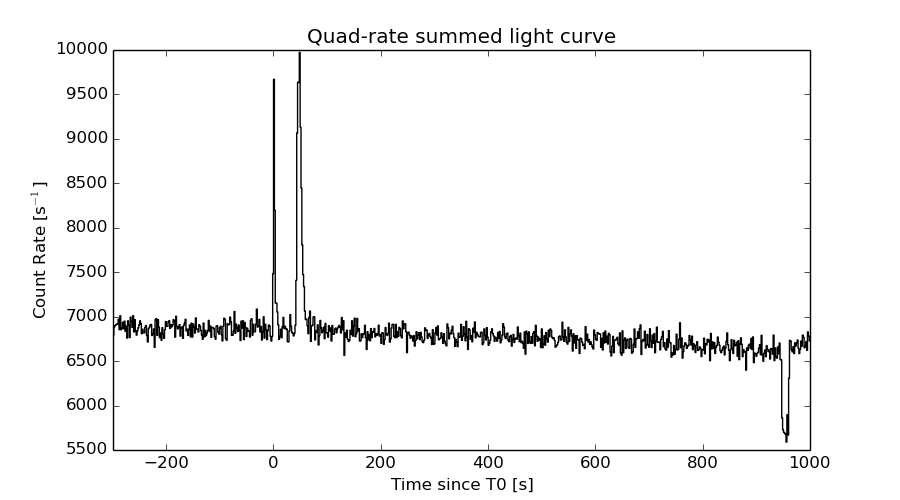
Quad-rate summed light curves (from T0-300s to T0+1000s)
Spectral Evolution
Spectra
Notes:
- 1) The fitting includes the systematic errors.
- 2) When the burst includes telescope slew time periods, the fitting uses an average response file made from multiple 5-s response files through out the slew time plus single time preiod for the non-slew times, and weighted by the total counts in the corresponding time period using addrmf. An average response file is needed becuase a spectral fit using the pre-slew DRM will introduce some errors in both a spectral shape and a normalization if the PHA file contains a lot of the slew/post-slew time interval.
- 3) For fits to more complicated models (e.g. a power-law over a cutoff power-law), the BAT team has decided to require a chi-square improvement of more than 6 for each extra dof.
Time averaged spectrum fit using the average DRM
Power-law model
Time interval is from   -0.320 sec. to   84.640 sec.

Spectral model in power-law:
------------------------------------------------------------
Parameters  : value       lower 90%   higher 90%
Photon index: 1.89140     ( -0.101241   0.103283 )
Norm@50keV  : 1.96483E-03    ( -0.000117881   0.000116649 )
------------------------------------------------------------
#Fit statistic : Chi-Squared =          61.67 using 59 PHA bins.
# Reduced chi-squared =          1.082 for     57 degrees of freedom
# Null hypothesis probability =   3.127441e-01

Photon flux (15-150 keV)    in 84.96 sec: 0.280950 ( -0.0149616  0.0149855 ) ph/cm2/s
Energy fluence (15-150 keV)             : 1.53463e-06 ( -9.07908e-08  9.1569e-08 ) ergs/cm2
Cutoff power-law model

Time interval is from   -0.320 sec. to   84.640 sec.
Spectral model in the cutoff power-law:
------------------------------------------------------------
Parameters  : value       lower 90%   higher 90%
Photon index: 1.67338     ( -0.407235   0.368781 )
Epeak [keV] : 68.5564      ( -22.493 -68.5564 )
Norm@50keV  : 2.57164E-03    ( -0.000375774   0.00163573 )
------------------------------------------------------------
#Fit statistic : Chi-Squared =          60.69 using 59 PHA bins.
# Reduced chi-squared =          1.084 for     56 degrees of freedom
# Null hypothesis probability =   3.107822e-01

Photon flux (15-150 keV)    in 84.96 sec: 0.277228 ( -0.016182  0.01618 ) ph/cm2/s
Energy fluence (15-150 keV)             : 1.50175e-06 ( -1.06863e-07  1.04807e-07 ) ergs/cm2
Band function

Time interval is from   -0.320 sec. to   84.640 sec.

Spectral model in the Band function:
------------------------------------------------------------
Parameters  : value       lower 90%   higher 90%
alpha       : -1.67343   ( 1.63161   0.375258 )
beta        : -10.0000    ( 10   1.77636e-15 )
Epeak [keV] : 68.5502      ( -23.1503 -68.5502 )
Norm@50keV   : 2.57093E-03    ( -0.000699288   0.00163742 )
------------------------------------------------------------
#Fit statistic : Chi-Squared =          60.69 using 59 PHA bins.
# Reduced chi-squared =          1.103 for     55 degrees of freedom
# Null hypothesis probability =   2.784043e-01

Photon flux (15-150 keV)    in 84.96 sec: 0.277693 (    ) ph/cm2/s
Energy fluence (15-150 keV)             : 1.51632e-06 ( 0  0 ) ergs/cm2
Single BB

Spectral model blackbody:
------------------------------------------------------------
Parameters  : value    Lower 90%  Upper 90%
kT [keV]    : 11.4355  (  )
R^2/D10^2   : 7.58855E-02  (   )
(R is the radius in km and D10 is the distance to the source in units of 10 kpc)
------------------------------------------------------------
#Fit statistic : Chi-Squared =         147.91 using 59 PHA bins.
# Reduced chi-squared =         2.5950 for     57 degrees of freedom
# Null hypothesis probability =   5.201889e-10

Energy  Fluence     90% Error
[keV]   [erg/cm2]   [erg/cm2]
15- 25  1.773e-07   1.640e-08
25- 50  5.266e-07   3.071e-08
50-150  4.004e-07   5.238e-08
15-150  1.104e-06   6.967e-08
Thermal bremsstrahlung (OTTB)

Spectral model: thermal bremsstrahlung
------------------------------------------------------------
Parameters  : value         Lower 90%    Upper 90%
kT [keV]    : 87.5178       (-15.4811      21.308)
Norm        : 1.26298       (-0.101304     0.11551)
------------------------------------------------------------
#Fit statistic : Chi-Squared =          62.99 using 59 PHA bins.
# Reduced chi-squared =          1.105 for     57 degrees of freedom
# Null hypothesis probability =   2.728490e-01

Energy  Fluence     90% Error
[keV]   [erg/cm2]   [erg/cm2]
15- 25  2.797e-07   2.417e-08
25- 50  4.702e-07   2.630e-08
50-150  7.036e-07   2.039e-07
15-150  1.453e-06   2.048e-07
Double BB

Spectral model: bbodyrad<1> + bbodyrad<2>
------------------------------------------------------------
Parameters  : value         Lower 90%    Upper 90%
kT1 [keV]   : 5.45476        (-0.916232      1.09103)
R1^2/D10^2  : 0.863899        (-0.422759      0.951155)
kT2 [keV]   : 19.8330        (-2.95746      4.50803)
R2^2/D10^2  : 7.54600E-03    (-0.00414982   0.0068273)
------------------------------------------------------------
#Fit statistic : Chi-Squared =          63.14 using 59 PHA bins.
# Reduced chi-squared =          1.148 for     55 degrees of freedom
# Null hypothesis probability =   2.107616e-01

Energy  Fluence     90% Error
[keV]   [erg/cm2]   [erg/cm2]
15- 25  2.985e-07   5.463e-08
25- 50  4.426e-07   7.141e-08
50-150  7.159e-07   1.698e-07
15-150  1.457e-06   2.324e-07
Peak spectrum fit
Power-law model

Time interval is from    0.372 sec. to    1.372 sec.

Spectral model in power-law:
------------------------------------------------------------
Parameters  : value       lower 90%   higher 90%
Photon index: 1.79372     ( -0.136653   0.140988 )
Norm@50keV  : 1.62239E-02    ( -0.00148823   0.00147248 )
------------------------------------------------------------
#Fit statistic : Chi-Squared =          66.36 using 59 PHA bins.
# Reduced chi-squared =          1.164 for     57 degrees of freedom
# Null hypothesis probability =   1.854704e-01

Photon flux (15-150 keV)    in 1 sec: 2.23020 ( -0.186421  0.18657 ) ph/cm2/s
Energy fluence (15-150 keV)             : 1.49394e-07 ( -1.39163e-08  1.40352e-08 ) ergs/cm2
Cutoff power-law model

Time interval is from    0.372 sec. to    1.372 sec.
Spectral model in the cutoff power-law:
------------------------------------------------------------
Parameters  : value       lower 90%   higher 90%
Photon index: 0.678409     ( -0.722361   0.624813 )
Epeak [keV] : 54.8298      ( -8.17846 15.8938 )
Norm@50keV  : 6.44528E-02    ( -0.0342457   0.0919922 )
------------------------------------------------------------
#Fit statistic : Chi-Squared =          56.15 using 59 PHA bins.
# Reduced chi-squared =          1.003 for     56 degrees of freedom
# Null hypothesis probability =   4.692237e-01

Photon flux (15-150 keV)    in 1 sec: 2.14900 ( -0.19147  0.19164 ) ph/cm2/s
Energy fluence (15-150 keV)             : 1.3909e-07 ( -1.4671e-08  1.5026e-08 ) ergs/cm2
Band function

Time interval is from    0.372 sec. to    1.372 sec.

Spectral model in the Band function:
------------------------------------------------------------
Parameters  : value       lower 90%   higher 90%
alpha       : -0.710275   ( -0.578799   0.630963 )
beta        : -9.37045    ( 9.37158   19.3716 )
Epeak [keV] : 55.4153      ( -8.65008 15.3573 )
Norm@50keV   : 6.16521E-02    ( -0.0310582   3.28149 )
------------------------------------------------------------
#Fit statistic : Chi-Squared =          56.16 using 59 PHA bins.
# Reduced chi-squared =          1.021 for     55 degrees of freedom
# Null hypothesis probability =   4.311548e-01

Photon flux (15-150 keV)    in 1 sec: 2.15227 (    ) ph/cm2/s
Energy fluence (15-150 keV)             : 1.38963e-07 ( 0  0 ) ergs/cm2
Single BB

Spectral model blackbody:
------------------------------------------------------------
Parameters  : value    Lower 90%  Upper 90%
kT [keV]    : 12.2610  (-1.12275  1.23484)
R^2/D10^2   : 0.514087  (-0.154438   0.219799)
(R is the radius in km and D10 is the distance to the source in units of 10 kpc)
------------------------------------------------------------
#Fit statistic : Chi-Squared =          75.12 using 59 PHA bins.
# Reduced chi-squared =          1.318 for     57 degrees of freedom
# Null hypothesis probability =   5.413644e-02

Energy  Fluence     90% Error
[keV]   [erg/cm2]   [erg/cm2]
15- 25  1.637e-08   2.680e-09
25- 50  5.282e-08   5.375e-09
50-150  4.843e-08   9.050e-09
15-150  1.176e-07   1.190e-08
Thermal bremsstrahlung (OTTB)

Spectral model: thermal bremsstrahlung
------------------------------------------------------------
Parameters  : value         Lower 90%    Upper 90%
kT [keV]    : 99.1195       (-23.8783      38.095)
Norm        : 9.99700       (-1.08615     1.23681)
------------------------------------------------------------
#Fit statistic : Chi-Squared =          58.78 using 59 PHA bins.
# Reduced chi-squared =          1.031 for     57 degrees of freedom
# Null hypothesis probability =   4.100794e-01

Energy  Fluence     90% Error
[keV]   [erg/cm2]   [erg/cm2]
15- 25  2.613e-08   3.540e-09
25- 50  4.510e-08   3.990e-09
50-150  7.272e-08   2.492e-08
15-150  1.439e-07   2.825e-08
Double BB

Spectral model: bbodyrad<1> + bbodyrad<2>
------------------------------------------------------------
Parameters  : value         Lower 90%    Upper 90%
kT1 [keV]   : 6.33887        (-1.90177      2.17117)
R1^2/D10^2  : 3.08833        (-1.8112      6.69007)
kT2 [keV]   : 18.1028        (-3.34482      6.47912)
R2^2/D10^2  : 8.97150E-02    (-0.0668349   0.130319)
------------------------------------------------------------
#Fit statistic : Chi-Squared =          55.47 using 59 PHA bins.
# Reduced chi-squared =          1.009 for     55 degrees of freedom
# Null hypothesis probability =   4.569743e-01

Energy  Fluence     90% Error
[keV]   [erg/cm2]   [erg/cm2]
15- 25  2.365e-08   1.144e-08
25- 50  4.721e-08   1.937e-08
50-150  6.728e-08   3.539e-08
15-150  1.381e-07   6.096e-08
Pre-slew spectrum (Pre-slew PHA with pre-slew DRM)
Power-law model

Spectral model in power-law:
------------------------------------------------------------
Parameters  : value       lower 90%   higher 90%
Photon index: 2.07307     ( -0.14361   0.15009 )
Norm@50keV  : 4.35011E-03    ( -0.000422824   0.000415603 )
------------------------------------------------------------
#Fit statistic : Chi-Squared =          49.97 using 59 PHA bins.
# Reduced chi-squared =         0.8766 for     57 degrees of freedom
# Null hypothesis probability =   7.338871e-01

Photon flux (15-150 keV)    in 10.55 sec: 0.675430 ( -0.0524815  0.0525239 ) ph/cm2/s
Energy fluence (15-150 keV)             : 4.25358e-07 ( -3.77534e-08  3.82352e-08 ) ergs/cm2
Cutoff power-law model
Spectral model in the cutoff power-law:
------------------------------------------------------------
Parameters  : value       lower 90%   higher 90%
Photon index: 1.35712     ( -0.698272   0.596809 )
Epeak [keV] : 38.5190      (   )
Norm@50keV  : 1.10223E-02    (     )
------------------------------------------------------------
#Fit statistic : Chi-Squared =          45.64 using 59 PHA bins.
# Reduced chi-squared =         0.8150 for     56 degrees of freedom
# Null hypothesis probability =   8.370673e-01

Photon flux (15-150 keV)    in 10.55 sec: 0.655019 ( -0.054946  0.054982 ) ph/cm2/s
Energy fluence (15-150 keV)             : 4.00245e-07 ( -4.16409e-08  4.29733e-08 ) ergs/cm2
Band function

Spectral model in the Band function:
------------------------------------------------------------
Parameters  : value       lower 90%   higher 90%
alpha       : -1.35714   ( -0.606248   0.659881 )
beta        : -10.0000    ( 10   3.90799e-14 )
Epeak [keV] : 38.5152      ( -15.2394 12.0562 )
Norm@50keV   : 1.10198E-02    ( -0.00584919   0.0163133 )
------------------------------------------------------------
#Fit statistic : Chi-Squared =          45.64 using 59 PHA bins.
# Reduced chi-squared =         0.8299 for     55 degrees of freedom
# Null hypothesis probability =   8.116429e-01

Photon flux (15-150 keV)    in 10.55 sec: 0.659789 ( 6.34021  -0.060959 ) ph/cm2/s
Energy fluence (15-150 keV)             : 4.0194e-07 ( -4.01866e-07  -4.39239e-08 ) ergs/cm2
S(25-50 keV) vs. S(50-100 keV) plot
S(25-50 keV)  = 4.46e-07
S(50-100 keV) = 4.81e-07
T90 vs. Hardness ratio plot

T90                                   = 66.9200000166893 sec.
Hardness ratio (energy fluence ratio) = 1.07848
Color vs. Color plot
Count Ratio  (25-50 keV) / (15-25 keV) = 1.05066
Count Ratio (50-100 keV) / (15-25 keV) = 0.618359
Mask shadow pattern
IMX = 6.572256370581792E-01, IMY = 2.420794765686918E-01
TIME vs. PHA plot around the trigger time

Blue+Cyan dotted lines: Time interval of the scaled map
From 0.000000 to 0.512000
TIME vs. DetID plot around the trigger time

Blue+Cyan dotted lines: Time interval of the scaled map
From 0.000000 to 0.512000
100 us light curve (15-350 keV)
Blue+Cyan dotted lines: Time interval of the scaled map
From 0.000000 to 0.512000
Spacecraft aspect plot
Bright source in the pre-burst/pre-slew/post-slew images
Pre-burst image of 15-350 keV band
Time interval of the image:
-239.272000 -0.320000

# RAcent  DECcent POSerr Theta    Phi  PeakCts   SNR AngSep     Name
#  [deg]    [deg]    ['] [deg]  [deg]                   [']
327.5796  -5.4723    3.3  31.4  114.3   0.8654   3.5 ------	UNKNOWN
337.9028 -58.3875    2.8  42.9   19.3   1.2510   4.2 ------	UNKNOWN
348.7252 -60.5391    2.3  43.0   10.7   1.3372   5.0 ------	UNKNOWN
356.3194  -3.9006    2.7  14.1 -178.8   0.5751   4.3  321.7	UNKNOWN
  1.1253  23.0464    2.6  41.2 -169.8   0.9735   4.5 ------	UNKNOWN
  8.2549   2.7431    2.3  23.4 -146.4   0.7848   5.1  521.7	UNKNOWN
 16.2479 -34.1587    2.4  23.5  -38.1   0.7017   4.8 ------	UNKNOWN
Pre-slew background subtracted image of 15-350 keV band
Time interval of the image:
-0.320000 10.228600

# RAcent  DECcent POSerr Theta    Phi  PeakCts   SNR AngSep     Name
#  [deg]    [deg]    ['] [deg]  [deg]                   [']
318.1055  -3.5716    2.6  40.8  110.5   0.5657   4.5 ------	UNKNOWN
324.8817 -49.7230    2.3  41.0   36.4   0.3373   5.0 ------	UNKNOWN
335.7078   0.3556    2.0  27.9  133.3   0.2286   5.7 ------	UNKNOWN
 18.4145 -48.3766    0.5  35.0  -20.2   0.8312  21.4 ------	UNKNOWN
Post-slew image of 15-350 keV band
Time interval of the image:
65.628600 937.228890

# RAcent  DECcent POSerr Theta    Phi  PeakCts   SNR AngSep     Name
#  [deg]    [deg]    ['] [deg]  [deg]                   [']
 10.1518   5.3307    3.0  54.2  176.9   5.1162   3.8 ------	UNKNOWN
 26.8378 -56.3215    2.4   9.4  -22.6   1.5890   4.7 ------	UNKNOWN
 70.6445 -39.5603    4.0  37.8  -76.4   3.1101   2.9 ------	UNKNOWN
Plot creation:
Sun May 31 12:33:43 EDT 2015