Special notes of this burst
Image
Pre-slew 15.0-350.0 keV image (Event data)

#   RAcent    DECcent   POSerr    Theta     Phi              Peak Cts       SNR   Name
   16.6392   -41.3882   0.0341     7.1288   158.1110         0.3681373      5.672 TRIG_00221627

Foreground time interval of the image:
  0.000  64.000 (delta_t =  64.000 [sec])
Background time interval of the image:
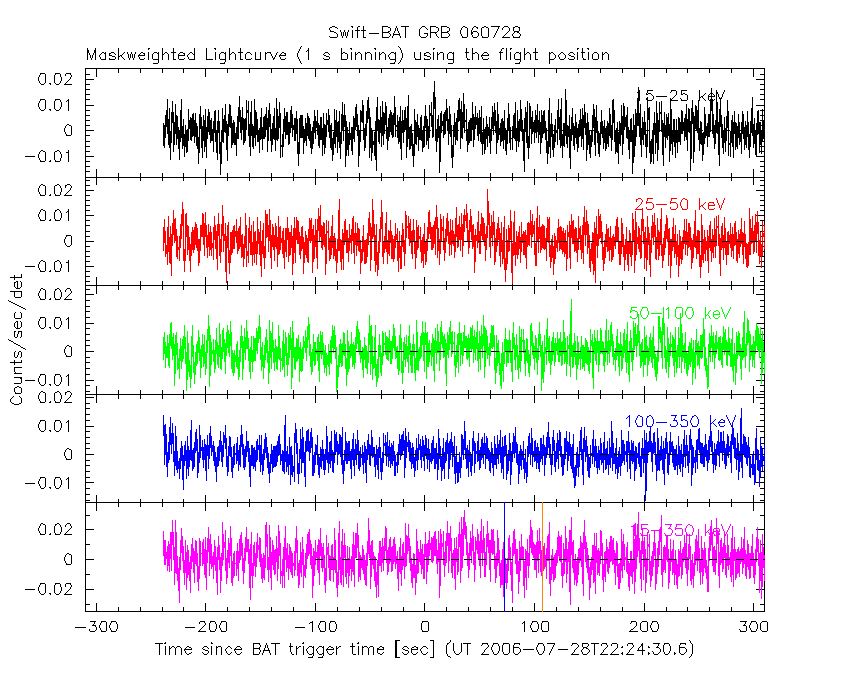
Lightcurves
Notes:
- 1) The mask-weighted light curves are using the flight position.
- 2) Multiple plots of different time binning/intervals are shown to cover all scenarios of short/long GRBs, rate/image triggers, and real/false positives.
- 3) For all the mask-weighted lightcurves, the y-axis units are counts/sec/det where a det is 0.4 x 0.4 = 0.16 sq cm.
- 4) The verticle lines correspond to following: green dotted lines are T50 interval, black dotted lines are T90 interval, blue solid line(s) is a spacecraft slew start time, and orange solid line(s) is a spacecraft slew end time.
- 5) Time of each bin is in the middle of the bin.
1 s binning
From T0-310 s to T0+310 s
From T100_start - 20 s to T100_end + 30 s

Full time interval

64 ms binning
Full time interval

From T100_start to T100_end

From T0-5 sec to T0+5 sec

16 ms binning
From T100_start-5 s to T100_start+5 s

Blue+Cyan dotted lines: Time interval of the scaled map
From 0.000000 to 64.000000
8 ms binning
From T100_start-3 s to T100_start+3 s

Blue+Cyan dotted lines: Time interval of the scaled map
From 0.000000 to 64.000000
2 ms binning
From T100_start-1 s to T100_start+1 s

Blue+Cyan dotted lines: Time interval of the scaled map
From 0.000000 to 64.000000
SN=5 or 10 sec. binning (whichever binning is satisfied first)

SN=5 or 10 sec. binning (T < 200 sec)

Quad-rate summed light curves (from T0-300s to T0+1000s)

Spectral Evolution

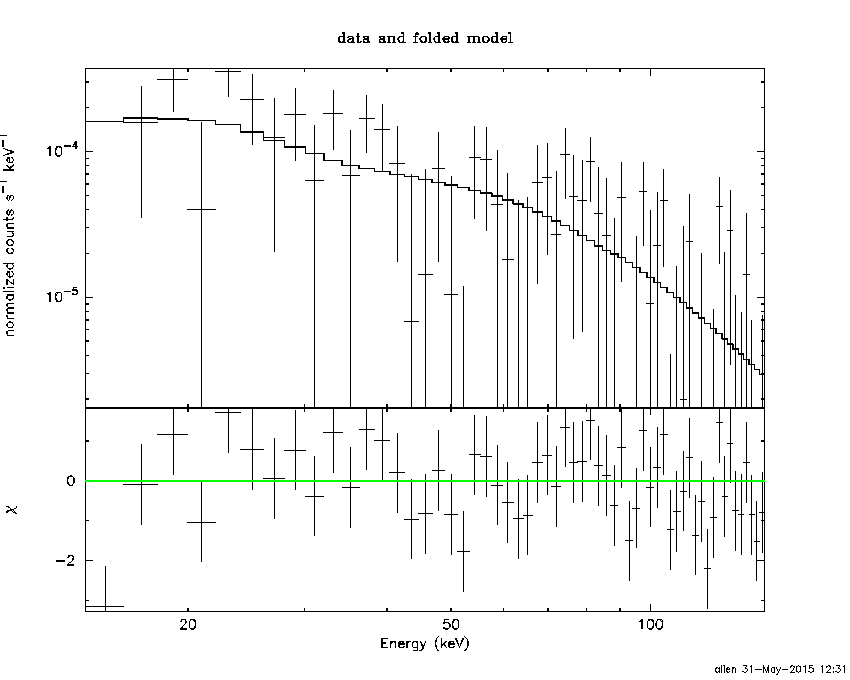
Spectra
Notes:
- 1) The fitting includes the systematic errors.
- 2) When the burst includes telescope slew time periods, the fitting uses an average response file made from multiple 5-s response files through out the slew time plus single time preiod for the non-slew times, and weighted by the total counts in the corresponding time period using addrmf. An average response file is needed becuase a spectral fit using the pre-slew DRM will introduce some errors in both a spectral shape and a normalization if the PHA file contains a lot of the slew/post-slew time interval.
- 3) For fits to more complicated models (e.g. a power-law over a cutoff power-law), the BAT team has decided to require a chi-square improvement of more than 6 for each extra dof.
Time averaged spectrum fit using the average DRM
Power-law model

Time interval is from    0.000 sec. to   64.000 sec.

Spectral model in power-law:
------------------------------------------------------------
Parameters  : value       lower 90%   higher 90%
Photon index: 1.43792     ( -0.433959   0.438168 )
Norm@50keV  : 3.62584E-04    ( -0.000102864   0.000101693 )
------------------------------------------------------------
#Fit statistic : Chi-Squared =          60.33 using 59 PHA bins.
# Reduced chi-squared =          1.058 for     57 degrees of freedom
# Null hypothesis probability =   3.563585e-01

Photon flux (15-150 keV)    in 64 sec: 4.45488E-02 ( -0.0121249  0.0121432 ) ph/cm2/s
Energy fluence (15-150 keV)             : 2.22624e-07 ( -6.79891e-08  7.09037e-08 ) ergs/cm2
Cutoff power-law model

Time interval is from    0.000 sec. to   64.000 sec.
Spectral model in the cutoff power-law:
------------------------------------------------------------
Parameters  : value       lower 90%   higher 90%
Photon index: 0.171357     ( -2.72171   1.44285 )
Epeak [keV] : 64.5468      ( -25.7322 -64.653 )
Norm@50keV  : 1.81756E-03    ( -0.00178927   0.0953679 )
------------------------------------------------------------
#Fit statistic : Chi-Squared =          58.38 using 59 PHA bins.
# Reduced chi-squared =          1.042 for     56 degrees of freedom
# Null hypothesis probability =   3.880040e-01

Photon flux (15-150 keV)    in 64 sec: 4.29021E-02 ( -0.0119693  0.0121865 ) ph/cm2/s
Energy fluence (15-150 keV)             : 1.96491e-07 ( -7.11411e-08  7.75411e-08 ) ergs/cm2
Band function

Time interval is from    0.000 sec. to   64.000 sec.

Spectral model in the Band function:
------------------------------------------------------------
Parameters  : value       lower 90%   higher 90%
alpha       : 5.00000   ( -5.22157   -5 )
beta        : -2.04195    ( -1.45899   0.678848 )
Epeak [keV] : 31.6748      ( -9.2843 9.22275 )
Norm@50keV   : 10.7739    ( -2.74239   73.1745 )
------------------------------------------------------------
#Fit statistic : Chi-Squared =          55.64 using 59 PHA bins.
# Reduced chi-squared =          1.012 for     55 degrees of freedom
# Null hypothesis probability =   4.505433e-01

Photon flux (15-150 keV)    in 64 sec:  (    ) ph/cm2/s
Energy fluence (15-150 keV)             : 0 ( 0  0 ) ergs/cm2
Single BB

Spectral model blackbody:
------------------------------------------------------------
Parameters  : value    Lower 90%  Upper 90%
kT [keV]    : 12.8348  (-3.98046  6.67871)
R^2/D10^2   : 9.05926E-03  (-0.0068622   0.0249442)
(R is the radius in km and D10 is the distance to the source in units of 10 kpc)
------------------------------------------------------------
#Fit statistic : Chi-Squared =          60.16 using 59 PHA bins.
# Reduced chi-squared =          1.055 for     57 degrees of freedom
# Null hypothesis probability =   3.620151e-01

Energy  Fluence     90% Error
[keV]   [erg/cm2]   [erg/cm2]
15- 25  2.026e-08   1.237e-08
25- 50  6.881e-08   3.912e-08
50-150  7.112e-08   4.611e-08
15-150  1.602e-07   8.026e-08
Thermal bremsstrahlung (OTTB)

Spectral model: thermal bremsstrahlung
------------------------------------------------------------
Parameters  : value         Lower 90%    Upper 90%
kT [keV]    : 199.363       (-199.363      -199.363)
Norm        : 0.184247       (-0.0494656     0.0495132)
------------------------------------------------------------
#Fit statistic : Chi-Squared =          59.60 using 59 PHA bins.
# Reduced chi-squared =          1.046 for     57 degrees of freedom
# Null hypothesis probability =   3.811356e-01

Energy  Fluence     90% Error
[keV]   [erg/cm2]   [erg/cm2]
15- 25  2.936e-08   1.767e-08
25- 50  5.648e-08   3.382e-08
50-150  1.239e-07   7.677e-08
15-150  2.097e-07   1.260e-07
Double BB

Spectral model: bbodyrad<1> + bbodyrad<2>
------------------------------------------------------------
Parameters  : value         Lower 90%    Upper 90%
kT1 [keV]   : 7.70772        (-3.12839      5.16636)
R1^2/D10^2  : 3.62137E-02        (-0.0299083      0.13175)
kT2 [keV]   : 25.5288        (-12.3526      -25.6468)
R2^2/D10^2  : 5.64895E-04    (-0.00055397   0.00637148)
------------------------------------------------------------
#Fit statistic : Chi-Squared =          56.74 using 59 PHA bins.
# Reduced chi-squared =          1.032 for     55 degrees of freedom
# Null hypothesis probability =   4.099305e-01

Energy  Fluence     90% Error
[keV]   [erg/cm2]   [erg/cm2]
15- 25  2.823e-08   1.809e-08
25- 50  6.284e-08   3.446e-08
50-150  1.210e-07   8.080e-08
15-150  2.121e-07   1.141e-07
Pre-slew spectrum (Pre-slew PHA with pre-slew DRM)
Power-law model
Spectral model in power-law:
------------------------------------------------------------
Parameters  : value       lower 90%   higher 90%
Photon index: 1.43792     ( -0.433959   0.438168 )
Norm@50keV  : 3.62584E-04    ( -0.000102864   0.000101693 )
------------------------------------------------------------
#Fit statistic : Chi-Squared =          60.33 using 59 PHA bins.
# Reduced chi-squared =          1.058 for     57 degrees of freedom
# Null hypothesis probability =   3.563585e-01

Photon flux (15-150 keV)    in 64 sec: 4.45488E-02 ( -0.0121249  0.0121432 ) ph/cm2/s
Energy fluence (15-150 keV)             : 2.22624e-07 ( -6.79891e-08  7.09037e-08 ) ergs/cm2
Cutoff power-law model

Spectral model in the cutoff power-law:
------------------------------------------------------------
Parameters  : value       lower 90%   higher 90%
Photon index: 0.171357     ( -2.72171   1.44285 )
Epeak [keV] : 64.5468      ( -25.7322 -64.653 )
Norm@50keV  : 1.81756E-03    ( -0.00178927   0.0953679 )
------------------------------------------------------------
#Fit statistic : Chi-Squared =          58.38 using 59 PHA bins.
# Reduced chi-squared =          1.042 for     56 degrees of freedom
# Null hypothesis probability =   3.880040e-01

Photon flux (15-150 keV)    in 64 sec: 4.29021E-02 ( -0.0119693  0.0121865 ) ph/cm2/s
Energy fluence (15-150 keV)             : 1.96491e-07 ( -7.11411e-08  7.75411e-08 ) ergs/cm2
Band function

Spectral model in the Band function:
------------------------------------------------------------
Parameters  : value       lower 90%   higher 90%
alpha       : 5.00000   ( -5.22157   -5 )
beta        : -2.04195    ( -1.45899   0.678848 )
Epeak [keV] : 31.6748      ( -9.2843 9.22275 )
Norm@50keV   : 10.7739    ( -2.74239   73.1745 )
------------------------------------------------------------
#Fit statistic : Chi-Squared =          55.64 using 59 PHA bins.
# Reduced chi-squared =          1.012 for     55 degrees of freedom
# Null hypothesis probability =   4.505433e-01

Photon flux (15-150 keV)    in 64 sec:  (    ) ph/cm2/s
Energy fluence (15-150 keV)             : 0 ( 0  0 ) ergs/cm2
S(25-50 keV) vs. S(50-100 keV) plot

S(25-50 keV)  = 5.33e-08
S(50-100 keV) = 7.88e-08
T90 vs. Hardness ratio plot

T90                                   = 64 sec.
Hardness ratio (energy fluence ratio) = 1.47842
Color vs. Color plot

Count Ratio  (25-50 keV) / (15-25 keV) = 1.64543
Count Ratio (50-100 keV) / (15-25 keV) = 1.06105
Mask shadow pattern

IMX = -1.160505753850820E-01, IMY = -4.662617973738296E-02
TIME vs. PHA plot around the trigger time

Blue+Cyan dotted lines: Time interval of the scaled map
From 0.000000 to 64.000000
TIME vs. DetID plot around the trigger time

Blue+Cyan dotted lines: Time interval of the scaled map
From 0.000000 to 64.000000
100 us light curve (15-350 keV)

Blue+Cyan dotted lines: Time interval of the scaled map
From 0.000000 to 64.000000
Spacecraft aspect plot

Bright source in the pre-burst/pre-slew/post-slew images
Pre-burst image of 15-350 keV band
Time interval of the image:
Pre-slew background subtracted image of 15-350 keV band
Time interval of the image:
0.000000 64.000000

# RAcent  DECcent POSerr Theta    Phi  PeakCts   SNR AngSep     Name
#  [deg]    [deg]    ['] [deg]  [deg]                   [']
284.0174 -76.9116    2.3  44.2    7.7   0.6405   4.9 ------	UNKNOWN
349.5082 -71.3565    2.6  26.6    9.0   0.3315   4.5 ------	UNKNOWN
 16.6425 -41.3842    2.2   7.1  158.1   0.3450   5.3 ------	UNKNOWN
Post-slew image of 15-350 keV band
Time interval of the image:
107.500590 901.400580

# RAcent  DECcent POSerr Theta    Phi  PeakCts   SNR AngSep     Name
#  [deg]    [deg]    ['] [deg]  [deg]                   [']
334.3824 -59.4648    2.4  31.6   41.7   2.0764   4.8 ------	UNKNOWN
Plot creation:
Sun May 31 12:31:45 EDT 2015