Click here for the BAT GCN circular template
Image
Pre-slew 15.0-350.0 keV image (Event data)
#   RAcent    DECcent   POSerr    Theta     Phi              Peak Cts       SNR   Name
  212.9847    16.9870   0.0145     9.0532   150.5733         0.0999093     13.256 TRIG_00222154

Foreground time interval of the image:
  0.040   0.588 (delta_t =   0.548 [sec])
Background time interval of the image:
-239.512   0.040 (delta_t = 239.552 [sec])
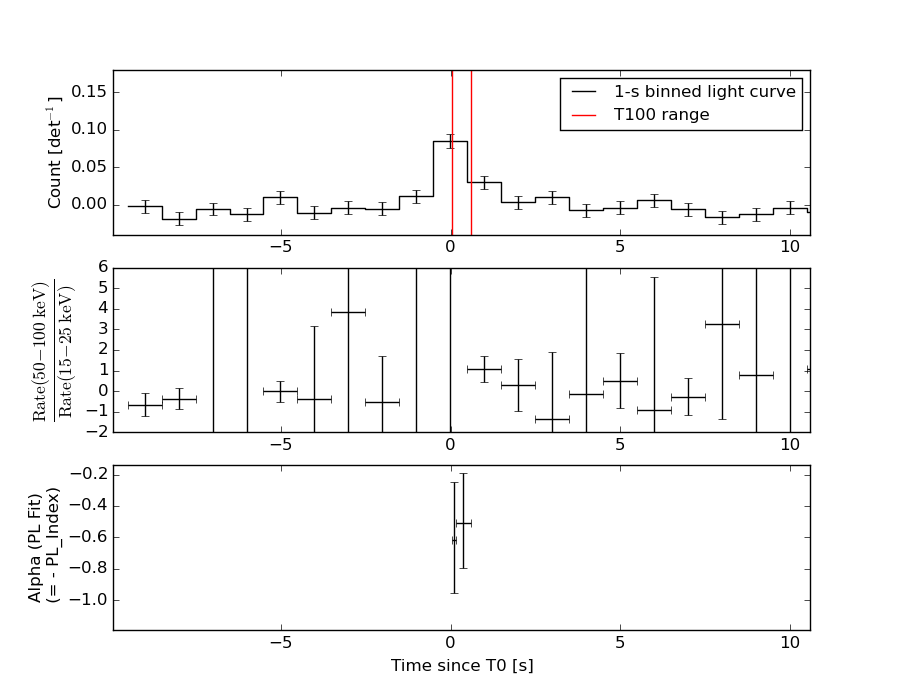
Lightcurves
Notes:
- 1) The mask-weighted light curves are using the flight position.
- 2) Multiple plots of different time binning/intervals are shown to cover all scenarios of short/long GRBs, rate/image triggers, and real/false positives.
- 3) For all the mask-weighted lightcurves, the y-axis units are counts/sec/det where a det is 0.4 x 0.4 = 0.16 sq cm.
- 4) The verticle lines correspond to following: green dotted lines are T50 interval, black dotted lines are T90 interval, blue solid line(s) is a spacecraft slew start time, and orange solid line(s) is a spacecraft slew end time.
- 5) Time of each bin is in the middle of the bin.
1 s binning
From T0-310 s to T0+310 s
From T100_start - 20 s to T100_end + 30 s

Full time interval

64 ms binning
Full time interval

From T100_start to T100_end

From T0-5 sec to T0+5 sec
16 ms binning
From T100_start-5 s to T100_start+5 s
Blue+Cyan dotted lines: Time interval of the scaled map
From 0.000000 to 0.512000
8 ms binning
From T100_start-3 s to T100_start+3 s

Blue+Cyan dotted lines: Time interval of the scaled map
From 0.000000 to 0.512000
2 ms binning
From T100_start-1 s to T100_start+1 s
Blue+Cyan dotted lines: Time interval of the scaled map
From 0.000000 to 0.512000
SN=5 or 10 sec. binning (whichever binning is satisfied first)
SN=5 or 10 sec. binning (T < 200 sec)
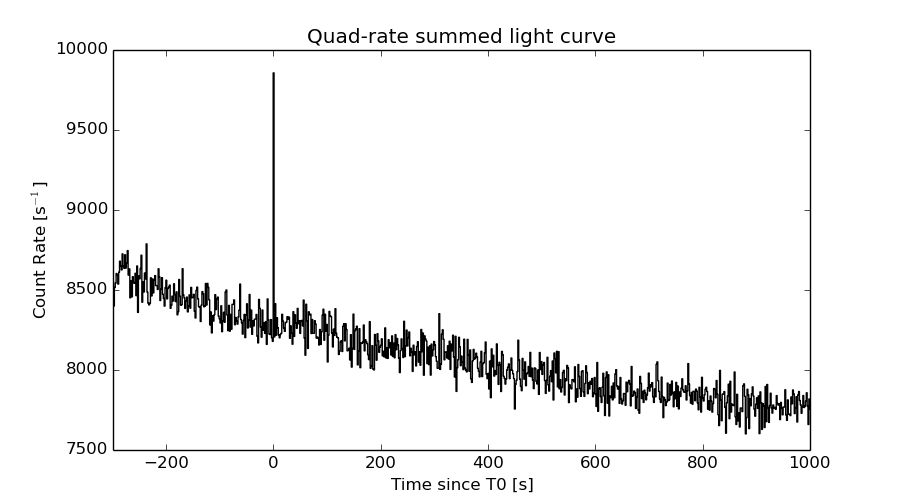
Quad-rate summed light curves (from T0-300s to T0+1000s)
Spectral Evolution
Spectra
Notes:
- 1) The fitting includes the systematic errors.
- 2) When the burst includes telescope slew time periods, the fitting uses an average response file made from multiple 5-s response files through out the slew time plus single time preiod for the non-slew times, and weighted by the total counts in the corresponding time period using addrmf. An average response file is needed becuase a spectral fit using the pre-slew DRM will introduce some errors in both a spectral shape and a normalization if the PHA file contains a lot of the slew/post-slew time interval.
- 3) For fits to more complicated models (e.g. a power-law over a cutoff power-law), the BAT team has decided to require a chi-square improvement of more than 6 for each extra dof.
Time averaged spectrum fit using the average DRM
Power-law model

Time interval is from    0.040 sec. to    0.588 sec.

Spectral model in power-law:
------------------------------------------------------------
Parameters  : value       lower 90%   higher 90%
Photon index: 0.483733     ( -0.241854   0.223854 )
Norm@50keV  : 1.08415E-02    ( -0.0015633   0.00152089 )
------------------------------------------------------------
#Fit statistic : Chi-Squared =          73.43 using 59 PHA bins.
# Reduced chi-squared =          1.288 for     57 degrees of freedom
# Null hypothesis probability =   7.042899e-02

Photon flux (15-150 keV)    in 0.548 sec: 1.28748 ( -0.162011  0.162626 ) ph/cm2/s
Energy fluence (15-150 keV)             : 8.04837e-08 ( -1.03694e-08  1.04179e-08 ) ergs/cm2
Cutoff power-law model
Time interval is from    0.040 sec. to    0.588 sec.
Spectral model in the cutoff power-law:
------------------------------------------------------------
Parameters  : value       lower 90%   higher 90%
Photon index: -0.282647     ( -1.28846   0.851148 )
Epeak [keV] : 190.293      (   )
Norm@50keV  : 2.16012E-02    (     )
------------------------------------------------------------
#Fit statistic : Chi-Squared =          71.74 using 59 PHA bins.
# Reduced chi-squared =          1.281 for     56 degrees of freedom
# Null hypothesis probability =   7.656385e-02

Photon flux (15-150 keV)    in 0.548 sec: 1.25491 ( -0.16793  0.16813 ) ph/cm2/s
Energy fluence (15-150 keV)             : 7.84358e-08 ( -1.13036e-08  1.1029e-08 ) ergs/cm2
Band function
Time interval is from    0.040 sec. to    0.588 sec.

Spectral model in the Band function:
------------------------------------------------------------
Parameters  : value       lower 90%   higher 90%
alpha       : -0.732912   ( 0.732986   0.732986 )
beta        : -0.483733    ( -0.223854   0.241851 )
Epeak [keV] : 23.3170      ( -23.3297 -23.3297 )
Norm@50keV   : 1.41585E-02    ( -0.00542825   133695 )
------------------------------------------------------------
#Fit statistic : Chi-Squared =          73.43 using 59 PHA bins.
# Reduced chi-squared =          1.335 for     55 degrees of freedom
# Null hypothesis probability =   4.906833e-02

Photon flux (15-150 keV)    in 0.548 sec:  (    ) ph/cm2/s
Energy fluence (15-150 keV)             : 0 ( 0  0 ) ergs/cm2
Single BB

Spectral model blackbody:
------------------------------------------------------------
Parameters  : value    Lower 90%  Upper 90%
kT [keV]    : 30.8704  (-5.23506  7.50076)
R^2/D10^2   : 1.92305E-02  (-0.00847923   0.0132063)
(R is the radius in km and D10 is the distance to the source in units of 10 kpc)
------------------------------------------------------------
#Fit statistic : Chi-Squared =          73.65 using 59 PHA bins.
# Reduced chi-squared =          1.292 for     57 degrees of freedom
# Null hypothesis probability =   6.810223e-02

Energy  Fluence     90% Error
[keV]   [erg/cm2]   [erg/cm2]
15- 25  1.543e-09   4.006e-10
25- 50  9.632e-09   2.261e-09
50-150  6.408e-08   1.428e-08
15-150  7.526e-08   1.591e-08
Thermal bremsstrahlung (OTTB)
Spectral model: thermal bremsstrahlung
------------------------------------------------------------
Parameters  : value         Lower 90%    Upper 90%
kT [keV]    : 199.363       (      )
Norm        : 4.56183       (     )
------------------------------------------------------------
#Fit statistic : Chi-Squared =         131.63 using 59 PHA bins.
# Reduced chi-squared =         2.3093 for     57 degrees of freedom
# Null hypothesis probability =   7.761147e-08

Energy  Fluence     90% Error
[keV]   [erg/cm2]   [erg/cm2]
15- 25  6.225e-09   3.551e-09
25- 50  1.197e-08   6.732e-09
50-150  2.626e-08   1.494e-08
15-150  4.446e-08   2.516e-08
Double BB

Spectral model: bbodyrad<1> + bbodyrad<2>
------------------------------------------------------------
Parameters  : value         Lower 90%    Upper 90%
kT1 [keV]   : 0.924344        (-0.917224      1.91321)
R1^2/D10^2  : 5.29194E+05        (-658689      3.1936e+10)
kT2 [keV]   : 31.2358        (-5.36678      7.7482)
R2^2/D10^2  : 1.85613E-02    (-0.00825552   0.00972449)
------------------------------------------------------------
#Fit statistic : Chi-Squared =          72.87 using 59 PHA bins.
# Reduced chi-squared =          1.325 for     55 degrees of freedom
# Null hypothesis probability =   5.373536e-02

Energy  Fluence     90% Error
[keV]   [erg/cm2]   [erg/cm2]
15- 25  1.679e-09   3.965e-10
25- 50  9.492e-09   2.310e-09
50-150  6.432e-08   1.574e-08
15-150  7.550e-08   1.643e-08
Peak spectrum fit
Power-law model
Time interval is from   -0.184 sec. to    0.816 sec.

Spectral model in power-law:
------------------------------------------------------------
Parameters  : value       lower 90%   higher 90%
Photon index: 0.530925     ( -0.289923   0.265293 )
Norm@50keV  : 6.48981E-03    ( -0.00108351   0.00104654 )
------------------------------------------------------------
#Fit statistic : Chi-Squared =          58.32 using 59 PHA bins.
# Reduced chi-squared =          1.023 for     57 degrees of freedom
# Null hypothesis probability =   4.264378e-01

Photon flux (15-150 keV)    in 1 sec: 0.764884 ( -0.111776  0.112354 ) ph/cm2/s
Energy fluence (15-150 keV)             : 8.58449e-08 ( -1.27909e-08  1.28641e-08 ) ergs/cm2
Cutoff power-law model

Time interval is from   -0.184 sec. to    0.816 sec.
Spectral model in the cutoff power-law:
------------------------------------------------------------
Parameters  : value       lower 90%   higher 90%
Photon index: 8.04163E-02     ( -1.50658   0.566851 )
Epeak [keV] : 272.740      ( -272.761 -272.761 )
Norm@50keV  : 9.72970E-03    ( -0.00413153   0.0246225 )
------------------------------------------------------------
#Fit statistic : Chi-Squared =          57.90 using 59 PHA bins.
# Reduced chi-squared =          1.034 for     56 degrees of freedom
# Null hypothesis probability =   4.049557e-01

Photon flux (15-150 keV)    in 1 sec: 0.751863 ( -0.117264  0.117166 ) ph/cm2/s
Energy fluence (15-150 keV)             : 8.45474e-08 ( -1.38764e-08  1.34362e-08 ) ergs/cm2
Band function

Time interval is from   -0.184 sec. to    0.816 sec.

Spectral model in the Band function:
------------------------------------------------------------
Parameters  : value       lower 90%   higher 90%
alpha       : -0.848036   ( 0.848036   0.848036 )
beta        : -0.530927    ( -0.265305   0.290183 )
Epeak [keV] : 17.9664      ( -17.9663 -17.9663 )
Norm@50keV   : 8.89227E-03    ( -0.0033999   90854.3 )
------------------------------------------------------------
#Fit statistic : Chi-Squared =          58.32 using 59 PHA bins.
# Reduced chi-squared =          1.060 for     55 degrees of freedom
# Null hypothesis probability =   3.541684e-01

Photon flux (15-150 keV)    in 1 sec:  (    ) ph/cm2/s
Energy fluence (15-150 keV)             : 0 ( 0  0 ) ergs/cm2
Single BB
Spectral model blackbody:
------------------------------------------------------------
Parameters  : value    Lower 90%  Upper 90%
kT [keV]    : 30.4633  (-5.98748  9.22629)
R^2/D10^2   : 1.16277E-02  (-0.00588514   0.0100435)
(R is the radius in km and D10 is the distance to the source in units of 10 kpc)
------------------------------------------------------------
#Fit statistic : Chi-Squared =          60.34 using 59 PHA bins.
# Reduced chi-squared =          1.059 for     57 degrees of freedom
# Null hypothesis probability =   3.561123e-01

Energy  Fluence     90% Error
[keV]   [erg/cm2]   [erg/cm2]
15- 25  1.672e-09   5.308e-10
25- 50  1.038e-08   2.863e-09
50-150  6.763e-08   1.901e-08
15-150  7.968e-08   2.329e-08
Thermal bremsstrahlung (OTTB)
Spectral model: thermal bremsstrahlung
------------------------------------------------------------
Parameters  : value         Lower 90%    Upper 90%
kT [keV]    : 200.000       (      )
Norm        : 2.82880       (-0.466886     0.466881)
------------------------------------------------------------
#Fit statistic : Chi-Squared =          96.96 using 59 PHA bins.
# Reduced chi-squared =          1.701 for     57 degrees of freedom
# Null hypothesis probability =   7.611902e-04

Energy  Fluence     90% Error
[keV]   [erg/cm2]   [erg/cm2]
15- 25  7.041e-09   4.032e-09
25- 50  1.354e-08   7.685e-09
50-150  2.970e-08   1.684e-08
15-150  5.029e-08   2.854e-08
Double BB
Spectral model: bbodyrad<1> + bbodyrad<2>
------------------------------------------------------------
Parameters  : value         Lower 90%    Upper 90%
kT1 [keV]   : 1.27107        (-1.27709      1.21183)
R1^2/D10^2  : 9028.62        (-8647.54      3.98707e+08)
kT2 [keV]   : 31.2358        (-6.27576      9.89675)
R2^2/D10^2  : 1.07858E-02    (-0.0055905   0.00860589)
------------------------------------------------------------
#Fit statistic : Chi-Squared =          58.71 using 59 PHA bins.
# Reduced chi-squared =          1.067 for     55 degrees of freedom
# Null hypothesis probability =   3.411309e-01

Energy  Fluence     90% Error
[keV]   [erg/cm2]   [erg/cm2]
15- 25  2.235e-09   5.982e-10
25- 50  1.007e-08   3.038e-09
50-150  6.821e-08   1.875e-08
15-150  8.051e-08   2.216e-08
Pre-slew spectrum (Pre-slew PHA with pre-slew DRM)
Power-law model

Spectral model in power-law:
------------------------------------------------------------
Parameters  : value       lower 90%   higher 90%
Photon index: 0.483733     ( -0.241854   0.223854 )
Norm@50keV  : 1.08415E-02    ( -0.0015633   0.00152089 )
------------------------------------------------------------
#Fit statistic : Chi-Squared =          73.43 using 59 PHA bins.
# Reduced chi-squared =          1.288 for     57 degrees of freedom
# Null hypothesis probability =   7.042899e-02

Photon flux (15-150 keV)    in 0.548 sec: 1.28748 ( -0.162011  0.162626 ) ph/cm2/s
Energy fluence (15-150 keV)             : 8.04837e-08 ( -1.03694e-08  1.04179e-08 ) ergs/cm2
Cutoff power-law model

Spectral model in the cutoff power-law:
------------------------------------------------------------
Parameters  : value       lower 90%   higher 90%
Photon index: -0.282647     ( -1.28846   0.851148 )
Epeak [keV] : 190.293      (   )
Norm@50keV  : 2.16012E-02    (     )
------------------------------------------------------------
#Fit statistic : Chi-Squared =          71.74 using 59 PHA bins.
# Reduced chi-squared =          1.281 for     56 degrees of freedom
# Null hypothesis probability =   7.656385e-02

Photon flux (15-150 keV)    in 0.548 sec: 1.25491 ( -0.16793  0.16813 ) ph/cm2/s
Energy fluence (15-150 keV)             : 7.84358e-08 ( -1.13036e-08  1.1029e-08 ) ergs/cm2
Band function

Spectral model in the Band function:
------------------------------------------------------------
Parameters  : value       lower 90%   higher 90%
alpha       : -0.732912   ( 0.732986   0.732986 )
beta        : -0.483733    ( -0.223854   0.241851 )
Epeak [keV] : 23.3170      ( -23.3297 -23.3297 )
Norm@50keV   : 1.41585E-02    ( -0.00542825   133691 )
------------------------------------------------------------
#Fit statistic : Chi-Squared =          73.43 using 59 PHA bins.
# Reduced chi-squared =          1.335 for     55 degrees of freedom
# Null hypothesis probability =   4.906833e-02

Photon flux (15-150 keV)    in 0.548 sec:  (    ) ph/cm2/s
Energy fluence (15-150 keV)             : 0 ( 0  0 ) ergs/cm2
S(25-50 keV) vs. S(50-100 keV) plot
S(25-50 keV)  = 1.02e-08
S(50-100 keV) = 2.92e-08
T90 vs. Hardness ratio plot

T90                                   = 0.504000008106232 sec.
Hardness ratio (energy fluence ratio) = 2.86275
Color vs. Color plot
Count Ratio  (25-50 keV) / (15-25 keV) = 3.57886
Count Ratio (50-100 keV) / (15-25 keV) = 5.37942
Mask shadow pattern
IMX = -1.387802605343761E-01, IMY = -7.828382608907439E-02
TIME vs. PHA plot around the trigger time
Blue+Cyan dotted lines: Time interval of the scaled map
From 0.000000 to 0.512000
TIME vs. DetID plot around the trigger time
Blue+Cyan dotted lines: Time interval of the scaled map
From 0.000000 to 0.512000
100 us light curve (15-350 keV)
Blue+Cyan dotted lines: Time interval of the scaled map
From 0.000000 to 0.512000
Spacecraft aspect plot
Bright source in the pre-burst/pre-slew/post-slew images
Pre-burst image of 15-350 keV band
Time interval of the image:
-239.512000 0.040000

# RAcent  DECcent POSerr Theta    Phi  PeakCts   SNR AngSep     Name
#  [deg]    [deg]    ['] [deg]  [deg]                   [']
254.4061  35.4220    5.1  37.9   45.4   0.7933   2.3    5.4	Her X-1
229.8277 -15.6757    2.6  45.3  135.1   2.7189   4.4 ------	UNKNOWN
235.9618  37.5980    2.6  23.9   35.2   0.7209   4.5 ------	UNKNOWN
224.4958  33.1106    2.5  13.5   35.2   0.6702   4.6 ------	UNKNOWN
168.8896  40.3250    2.6  37.9  -76.3   1.9991   4.5 ------	UNKNOWN
165.8988  16.7730    3.5  43.1 -112.3   2.4872   3.3 ------	UNKNOWN
Pre-slew background subtracted image of 15-350 keV band
Time interval of the image:
0.040000 0.588000

# RAcent  DECcent POSerr Theta    Phi  PeakCts   SNR AngSep     Name
#  [deg]    [deg]    ['] [deg]  [deg]                   [']
254.4936  35.2232   15.6  38.0   45.7  -0.0127  -0.7    7.4	Her X-1
260.5717  28.5425    2.3  43.5   55.5   0.1765   5.1 ------	UNKNOWN
212.9847  16.9870    0.9   9.1  150.6   0.0999  13.3 ------	UNKNOWN
193.8789   5.9810    2.0  26.0 -156.5   0.0465   5.6 ------	UNKNOWN
170.5111   3.7675    2.3  45.0 -132.0   0.1066   5.1 ------	UNKNOWN
Post-slew image of 15-350 keV band
Time interval of the image:
46.988600 962.568000

# RAcent  DECcent POSerr Theta    Phi  PeakCts   SNR AngSep     Name
#  [deg]    [deg]    ['] [deg]  [deg]                   [']
254.4582  35.3455    5.0  41.1   40.2   2.1646   2.3    0.2	Her X-1
225.2253  25.4128    3.4  14.1   36.4   1.2574   3.4 ------	UNKNOWN
227.0607  40.1086    2.9  26.1    9.9   1.5971   3.9 ------	UNKNOWN
227.7178  44.7917    2.4  30.4    5.8   2.1852   4.9 ------	UNKNOWN
178.6260 -19.0276    3.0  49.4 -150.4   4.2166   3.9 ------	UNKNOWN
Plot creation:
Sun May 31 12:28:12 EDT 2015