Special notes of this burst
Image
Pre-slew 15.0-50.0 keV image (Event data)
#RAcent DECcent POSerr Theta  Phi  Peak_Cts  SNR Name
220.919 12.592 0.000 8.780 104.685 0.103 7.532 TRIG_00222683

Image time interval: 0.000 to 4.096 [sec]
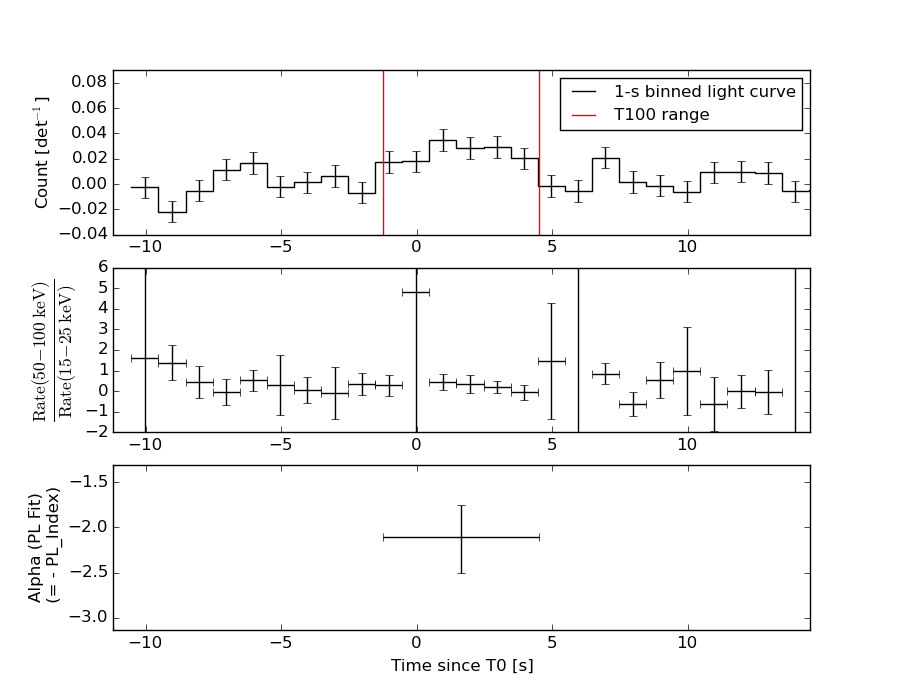
Lightcurves
Notes:
- 1) The mask-weighted light curves are using the flight position.
- 2) Multiple plots of different time binning/intervals are shown to cover all scenarios of short/long GRBs, rate/image triggers, and real/false positives.
- 3) For all the mask-weighted lightcurves, the y-axis units are counts/sec/det where a det is 0.4 x 0.4 = 0.16 sq cm.
- 4) The verticle lines correspond to following: green dotted lines are T50 interval, black dotted lines are T90 interval, blue solid line(s) is a spacecraft slew start time, and orange solid line(s) is a spacecraft slew end time.
- 5) Time of each bin is in the middle of the bin.
1 s binning
From T0-310 s to T0+310 s
From T100_start - 20 s to T100_end + 30 s

Full time interval

64 ms binning
Full time interval
From T100_start to T100_end
From T0-5 sec to T0+5 sec
16 ms binning
From T100_start-5 s to T100_start+5 s
Blue+Cyan dotted lines: Time interval of the scaled map
From 0.000000 to 4.096000
8 ms binning
From T100_start-3 s to T100_start+3 s
Blue+Cyan dotted lines: Time interval of the scaled map
From 0.000000 to 4.096000
2 ms binning
From T100_start-1 s to T100_start+1 s
Blue+Cyan dotted lines: Time interval of the scaled map
From 0.000000 to 4.096000
SN=5 or 10 sec. binning (whichever binning is satisfied first)

SN=5 or 10 sec. binning (T < 200 sec)
Quad-rate summed light curves (from T0-300s to T0+1000s)

Spectral Evolution
Spectra
Notes:
- 1) The fitting includes the systematic errors.
- 2) When the burst includes telescope slew time periods, the fitting uses an average response file made from multiple 5-s response files through out the slew time plus single time preiod for the non-slew times, and weighted by the total counts in the corresponding time period using addrmf. An average response file is needed becuase a spectral fit using the pre-slew DRM will introduce some errors in both a spectral shape and a normalization if the PHA file contains a lot of the slew/post-slew time interval.
- 3) For fits to more complicated models (e.g. a power-law over a cutoff power-law), the BAT team has decided to require a chi-square improvement of more than 6 for each extra dof.
Time averaged spectrum fit using the average DRM
Power-law model

Time interval is from   -1.224 sec. to    4.520 sec.

Spectral model in power-law:
------------------------------------------------------------
Parameters  : value       lower 90%   higher 90%
Photon index: 2.10552     ( -0.35626   0.403144 )
Norm@50keV  : 1.36950E-03    ( -0.000399684   0.000393865 )
------------------------------------------------------------
#Fit statistic : Chi-Squared =          62.31 using 59 PHA bins.
# Reduced chi-squared =          1.093 for     57 degrees of freedom
# Null hypothesis probability =   2.929173e-01

Photon flux (15-150 keV)    in 5.744 sec: 0.216044 ( -0.0440559  0.0441112 ) ph/cm2/s
Energy fluence (15-150 keV)             : 7.31246e-08 ( -1.87164e-08  2.00071e-08 ) ergs/cm2
Cutoff power-law model

Time interval is from   -1.224 sec. to    4.520 sec.
Spectral model in the cutoff power-law:
------------------------------------------------------------
Parameters  : value       lower 90%   higher 90%
Photon index: -1.50038     ( -7.30975   2.30864 )
Epeak [keV] : 31.2189      ( -12.8197 9.79478 )
Norm@50keV  : 0.349799    (     )
------------------------------------------------------------
#Fit statistic : Chi-Squared =          58.12 using 59 PHA bins.
# Reduced chi-squared =          1.038 for     56 degrees of freedom
# Null hypothesis probability =   3.972858e-01

Photon flux (15-150 keV)    in 5.744 sec: 0.202819 ( -0.04331  0.044371 ) ph/cm2/s
Energy fluence (15-150 keV)             : 5.52908e-08 ( -1.46124e-08  2.2279e-08 ) ergs/cm2
Band function
Time interval is from   -1.224 sec. to    4.520 sec.

Spectral model in the Band function:
------------------------------------------------------------
Parameters  : value       lower 90%   higher 90%
alpha       : 4.08430   ( -2.22565   -0.475065 )
beta        : -3.17982    ( 9.37167   19.3699 )
Epeak [keV] : 28.4486      ( -7.00777 12.5654 )
Norm@50keV   : 29.2231    ( -29.2456   29.5276 )
------------------------------------------------------------
#Fit statistic : Chi-Squared =          56.37 using 59 PHA bins.
# Reduced chi-squared =          1.025 for     55 degrees of freedom
# Null hypothesis probability =   4.236141e-01

Photon flux (15-150 keV)    in 5.744 sec:  (    ) ph/cm2/s
Energy fluence (15-150 keV)             : 6.3018e-08 ( -6.29778e-08  -1.78333e-08 ) ergs/cm2
Single BB
Spectral model blackbody:
------------------------------------------------------------
Parameters  : value    Lower 90%  Upper 90%
kT [keV]    : 7.99709  (-1.41074  1.7803)
R^2/D10^2   : 0.254013  (-0.139609   0.291393)
(R is the radius in km and D10 is the distance to the source in units of 10 kpc)
------------------------------------------------------------
#Fit statistic : Chi-Squared =          58.22 using 59 PHA bins.
# Reduced chi-squared =          1.021 for     57 degrees of freedom
# Null hypothesis probability =   4.303908e-01

Energy  Fluence     90% Error
[keV]   [erg/cm2]   [erg/cm2]
15- 25  1.687e-08   6.172e-09
25- 50  2.951e-08   1.065e-08
50-150  7.738e-09   4.481e-09
15-150  5.411e-08   2.018e-08
Thermal bremsstrahlung (OTTB)
Spectral model: thermal bremsstrahlung
------------------------------------------------------------
Parameters  : value         Lower 90%    Upper 90%
kT [keV]    : 46.4851       (-18.5848      42.6319)
Norm        : 1.29987       (-0.379975     0.577277)
------------------------------------------------------------
#Fit statistic : Chi-Squared =          59.83 using 59 PHA bins.
# Reduced chi-squared =          1.050 for     57 degrees of freedom
# Null hypothesis probability =   3.734130e-01

Energy  Fluence     90% Error
[keV]   [erg/cm2]   [erg/cm2]
15- 25  1.793e-08   5.230e-09
25- 50  2.507e-08   8.739e-09
50-150  2.269e-08   1.394e-08
15-150  6.569e-08   2.582e-08
Double BB

------------------------------------------------------------
Parameters  : value         Lower 90%    Upper 90%
kT1 [keV]   : 7.14479        (-6.95432      2.36205)
R1^2/D10^2  : 0.349941        (-0.207323      -0.352687)
kT2 [keV]   : 23.4577        (-22.941      -22.941)
R2^2/D10^2  : 1.23163E-03    (-0.00135496   0.452687)
------------------------------------------------------------
#Fit statistic : Chi-Squared =          57.11 using 59 PHA bins.
#Fit statistic : Chi-Squared =          57.08 using 59 PHA bins.
# Reduced chi-squared =          1.038 for     55 degrees of freedom
# Reduced chi-squared =          1.038 for     55 degrees of freedom
# Null hypothesis probability =   3.967582e-01
# Null hypothesis probability =   3.978683e-01

Energy  Fluence     90% Error
[keV]   [erg/cm2]   [erg/cm2]
15- 25  1.766e-08   1.095e-08
25- 50  2.764e-08   1.798e-08
50-150  1.933e-08   1.267e-08
15-150  6.464e-08   3.843e-08
Peak spectrum fit
Power-law model

Time interval is from    0.716 sec. to    1.716 sec.

Spectral model in power-law:
------------------------------------------------------------
Parameters  : value       lower 90%   higher 90%
Photon index: 1.68405     ( -0.540071   0.577555 )
Norm@50keV  : 2.34740E-03    ( -0.000920863   0.000901579 )
------------------------------------------------------------
#Fit statistic : Chi-Squared =          53.05 using 59 PHA bins.
# Reduced chi-squared =         0.9307 for     57 degrees of freedom
# Null hypothesis probability =   6.240239e-01

Photon flux (15-150 keV)    in 1 sec: 0.310027 ( -0.107977  0.108022 ) ph/cm2/s
Energy fluence (15-150 keV)             : 2.17759e-08 ( -8.57938e-09  9.15909e-09 ) ergs/cm2
Cutoff power-law model
Time interval is from    0.716 sec. to    1.716 sec.
Spectral model in the cutoff power-law:
------------------------------------------------------------
Parameters  : value       lower 90%   higher 90%
Photon index: -6.20680     (     )
Epeak [keV] : 33.7513      ( -6.70973 28.8648 )
Norm@50keV  : 366.182    (     )
------------------------------------------------------------
#Fit statistic : Chi-Squared =          48.71 using 59 PHA bins.
# Reduced chi-squared =         0.8698 for     56 degrees of freedom
# Null hypothesis probability =   7.446077e-01

Photon flux (15-150 keV)    in 1 sec: 0.273781 ( -0.093281  0.10265 ) ph/cm2/s
Energy fluence (15-150 keV)             : 1.34544e-08 ( -4.75098e-09  9.2605e-09 ) ergs/cm2
Band function
Time interval is from    0.716 sec. to    1.716 sec.

Spectral model in the Band function:
------------------------------------------------------------
Parameters  : value       lower 90%   higher 90%
alpha       : 5.00000   ( -5.0889   -5 )
beta        : -2.94379    ( 2.94858   1.16969 )
Epeak [keV] : 32.6084      ( -8.08039 8.61643 )
Norm@50keV   : 76.4228    ( -23.7723   343.251 )
------------------------------------------------------------
#Fit statistic : Chi-Squared =          47.54 using 59 PHA bins.
# Reduced chi-squared =         0.8644 for     55 degrees of freedom
# Null hypothesis probability =   7.523357e-01

Photon flux (15-150 keV)    in 1 sec:  (    ) ph/cm2/s
Energy fluence (15-150 keV)             : 1.855e-08 ( 0  0 ) ergs/cm2
Single BB
Spectral model blackbody:
------------------------------------------------------------
Parameters  : value    Lower 90%  Upper 90%
kT [keV]    : 9.92846  (-2.58743  4.15686)
R^2/D10^2   : 0.169106  (-0.169106   0.353297)
(R is the radius in km and D10 is the distance to the source in units of 10 kpc)
------------------------------------------------------------
#Fit statistic : Chi-Squared =          49.72 using 59 PHA bins.
# Reduced chi-squared =         0.8724 for     57 degrees of freedom
# Null hypothesis probability =   7.420261e-01

Energy  Fluence     90% Error
[keV]   [erg/cm2]   [erg/cm2]
15- 25  3.386e-09   2.115e-09
25- 50  8.334e-09   5.025e-09
50-150  4.260e-09   3.437e-09
15-150  1.598e-08   1.017e-08
Thermal bremsstrahlung (OTTB)
Spectral model: thermal bremsstrahlung
------------------------------------------------------------
Parameters  : value         Lower 90%    Upper 90%
kT [keV]    : 95.2810       (-59.5562      -95.281)
Norm        : 1.42530       (-0.542562     0.854685)
------------------------------------------------------------
#Fit statistic : Chi-Squared =          52.05 using 59 PHA bins.
# Reduced chi-squared =         0.9132 for     57 degrees of freedom
# Null hypothesis probability =   6.606873e-01

Energy  Fluence     90% Error
[keV]   [erg/cm2]   [erg/cm2]
15- 25  3.724e-09   2.325e-09
25- 50  6.375e-09   3.979e-09
50-150  1.005e-08   8.430e-09
15-150  2.015e-08   1.421e-08
Double BB

------------------------------------------------------------
Parameters  : value         Lower 90%    Upper 90%
kT1 [keV]   : 199.997        (-199.997      -199.997)
R1^2/D10^2  : 1.77651E-05        (-1.77651e-05      -1.77651e-05)
kT2 [keV]   : 9.35541        (-2.30314      4.20781)
R2^2/D10^2  : 0.201789    (-0.150769   0.268928)
------------------------------------------------------------
#Fit statistic : Chi-Squared =          49.72 using 59 PHA bins.
#Fit statistic : Chi-Squared =          49.23 using 59 PHA bins.
# Reduced chi-squared =         0.9041 for     55 degrees of freedom
# Reduced chi-squared =         0.8952 for     55 degrees of freedom
# Null hypothesis probability =   6.757873e-01
# Null hypothesis probability =   6.935674e-01

Energy  Fluence     90% Error
[keV]   [erg/cm2]   [erg/cm2]
15- 25  3.389e-09   3.944e-04
25- 50  8.332e-09   3.433e-03
50-150  4.260e-09   8.560e-02
15-150  1.598e-08   8.095e-02
Pre-slew spectrum (Pre-slew PHA with pre-slew DRM)
Power-law model

Spectral model in power-law:
------------------------------------------------------------
Parameters  : value       lower 90%   higher 90%
Photon index: 2.10552     ( -0.35626   0.403144 )
Norm@50keV  : 1.36950E-03    ( -0.000399684   0.000393865 )
------------------------------------------------------------
#Fit statistic : Chi-Squared =          62.31 using 59 PHA bins.
# Reduced chi-squared =          1.093 for     57 degrees of freedom
# Null hypothesis probability =   2.929173e-01

Photon flux (15-150 keV)    in 5.744 sec: 0.216044 ( -0.0440559  0.0441112 ) ph/cm2/s
Energy fluence (15-150 keV)             : 7.31246e-08 ( -1.87164e-08  2.00071e-08 ) ergs/cm2
Cutoff power-law model

Spectral model in the cutoff power-law:
------------------------------------------------------------
Parameters  : value       lower 90%   higher 90%
Photon index: -1.50038     ( -7.30975   2.30864 )
Epeak [keV] : 31.2189      ( -12.8197 9.79478 )
Norm@50keV  : 0.349799    ( -0.326933   8512.08 )
------------------------------------------------------------
#Fit statistic : Chi-Squared =          58.12 using 59 PHA bins.
# Reduced chi-squared =          1.038 for     56 degrees of freedom
# Null hypothesis probability =   3.972858e-01

Photon flux (15-150 keV)    in 5.744 sec: 0.202819 ( -0.04331  0.044371 ) ph/cm2/s
Energy fluence (15-150 keV)             : 5.52908e-08 ( -1.46124e-08  2.2279e-08 ) ergs/cm2
Band function

Spectral model in the Band function:
------------------------------------------------------------
Parameters  : value       lower 90%   higher 90%
alpha       : 4.08430   ( -2.22565   -0.475065 )
beta        : -3.17982    ( 9.37167   19.3699 )
Epeak [keV] : 28.4486      ( -7.00777 12.5654 )
Norm@50keV   : 29.2231    ( -29.2456   29.5276 )
------------------------------------------------------------
#Fit statistic : Chi-Squared =          56.37 using 59 PHA bins.
# Reduced chi-squared =          1.025 for     55 degrees of freedom
# Null hypothesis probability =   4.236141e-01

Photon flux (15-150 keV)    in 5.744 sec:  (    ) ph/cm2/s
Energy fluence (15-150 keV)             : 6.3018e-08 ( -6.29778e-08  -1.78333e-08 ) ergs/cm2
S(25-50 keV) vs. S(50-100 keV) plot
S(25-50 keV)  = 2.27e-08
S(50-100 keV) = 2.11e-08
T90 vs. Hardness ratio plot

T90                                   = 4.92799997329712 sec.
Hardness ratio (energy fluence ratio) = 0.929515
Color vs. Color plot
Count Ratio  (25-50 keV) / (15-25 keV) = 1.25824
Count Ratio (50-100 keV) / (15-25 keV) = 0.343832
Mask shadow pattern

IMX = -0.0391541225918, IMY = -0.149408628234
TIME vs. PHA plot around the trigger time
Blue+Cyan dotted lines: Time interval of the scaled map
From 0.000000 to 4.096000
TIME vs. DetID plot around the trigger time
Blue+Cyan dotted lines: Time interval of the scaled map
From 0.000000 to 4.096000
100 us light curve (15-350 keV)
Blue+Cyan dotted lines: Time interval of the scaled map
From 0.000000 to 4.096000
Spacecraft aspect plot

Bright source in the pre-burst/pre-slew/post-slew images
Pre-burst image of 15-350 keV band
Time interval of the image:
-239.528000 -1.224000

# RAcent  DECcent POSerr Theta    Phi  PeakCts   SNR AngSep     Name
#  [deg]    [deg]    ['] [deg]  [deg]                   [']
254.5031  35.3755   15.7  41.1   40.9   0.2586   0.7    3.0	Her X-1
241.8999  -4.4646    2.5  35.7  110.1   1.7231   4.6 ------	UNKNOWN
201.1323 -33.2564    3.7  51.5  178.5   1.3145   3.2 ------	UNKNOWN
Pre-slew background subtracted image of 15-350 keV band
Time interval of the image:
-1.224000 4.520000

# RAcent  DECcent POSerr Theta    Phi  PeakCts   SNR AngSep     Name
#  [deg]    [deg]    ['] [deg]  [deg]                   [']
254.4753  35.5100    5.6  41.1   40.7   0.1005   2.1   10.1	Her X-1
226.2703  16.6107    1.8  12.7   75.5   0.1340   6.3 ------	UNKNOWN
220.9346  12.5770    1.7   8.8  104.7   0.1418   6.8 ------	UNKNOWN
201.3654 -23.6877    2.6  42.2 -178.3   0.1387   4.4 ------	UNKNOWN
Post-slew image of 15-350 keV band
Time interval of the image:
77.372600 934.972600

# RAcent  DECcent POSerr Theta    Phi  PeakCts   SNR AngSep     Name
#  [deg]    [deg]    ['] [deg]  [deg]                   [']
244.9729 -15.6500    0.4  37.0  123.4  32.2905  28.2    0.7	Sco X-1
254.3612  35.2527   46.7  37.7   31.6   0.1956   0.2    7.2	Her X-1
207.3283 -40.0910    3.0  54.2  177.0   6.7998   3.8 ------	UNKNOWN
Plot creation:
Thu Oct  8 20:39:55 EDT 2015