Special notes of this burst
Image
Pre-slew 15.0-350.0 keV image (Event data)

#   RAcent    DECcent   POSerr    Theta     Phi              Peak Cts       SNR   Name
  111.8954   -29.8447   0.0030    34.2671  -118.4470         7.3591946     64.203 TRIG_00224364

Foreground time interval of the image:
 -0.488   9.237 (delta_t =   9.725 [sec])
Background time interval of the image:
-239.064  -0.488 (delta_t = 238.576 [sec])
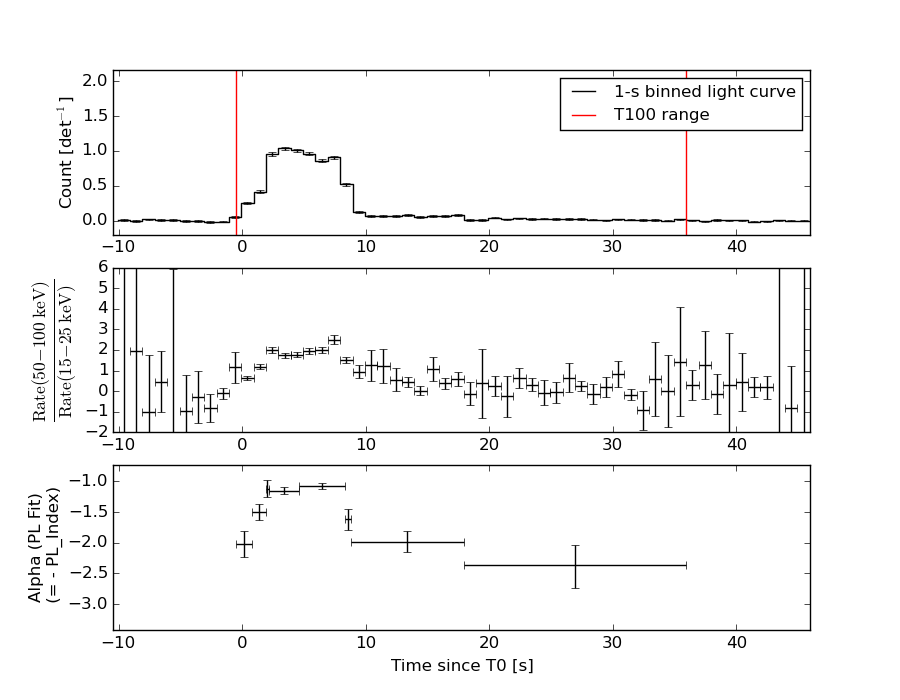
Lightcurves
Notes:
- 1) The mask-weighted light curves are using the flight position.
- 2) Multiple plots of different time binning/intervals are shown to cover all scenarios of short/long GRBs, rate/image triggers, and real/false positives.
- 3) For all the mask-weighted lightcurves, the y-axis units are counts/sec/det where a det is 0.4 x 0.4 = 0.16 sq cm.
- 4) The verticle lines correspond to following: green dotted lines are T50 interval, black dotted lines are T90 interval, blue solid line(s) is a spacecraft slew start time, and orange solid line(s) is a spacecraft slew end time.
- 5) Time of each bin is in the middle of the bin.
1 s binning
From T0-310 s to T0+310 s
From T100_start - 20 s to T100_end + 30 s
Full time interval
64 ms binning
Full time interval

From T100_start to T100_end

From T0-5 sec to T0+5 sec
16 ms binning
From T100_start-5 s to T100_start+5 s

Blue+Cyan dotted lines: Time interval of the scaled map
From 0.000000 to 0.256000
8 ms binning
From T100_start-3 s to T100_start+3 s

Blue+Cyan dotted lines: Time interval of the scaled map
From 0.000000 to 0.256000
2 ms binning
From T100_start-1 s to T100_start+1 s

Blue+Cyan dotted lines: Time interval of the scaled map
From 0.000000 to 0.256000
SN=5 or 10 sec. binning (whichever binning is satisfied first)
SN=5 or 10 sec. binning (T < 200 sec)

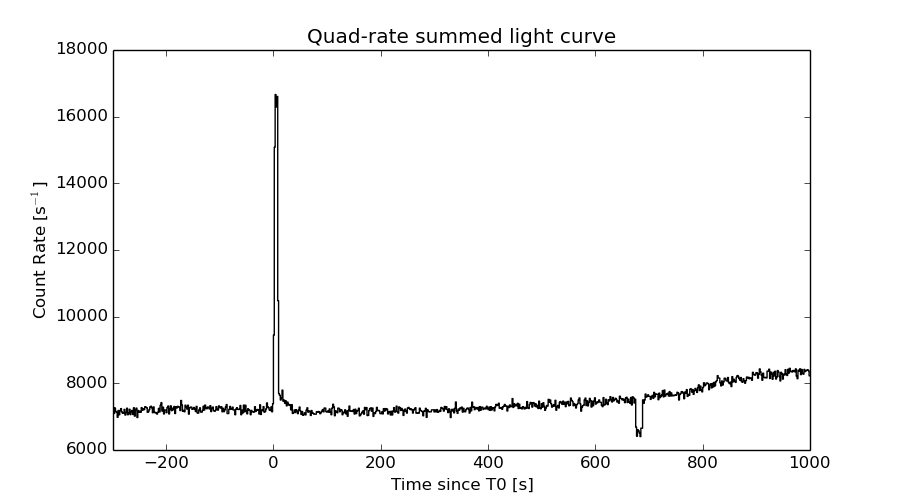
Quad-rate summed light curves (from T0-300s to T0+1000s)
Spectral Evolution
Spectra
Notes:
- 1) The fitting includes the systematic errors.
- 2) When the burst includes telescope slew time periods, the fitting uses an average response file made from multiple 5-s response files through out the slew time plus single time preiod for the non-slew times, and weighted by the total counts in the corresponding time period using addrmf. An average response file is needed becuase a spectral fit using the pre-slew DRM will introduce some errors in both a spectral shape and a normalization if the PHA file contains a lot of the slew/post-slew time interval.
- 3) For fits to more complicated models (e.g. a power-law over a cutoff power-law), the BAT team has decided to require a chi-square improvement of more than 6 for each extra dof.
Time averaged spectrum fit using the average DRM
Power-law model

Time interval is from   -0.488 sec. to   35.956 sec.

Spectral model in power-law:
------------------------------------------------------------
Parameters  : value       lower 90%   higher 90%
Photon index: 1.33367     ( -0.0416391   0.0415473 )
Norm@50keV  : 1.57149E-02    ( -0.000354465   0.000354309 )
------------------------------------------------------------
#Fit statistic : Chi-Squared =          46.26 using 59 PHA bins.
# Reduced chi-squared =         0.8116 for     57 degrees of freedom
# Null hypothesis probability =   8.446379e-01

Photon flux (15-150 keV)    in 36.44 sec: 1.88695 ( -0.0472203  0.0473467 ) ph/cm2/s
Energy fluence (15-150 keV)             : 5.6138e-06 ( -1.30545e-07  1.3062e-07 ) ergs/cm2
Cutoff power-law model

Time interval is from   -0.488 sec. to   35.956 sec.
Spectral model in the cutoff power-law:
------------------------------------------------------------
Parameters  : value       lower 90%   higher 90%
Photon index: 1.07296     ( -0.173275   0.166899 )
Epeak [keV] : 207.517      ( -59.5368 245.679 )
Norm@50keV  : 2.03812E-02    ( -0.00305354   0.00372892 )
------------------------------------------------------------
#Fit statistic : Chi-Squared =          39.03 using 59 PHA bins.
# Reduced chi-squared =         0.6970 for     56 degrees of freedom
# Null hypothesis probability =   9.588205e-01

Photon flux (15-150 keV)    in 36.44 sec: 1.85259 ( -0.05139  0.05161 ) ph/cm2/s
Energy fluence (15-150 keV)             : 5.54435e-06 ( -1.39638e-07  1.38982e-07 ) ergs/cm2
Band function

Time interval is from   -0.488 sec. to   35.956 sec.

Spectral model in the Band function:
------------------------------------------------------------
Parameters  : value       lower 90%   higher 90%
alpha       : -1.07242   ( -0.611824   1.47644 )
beta        : -6.69204    ( 6.22972   16.1966 )
Epeak [keV] : 207.582      ( -30.0069 230.899 )
Norm@50keV   : 2.03856E-02    ( -0.000454964   0.00119815 )
------------------------------------------------------------
#Fit statistic : Chi-Squared =          39.03 using 59 PHA bins.
# Reduced chi-squared =         0.7097 for     55 degrees of freedom
# Null hypothesis probability =   9.490879e-01

Photon flux (15-150 keV)    in 36.44 sec:  (    ) ph/cm2/s
Energy fluence (15-150 keV)             : 0 ( 0  0 ) ergs/cm2
Single BB
Spectral model blackbody:
------------------------------------------------------------
Parameters  : value    Lower 90%  Upper 90%
kT [keV]    : 19.2579  (  )
R^2/D10^2   : 9.29398E-02  (   )
(R is the radius in km and D10 is the distance to the source in units of 10 kpc)
------------------------------------------------------------
#Fit statistic : Chi-Squared =         387.38 using 59 PHA bins.
# Reduced chi-squared =         6.7962 for     57 degrees of freedom
# Null hypothesis probability =   1.212099e-50

Energy  Fluence     90% Error
[keV]   [erg/cm2]   [erg/cm2]
15- 25  2.457e-07   1.168e-08
25- 50  1.193e-06   3.808e-08
50-150  3.259e-06   1.192e-07
15-150  4.698e-06   1.257e-07
Thermal bremsstrahlung (OTTB)
Spectral model: thermal bremsstrahlung
------------------------------------------------------------
Parameters  : value         Lower 90%    Upper 90%
kT [keV]    : 199.363       (      )
Norm        : 8.02320       (     )
------------------------------------------------------------
#Fit statistic : Chi-Squared =         142.75 using 59 PHA bins.
# Reduced chi-squared =         2.5044 for     57 degrees of freedom
# Null hypothesis probability =   2.641845e-09

Energy  Fluence     90% Error
[keV]   [erg/cm2]   [erg/cm2]
15- 25  7.280e-07   1.986e-08
25- 50  1.400e-06   3.553e-08
50-150  3.071e-06   7.616e-08
15-150  5.200e-06   1.330e-07
Double BB

Spectral model: bbodyrad<1> + bbodyrad<2>
------------------------------------------------------------
Parameters  : value         Lower 90%    Upper 90%
kT1 [keV]   : 8.29806        (-0.782051      0.839742)
R1^2/D10^2  : 0.936546        (-0.244294      0.360198)
kT2 [keV]   : 31.1818        (-2.57143      3.35544)
R2^2/D10^2  : 1.50701E-02    (-0.00448281   0.00539188)
------------------------------------------------------------
#Fit statistic : Chi-Squared =          42.97 using 59 PHA bins.
# Reduced chi-squared =         0.7813 for     55 degrees of freedom
# Null hypothesis probability =   8.806031e-01

Energy  Fluence     90% Error
[keV]   [erg/cm2]   [erg/cm2]
15- 25  5.176e-07   4.701e-08
25- 50  1.323e-06   6.905e-08
50-150  3.693e-06   2.008e-07
15-150  5.534e-06   2.423e-07
Peak spectrum fit
Power-law model
Time interval is from    3.592 sec. to    4.592 sec.

Spectral model in power-law:
------------------------------------------------------------
Parameters  : value       lower 90%   higher 90%
Photon index: 1.12314     ( -0.0710838   0.0707937 )
Norm@50keV  : 7.64427E-02    ( -0.00307536   0.00307305 )
------------------------------------------------------------
#Fit statistic : Chi-Squared =          42.06 using 59 PHA bins.
# Reduced chi-squared =         0.7379 for     57 degrees of freedom
# Null hypothesis probability =   9.306539e-01

Photon flux (15-150 keV)    in 1 sec: 8.88777 ( -0.37017  0.37056 ) ph/cm2/s
Energy fluence (15-150 keV)             : 7.93422e-07 ( -3.47355e-08  3.48093e-08 ) ergs/cm2
Cutoff power-law model

Time interval is from    3.592 sec. to    4.592 sec.
Spectral model in the cutoff power-law:
------------------------------------------------------------
Parameters  : value       lower 90%   higher 90%
Photon index: 0.963891     ( -0.284602   0.208867 )
Epeak [keV] : 378.814      ( -378.814 -378.814 )
Norm@50keV  : 8.99115E-02    ( -0.0171549   0.0291723 )
------------------------------------------------------------
#Fit statistic : Chi-Squared =          41.05 using 59 PHA bins.
# Reduced chi-squared =         0.7330 for     56 degrees of freedom
# Null hypothesis probability =   9.329168e-01

Photon flux (15-150 keV)    in 1 sec: 8.82723 ( -0.38282  0.38331 ) ph/cm2/s
Energy fluence (15-150 keV)             : 7.89177e-07 ( -3.5952e-08  3.5819e-08 ) ergs/cm2
Band function
Time interval is from    3.592 sec. to    4.592 sec.

Spectral model in the Band function:
------------------------------------------------------------
Parameters  : value       lower 90%   higher 90%
alpha       : -0.964016   ( 0.789795   0.789795 )
beta        : -10.0000    ( 10   3.55271e-15 )
Epeak [keV] : 379.019      ( -119.18 -379.019 )
Norm@50keV   : 8.98922E-02    ( -0.00359449   0.0291998 )
------------------------------------------------------------
#Fit statistic : Chi-Squared =          41.05 using 59 PHA bins.
# Reduced chi-squared =         0.7464 for     55 degrees of freedom
# Null hypothesis probability =   9.188945e-01

Photon flux (15-150 keV)    in 1 sec:  (    ) ph/cm2/s
Energy fluence (15-150 keV)             : 0 ( 0  0 ) ergs/cm2
Single BB
Spectral model blackbody:
------------------------------------------------------------
Parameters  : value    Lower 90%  Upper 90%
kT [keV]    : 21.0797  (  )
R^2/D10^2   : 0.354330  (   )
(R is the radius in km and D10 is the distance to the source in units of 10 kpc)
------------------------------------------------------------
#Fit statistic : Chi-Squared =         157.17 using 59 PHA bins.
# Reduced chi-squared =         2.7574 for     57 degrees of freedom
# Null hypothesis probability =   2.610195e-11

Energy  Fluence     90% Error
[keV]   [erg/cm2]   [erg/cm2]
15- 25  2.970e-08   2.460e-09
25- 50  1.530e-07   9.750e-09
50-150  5.069e-07   3.400e-08
15-150  6.896e-07   3.690e-08
Thermal bremsstrahlung (OTTB)

Spectral model: thermal bremsstrahlung
------------------------------------------------------------
Parameters  : value         Lower 90%    Upper 90%
kT [keV]    : 199.363       (      )
Norm        : 36.8093       (     )
------------------------------------------------------------
#Fit statistic : Chi-Squared =         145.64 using 59 PHA bins.
# Reduced chi-squared =         2.5551 for     57 degrees of freedom
# Null hypothesis probability =   1.068335e-09

Energy  Fluence     90% Error
[keV]   [erg/cm2]   [erg/cm2]
15- 25  9.166e-08   4.095e-09
25- 50  1.763e-07   7.900e-09
50-150  3.867e-07   1.650e-08
15-150  6.547e-07   2.760e-08
Double BB
Spectral model: bbodyrad<1> + bbodyrad<2>
------------------------------------------------------------
Parameters  : value         Lower 90%    Upper 90%
kT1 [keV]   : 7.47064        (-1.33407      1.56313)
R1^2/D10^2  : 5.41334        (-2.44021      5.29351)
kT2 [keV]   : 31.8439        (-3.72572      5.54024)
R2^2/D10^2  : 8.21314E-02    (-0.0335684   0.0426563)
------------------------------------------------------------
#Fit statistic : Chi-Squared =          43.53 using 59 PHA bins.
# Reduced chi-squared =         0.7915 for     55 degrees of freedom
# Null hypothesis probability =   8.676974e-01

Energy  Fluence     90% Error
[keV]   [erg/cm2]   [erg/cm2]
15- 25  6.422e-08   1.112e-08
25- 50  1.593e-07   1.975e-08
50-150  5.701e-07   6.525e-08
15-150  7.937e-07   7.825e-08
Pre-slew spectrum (Pre-slew PHA with pre-slew DRM)
Power-law model

Spectral model in power-law:
------------------------------------------------------------
Parameters  : value       lower 90%   higher 90%
Photon index: 1.19618     ( -0.036159   0.0360538 )
Norm@50keV  : 5.17880E-02    ( -0.001047   0.00104584 )
------------------------------------------------------------
#Fit statistic : Chi-Squared =          47.85 using 59 PHA bins.
# Reduced chi-squared =         0.8394 for     57 degrees of freedom
# Null hypothesis probability =   8.008129e-01

Photon flux (15-150 keV)    in 9.725 sec: 6.07561 ( -0.13317  0.133431 ) ph/cm2/s
Energy fluence (15-150 keV)             : 5.11515e-06 ( -1.04227e-07  1.04272e-07 ) ergs/cm2
Cutoff power-law model
Spectral model in the cutoff power-law:
------------------------------------------------------------
Parameters  : value       lower 90%   higher 90%
Photon index: 0.899460     ( -0.153862   0.149013 )
Epeak [keV] : 226.775      ( -56.2782 158.235 )
Norm@50keV  : 6.87248E-02    ( -0.00890294   0.0105351 )
------------------------------------------------------------
#Fit statistic : Chi-Squared =          36.01 using 59 PHA bins.
# Reduced chi-squared =         0.6431 for     56 degrees of freedom
# Null hypothesis probability =   9.826170e-01

Photon flux (15-150 keV)    in 9.725 sec: 5.96090 ( -0.14289  0.14349 ) ph/cm2/s
Energy fluence (15-150 keV)             : 5.06501e-06 ( -1.08502e-07  1.08288e-07 ) ergs/cm2
Band function

Spectral model in the Band function:
------------------------------------------------------------
Parameters  : value       lower 90%   higher 90%
alpha       : -0.899862   ( -0.107849   0.150175 )
beta        : -9.36834    ( 9.37131   19.3713 )
Epeak [keV] : 227.725      ( -27.7144 79.3338 )
Norm@50keV   : 6.86555E-02    ( -0.00604318   0.00148119 )
------------------------------------------------------------
#Fit statistic : Chi-Squared =          36.02 using 59 PHA bins.
# Reduced chi-squared =         0.6548 for     55 degrees of freedom
# Null hypothesis probability =   9.776961e-01

Photon flux (15-150 keV)    in 9.725 sec:  (    ) ph/cm2/s
Energy fluence (15-150 keV)             : 0 ( 0  0 ) ergs/cm2
S(25-50 keV) vs. S(50-100 keV) plot

S(25-50 keV)  = 1.27e-06
S(50-100 keV) = 2.02e-06
T90 vs. Hardness ratio plot
T90                                   = 15.9679999947548 sec.
Hardness ratio (energy fluence ratio) = 1.59055
Color vs. Color plot

Count Ratio  (25-50 keV) / (15-25 keV) = 1.59796
Count Ratio (50-100 keV) / (15-25 keV) = 1.45713
Mask shadow pattern
IMX = -3.245400832142962E-01, IMY = 5.990500984735029E-01
TIME vs. PHA plot around the trigger time
Blue+Cyan dotted lines: Time interval of the scaled map
From 0.000000 to 0.256000
TIME vs. DetID plot around the trigger time

Blue+Cyan dotted lines: Time interval of the scaled map
From 0.000000 to 0.256000
100 us light curve (15-350 keV)
Blue+Cyan dotted lines: Time interval of the scaled map
From 0.000000 to 0.256000
Spacecraft aspect plot

Bright source in the pre-burst/pre-slew/post-slew images
Pre-burst image of 15-350 keV band
Time interval of the image:
-239.064000 -0.488000

# RAcent  DECcent POSerr Theta    Phi  PeakCts   SNR AngSep     Name
#  [deg]    [deg]    ['] [deg]  [deg]                   [']
135.6911 -40.4968   16.9  32.4  -77.8   0.1760   0.7    8.2	Vela X-1
170.5204 -60.4755    6.0  33.9  -23.0   0.3478   1.9   10.7	Cen X-3
186.6602 -62.7623    1.0  38.4  -11.8   2.4793  11.8    0.5	GX 301-2
 55.8746 -28.2749    2.5  42.7  159.9   1.5427   4.7 ------	UNKNOWN
218.5468 -66.6956    2.4  44.5    7.4   1.2899   4.8 ------	UNKNOWN
188.6361 -67.8765    3.2  35.8   -4.4   0.7051   3.6 ------	UNKNOWN
107.2018 -63.3447    2.9   5.5  -39.1   0.6282   4.1 ------	UNKNOWN
198.2402 -45.2448    2.9  56.2  -20.1   2.2596   4.0 ------	UNKNOWN
Pre-slew background subtracted image of 15-350 keV band
Time interval of the image:
-0.488000 9.236590

# RAcent  DECcent POSerr Theta    Phi  PeakCts   SNR AngSep     Name
#  [deg]    [deg]    ['] [deg]  [deg]                   [']
135.4414 -40.3625    0.0  32.4  -78.2   0.1978   1.7   12.2	Vela X-1
169.9773 -60.5799    7.7  33.7  -23.1   0.0998   1.5   10.3	Cen X-3
186.3610 -62.7052    6.1  38.4  -12.0  -0.1496  -1.9    9.0	GX 301-2
 69.8529  -9.5089    2.6  56.0 -175.2   0.8722   4.4 ------	UNKNOWN
111.8954 -29.8447    0.2  34.3 -118.4   7.3585  64.2 ------	UNKNOWN
Post-slew image of 15-350 keV band
Time interval of the image:
62.836600 669.636600

# RAcent  DECcent POSerr Theta    Phi  PeakCts   SNR AngSep     Name
#  [deg]    [deg]    ['] [deg]  [deg]                   [']
 83.6384  22.0279    1.3  58.6 -159.8  20.2927   9.2    0.9	Crab
135.5433 -40.5757   12.5  22.0   -3.4  -0.2719  -0.9    1.4	Vela X-1
170.3795 -60.5792    7.5  49.0   17.4  -1.2068  -1.5    3.2	Cen X-3
 59.8615 -11.8600    2.9  51.3  150.1   5.7949   4.0 ------	UNKNOWN
Plot creation:
Sun May 31 12:20:36 EDT 2015