Special notes of this burst
Image
Pre-slew 15.0-350.0 keV image (Event data)

#   RAcent    DECcent   POSerr    Theta     Phi              Peak Cts       SNR   Name
   18.1355    55.7922   0.0042    12.1656   106.6889         1.7526899     45.819 TRIG_00226382

Foreground time interval of the image:
 -3.624   7.000 (delta_t =  10.624 [sec])
Background time interval of the image:
-239.104  -3.624 (delta_t = 235.480 [sec])
Lightcurves
Notes:
- 1) The mask-weighted light curves are using the flight position.
- 2) Multiple plots of different time binning/intervals are shown to cover all scenarios of short/long GRBs, rate/image triggers, and real/false positives.
- 3) For all the mask-weighted lightcurves, the y-axis units are counts/sec/det where a det is 0.4 x 0.4 = 0.16 sq cm.
- 4) The verticle lines correspond to following: green dotted lines are T50 interval, black dotted lines are T90 interval, blue solid line(s) is a spacecraft slew start time, and orange solid line(s) is a spacecraft slew end time.
- 5) Time of each bin is in the middle of the bin.
1 s binning
From T0-310 s to T0+310 s
From T100_start - 20 s to T100_end + 30 s

Full time interval
64 ms binning
Full time interval
From T100_start to T100_end
From T0-5 sec to T0+5 sec
16 ms binning
From T100_start-5 s to T100_start+5 s
Blue+Cyan dotted lines: Time interval of the scaled map
From 0.000000 to 1.024000
8 ms binning
From T100_start-3 s to T100_start+3 s

Blue+Cyan dotted lines: Time interval of the scaled map
From 0.000000 to 1.024000
2 ms binning
From T100_start-1 s to T100_start+1 s
Blue+Cyan dotted lines: Time interval of the scaled map
From 0.000000 to 1.024000
SN=5 or 10 sec. binning (whichever binning is satisfied first)

SN=5 or 10 sec. binning (T < 200 sec)
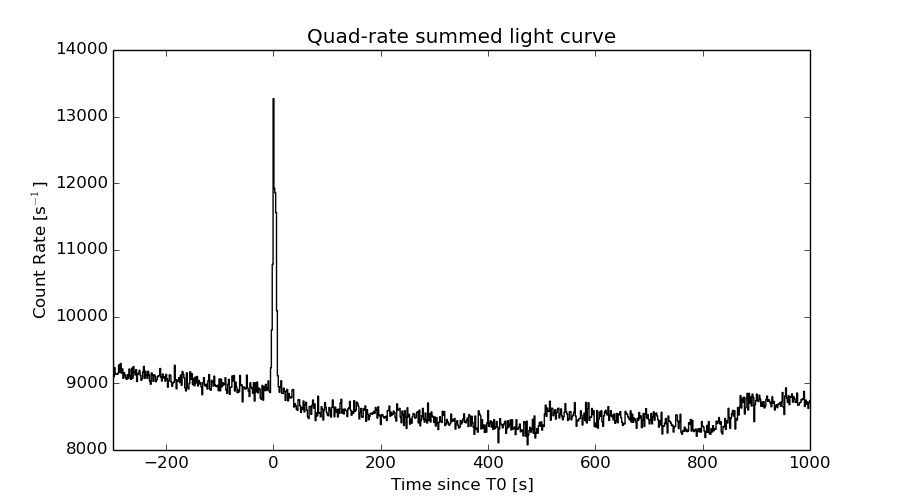
Quad-rate summed light curves (from T0-300s to T0+1000s)
Spectral Evolution

Spectra
Notes:
- 1) The fitting includes the systematic errors.
- 2) When the burst includes telescope slew time periods, the fitting uses an average response file made from multiple 5-s response files through out the slew time plus single time preiod for the non-slew times, and weighted by the total counts in the corresponding time period using addrmf. An average response file is needed becuase a spectral fit using the pre-slew DRM will introduce some errors in both a spectral shape and a normalization if the PHA file contains a lot of the slew/post-slew time interval.
- 3) For fits to more complicated models (e.g. a power-law over a cutoff power-law), the BAT team has decided to require a chi-square improvement of more than 6 for each extra dof.
Time averaged spectrum fit using the average DRM
Power-law model
Time interval is from   -3.624 sec. to    7.000 sec.

Spectral model in power-law:
------------------------------------------------------------
Parameters  : value       lower 90%   higher 90%
Photon index: 1.69065     ( -0.0655201   0.0659846 )
Norm@50keV  : 1.03078E-02    ( -0.00038195   0.000380709 )
------------------------------------------------------------
#Fit statistic : Chi-Squared =          81.38 using 59 PHA bins.
# Reduced chi-squared =          1.428 for     57 degrees of freedom
# Null hypothesis probability =   1.871530e-02

Photon flux (15-150 keV)    in 10.62 sec: 1.36455 ( -0.0499391  0.0500233 ) ph/cm2/s
Energy fluence (15-150 keV)             : 1.01431e-06 ( -3.9556e-08  3.974e-08 ) ergs/cm2
Cutoff power-law model

Time interval is from   -3.624 sec. to    7.000 sec.
Spectral model in the cutoff power-law:
------------------------------------------------------------
Parameters  : value       lower 90%   higher 90%
Photon index: 1.06516     ( -0.301807   0.281002 )
Epeak [keV] : 71.3598      ( -9.7975 20.7626 )
Norm@50keV  : 2.16475E-02    ( -0.00602186   0.00917112 )
------------------------------------------------------------
#Fit statistic : Chi-Squared =          65.68 using 59 PHA bins.
# Reduced chi-squared =          1.173 for     56 degrees of freedom
# Null hypothesis probability =   1.764728e-01

Photon flux (15-150 keV)    in 10.62 sec: 1.31123 ( -0.05463  0.05472 ) ph/cm2/s
Energy fluence (15-150 keV)             : 9.55128e-07 ( -4.68852e-08  4.71294e-08 ) ergs/cm2
Band function

Time interval is from   -3.624 sec. to    7.000 sec.

Spectral model in the Band function:
------------------------------------------------------------
Parameters  : value       lower 90%   higher 90%
alpha       : -1.06514   ( -0.210462   0.381106 )
beta        : -10.0000    ( 10   3.37508e-14 )
Epeak [keV] : 71.3460      ( -8.08637 20.7637 )
Norm@50keV   : 2.16463E-02    ( -0.00602421   0.0091708 )
------------------------------------------------------------
#Fit statistic : Chi-Squared =          65.68 using 59 PHA bins.
# Reduced chi-squared =          1.194 for     55 degrees of freedom
# Null hypothesis probability =   1.534921e-01

Photon flux (15-150 keV)    in 10.62 sec: 1.31656 (    ) ph/cm2/s
Energy fluence (15-150 keV)             : 9.62983e-07 ( -9.62909e-07  -4.4244e-08 ) ergs/cm2
Single BB
Spectral model blackbody:
------------------------------------------------------------
Parameters  : value    Lower 90%  Upper 90%
kT [keV]    : 12.9788  (  )
R^2/D10^2   : 0.243453  (   )
(R is the radius in km and D10 is the distance to the source in units of 10 kpc)
------------------------------------------------------------
#Fit statistic : Chi-Squared =         184.41 using 59 PHA bins.
# Reduced chi-squared =         3.2353 for     57 degrees of freedom
# Null hypothesis probability =   2.393955e-15

Energy  Fluence     90% Error
[keV]   [erg/cm2]   [erg/cm2]
15- 25  9.237e-08   6.144e-09
25- 50  3.176e-07   1.333e-08
50-150  3.379e-07   2.602e-08
15-150  7.478e-07   3.308e-08
Thermal bremsstrahlung (OTTB)
Spectral model: thermal bremsstrahlung
------------------------------------------------------------
Parameters  : value         Lower 90%    Upper 90%
kT [keV]    : 132.297       (      )
Norm        : 5.68414       (-0.250429     0.298026)
------------------------------------------------------------
#Fit statistic : Chi-Squared =          67.03 using 59 PHA bins.
# Reduced chi-squared =          1.176 for     57 degrees of freedom
# Null hypothesis probability =   1.707650e-01

Energy  Fluence     90% Error
[keV]   [erg/cm2]   [erg/cm2]
15- 25  1.556e-07   1.009e-08
25- 50  2.835e-07   1.720e-08
50-150  5.330e-07   1.335e-07
15-150  9.720e-07   1.492e-07
Double BB

Spectral model: bbodyrad<1> + bbodyrad<2>
------------------------------------------------------------
Parameters  : value         Lower 90%    Upper 90%
kT1 [keV]   : 7.88463        (-0.895247      0.897221)
R1^2/D10^2  : 1.01893        (-0.287655      0.467465)
kT2 [keV]   : 26.0011        (-3.88952      5.76206)
R2^2/D10^2  : 1.34754E-02    (-0.00699872   0.0119244)
------------------------------------------------------------
#Fit statistic : Chi-Squared =          60.51 using 59 PHA bins.
# Reduced chi-squared =          1.100 for     55 degrees of freedom
# Null hypothesis probability =   2.837163e-01

Energy  Fluence     90% Error
[keV]   [erg/cm2]   [erg/cm2]
15- 25  1.368e-07   1.561e-08
25- 50  3.005e-07   2.883e-08
50-150  5.254e-07   1.168e-07
15-150  9.627e-07   1.643e-07
Peak spectrum fit
Power-law model
Time interval is from    0.072 sec. to    1.072 sec.

Spectral model in power-law:
------------------------------------------------------------
Parameters  : value       lower 90%   higher 90%
Photon index: 1.36312     ( -0.095728   0.0963172 )
Norm@50keV  : 2.24282E-02    ( -0.00131145   0.00130894 )
------------------------------------------------------------
#Fit statistic : Chi-Squared =          69.24 using 59 PHA bins.
# Reduced chi-squared =          1.215 for     57 degrees of freedom
# Null hypothesis probability =   1.282873e-01

Photon flux (15-150 keV)    in 1 sec: 2.70935 ( -0.156725  0.156804 ) ph/cm2/s
Energy fluence (15-150 keV)             : 2.18414e-07 ( -1.43467e-08  1.44432e-08 ) ergs/cm2
Cutoff power-law model

Time interval is from    0.072 sec. to    1.072 sec.
Spectral model in the cutoff power-law:
------------------------------------------------------------
Parameters  : value       lower 90%   higher 90%
Photon index: 0.343012     ( -0.480413   0.431187 )
Epeak [keV] : 82.7631      ( -12.4096 24.8183 )
Norm@50keV  : 7.16592E-02    ( -0.0272669   0.0503768 )
------------------------------------------------------------
#Fit statistic : Chi-Squared =          50.61 using 59 PHA bins.
# Reduced chi-squared =         0.9037 for     56 degrees of freedom
# Null hypothesis probability =   6.784175e-01

Photon flux (15-150 keV)    in 1 sec: 2.59551 ( -0.16358  0.16349 ) ph/cm2/s
Energy fluence (15-150 keV)             : 2.03534e-07 ( -1.5637e-08  1.5775e-08 ) ergs/cm2
Band function
Time interval is from    0.072 sec. to    1.072 sec.

Spectral model in the Band function:
------------------------------------------------------------
Parameters  : value       lower 90%   higher 90%
alpha       : -0.342834   ( -0.330209   0.565089 )
beta        : -10.0000    ( 10   3.90799e-14 )
Epeak [keV] : 82.7437      ( -12.3967 24.8255 )
Norm@50keV   : 7.16771E-02    ( -0.0272528   0.0504379 )
------------------------------------------------------------
#Fit statistic : Chi-Squared =          50.61 using 59 PHA bins.
# Reduced chi-squared =         0.9202 for     55 degrees of freedom
# Null hypothesis probability =   6.429586e-01

Photon flux (15-150 keV)    in 1 sec: 2.61985 ( 4.38015  -0.19493 ) ph/cm2/s
Energy fluence (15-150 keV)             : 2.03555e-07 ( -2.03548e-07  -1.5713e-08 ) ergs/cm2
Single BB

Spectral model blackbody:
------------------------------------------------------------
Parameters  : value    Lower 90%  Upper 90%
kT [keV]    : 16.1140  (-1.07931  1.17453)
R^2/D10^2   : 0.253998  (-0.0541479   0.0677801)
(R is the radius in km and D10 is the distance to the source in units of 10 kpc)
------------------------------------------------------------
#Fit statistic : Chi-Squared =          78.67 using 59 PHA bins.
# Reduced chi-squared =          1.380 for     57 degrees of freedom
# Null hypothesis probability =   3.017578e-02

Energy  Fluence     90% Error
[keV]   [erg/cm2]   [erg/cm2]
15- 25  1.361e-08   1.515e-09
25- 50  5.764e-08   4.155e-09
50-150  1.049e-07   1.142e-08
15-150  1.761e-07   1.340e-08
Thermal bremsstrahlung (OTTB)
Spectral model: thermal bremsstrahlung
------------------------------------------------------------
Parameters  : value         Lower 90%    Upper 90%
kT [keV]    : 200.000       (      )
Norm        : 11.1601       (-0.639049     0.639048)
------------------------------------------------------------
#Fit statistic : Chi-Squared =          70.23 using 59 PHA bins.
# Reduced chi-squared =          1.232 for     57 degrees of freedom
# Null hypothesis probability =   1.120515e-01

Energy  Fluence     90% Error
[keV]   [erg/cm2]   [erg/cm2]
15- 25  2.779e-08   1.710e-09
25- 50  5.345e-08   4.970e-09
50-150  1.172e-07   2.455e-08
15-150  1.985e-07   2.615e-08
Double BB
Spectral model: bbodyrad<1> + bbodyrad<2>
------------------------------------------------------------
Parameters  : value         Lower 90%    Upper 90%
kT1 [keV]   : 6.34701        (-1.96459      2.68056)
R1^2/D10^2  : 2.47029        (-1.58526      5.32643)
kT2 [keV]   : 21.0326        (-2.73161      4.76347)
R2^2/D10^2  : 8.75398E-02    (-0.0499376   0.0501778)
------------------------------------------------------------
#Fit statistic : Chi-Squared =          49.81 using 59 PHA bins.
# Reduced chi-squared =         0.9057 for     55 degrees of freedom
# Null hypothesis probability =   6.725206e-01

Energy  Fluence     90% Error
[keV]   [erg/cm2]   [erg/cm2]
15- 25  2.158e-08   8.724e-09
25- 50  5.366e-08   1.380e-08
50-150  1.259e-07   3.077e-08
15-150  2.011e-07   3.770e-08
Pre-slew spectrum (Pre-slew PHA with pre-slew DRM)
Power-law model
Spectral model in power-law:
------------------------------------------------------------
Parameters  : value       lower 90%   higher 90%
Photon index: 1.69065     ( -0.0655201   0.0659846 )
Norm@50keV  : 1.03078E-02    ( -0.00038195   0.000380709 )
------------------------------------------------------------
#Fit statistic : Chi-Squared =          81.38 using 59 PHA bins.
# Reduced chi-squared =          1.428 for     57 degrees of freedom
# Null hypothesis probability =   1.871530e-02

Photon flux (15-150 keV)    in 10.62 sec: 1.36455 ( -0.0499391  0.0500233 ) ph/cm2/s
Energy fluence (15-150 keV)             : 1.01431e-06 ( -3.9556e-08  3.974e-08 ) ergs/cm2
Cutoff power-law model

Spectral model in the cutoff power-law:
------------------------------------------------------------
Parameters  : value       lower 90%   higher 90%
Photon index: 1.06516     ( -0.301807   0.281002 )
Epeak [keV] : 71.3598      ( -9.7975 20.7626 )
Norm@50keV  : 2.16475E-02    ( -0.00602186   0.00917112 )
------------------------------------------------------------
#Fit statistic : Chi-Squared =          65.68 using 59 PHA bins.
# Reduced chi-squared =          1.173 for     56 degrees of freedom
# Null hypothesis probability =   1.764728e-01

Photon flux (15-150 keV)    in 10.62 sec: 1.31123 ( -0.05463  0.05472 ) ph/cm2/s
Energy fluence (15-150 keV)             : 9.55128e-07 ( -4.68852e-08  4.71294e-08 ) ergs/cm2
Band function
Spectral model in the Band function:
------------------------------------------------------------
Parameters  : value       lower 90%   higher 90%
alpha       : -1.06514   ( -0.210462   0.381106 )
beta        : -10.0000    ( 10   5.32907e-15 )
Epeak [keV] : 71.3460      ( -8.08635 20.7637 )
Norm@50keV   : 2.16463E-02    ( -0.00602421   0.0091708 )
------------------------------------------------------------
#Fit statistic : Chi-Squared =          65.68 using 59 PHA bins.
# Reduced chi-squared =          1.194 for     55 degrees of freedom
# Null hypothesis probability =   1.534921e-01

Photon flux (15-150 keV)    in 10.62 sec: 1.31656 (    ) ph/cm2/s
Energy fluence (15-150 keV)             : 9.62983e-07 ( -9.62909e-07  -4.4244e-08 ) ergs/cm2
S(25-50 keV) vs. S(50-100 keV) plot
S(25-50 keV)  = 2.74e-07
S(50-100 keV) = 3.39e-07
T90 vs. Hardness ratio plot
T90                                   = 7.97600001096725 sec.
Hardness ratio (energy fluence ratio) = 1.23723
Color vs. Color plot

Count Ratio  (25-50 keV) / (15-25 keV) = 1.39596
Count Ratio (50-100 keV) / (15-25 keV) = 0.804453
Mask shadow pattern

IMX = -6.190908599602463E-02, IMY = -2.064984497034719E-01
TIME vs. PHA plot around the trigger time
Blue+Cyan dotted lines: Time interval of the scaled map
From 0.000000 to 1.024000
TIME vs. DetID plot around the trigger time
Blue+Cyan dotted lines: Time interval of the scaled map
From 0.000000 to 1.024000
100 us light curve (15-350 keV)
Blue+Cyan dotted lines: Time interval of the scaled map
From 0.000000 to 1.024000
Spacecraft aspect plot
Bright source in the pre-burst/pre-slew/post-slew images
Pre-burst image of 15-350 keV band
Time interval of the image:
-239.104000 -3.624000

# RAcent  DECcent POSerr Theta    Phi  PeakCts   SNR AngSep     Name
#  [deg]    [deg]    ['] [deg]  [deg]                   [']
 83.6150  22.0112    0.6  49.5  -25.7   8.6481  20.4    1.0	Crab
 64.6639   6.9789    3.3  57.3    2.3   3.3761   3.5 ------	UNKNOWN
 53.4431  47.9566    2.6  15.4   -5.5   0.6616   4.4 ------	UNKNOWN
 96.9197  48.9698    2.5  33.9  -63.3   1.2209   4.6 ------	UNKNOWN
Pre-slew background subtracted image of 15-350 keV band
Time interval of the image:
-3.624000 7.000000

# RAcent  DECcent POSerr Theta    Phi  PeakCts   SNR AngSep     Name
#  [deg]    [deg]    ['] [deg]  [deg]                   [']
 83.6598  22.1134    3.2  49.5  -25.8  -0.3301  -3.6    6.1	Crab
 18.1355  55.7922    0.3  12.2  106.7   1.7523  45.8 ------	UNKNOWN
 72.1308  39.3778    2.5  29.6  -25.4   0.2013   4.7 ------	UNKNOWN
138.1706  73.1337    2.4  35.4 -117.6   0.2933   4.8 ------	UNKNOWN
Post-slew image of 15-350 keV band
Time interval of the image:
49.796600 480.996660

# RAcent  DECcent POSerr Theta    Phi  PeakCts   SNR AngSep     Name
#  [deg]    [deg]    ['] [deg]  [deg]                   [']
308.1878  41.0674   23.4  46.5  147.4   0.3993   0.5    7.7	Cyg X-3
326.2452  38.4500    7.0  38.2  130.4   0.9238   1.7    8.4	Cyg X-2
 12.4766  54.2921    2.6   3.6  112.4   0.9792   4.5 ------	UNKNOWN
319.2760  67.7958    2.8  28.9 -177.0   1.0224   4.1 ------	UNKNOWN
 58.0326  11.7669    2.1  53.8   -6.0   3.6433   5.4 ------	UNKNOWN
 56.2749  20.3063    2.2  45.4   -9.3   2.0072   5.3 ------	UNKNOWN
242.2373  76.0076    3.7  45.2 -148.7   1.5481   3.2 ------	UNKNOWN
 83.1912  31.4839    2.7  50.6  -44.6   5.5626   4.3 ------	UNKNOWN
Plot creation:
Sun May 31 12:15:23 EDT 2015