Click here for the BAT GCN circular template
Image
Pre-slew 15.0-350.0 keV image (Event data)
#   RAcent    DECcent   POSerr    Theta     Phi              Peak Cts       SNR   Name
   58.2190    -0.7201   0.0057    26.2247    67.7340         1.6576966     33.782 TRIG_00228006

Foreground time interval of the image:
 -0.944  10.421 (delta_t =  11.365 [sec])
Background time interval of the image:
-239.280  -0.944 (delta_t = 238.336 [sec])
Lightcurves
Notes:
- 1) The mask-weighted light curves are using the flight position.
- 2) Multiple plots of different time binning/intervals are shown to cover all scenarios of short/long GRBs, rate/image triggers, and real/false positives.
- 3) For all the mask-weighted lightcurves, the y-axis units are counts/sec/det where a det is 0.4 x 0.4 = 0.16 sq cm.
- 4) The verticle lines correspond to following: green dotted lines are T50 interval, black dotted lines are T90 interval, blue solid line(s) is a spacecraft slew start time, and orange solid line(s) is a spacecraft slew end time.
- 5) Time of each bin is in the middle of the bin.
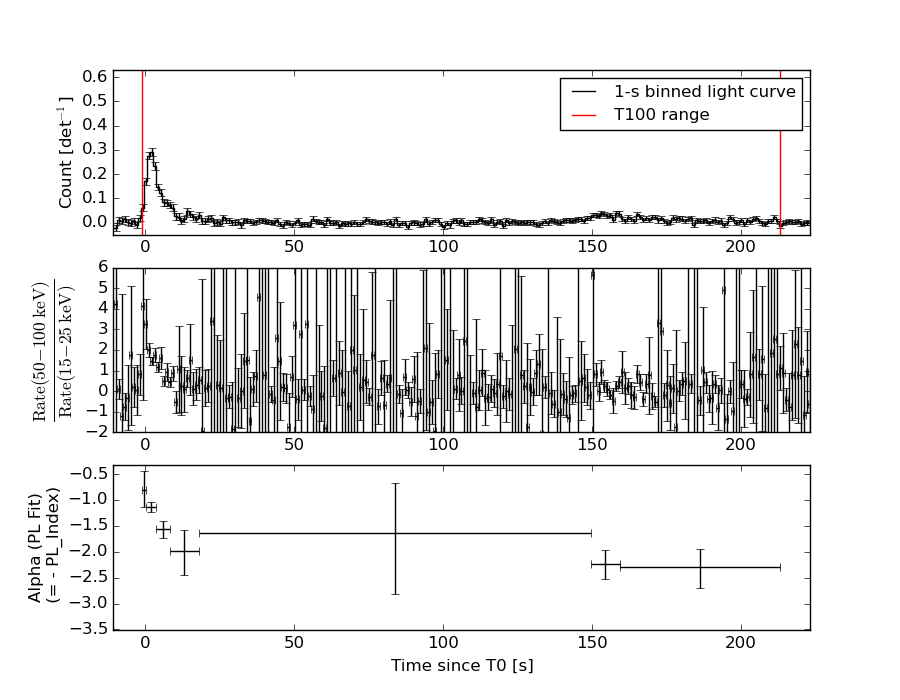
1 s binning
From T0-310 s to T0+310 s
From T100_start - 20 s to T100_end + 30 s

Full time interval
64 ms binning
Full time interval
From T100_start to T100_end
From T0-5 sec to T0+5 sec
16 ms binning
From T100_start-5 s to T100_start+5 s
Blue+Cyan dotted lines: Time interval of the scaled map
From 0.000000 to 0.512000
8 ms binning
From T100_start-3 s to T100_start+3 s
Blue+Cyan dotted lines: Time interval of the scaled map
From 0.000000 to 0.512000
2 ms binning
From T100_start-1 s to T100_start+1 s
Blue+Cyan dotted lines: Time interval of the scaled map
From 0.000000 to 0.512000
SN=5 or 10 sec. binning (whichever binning is satisfied first)
SN=5 or 10 sec. binning (T < 200 sec)
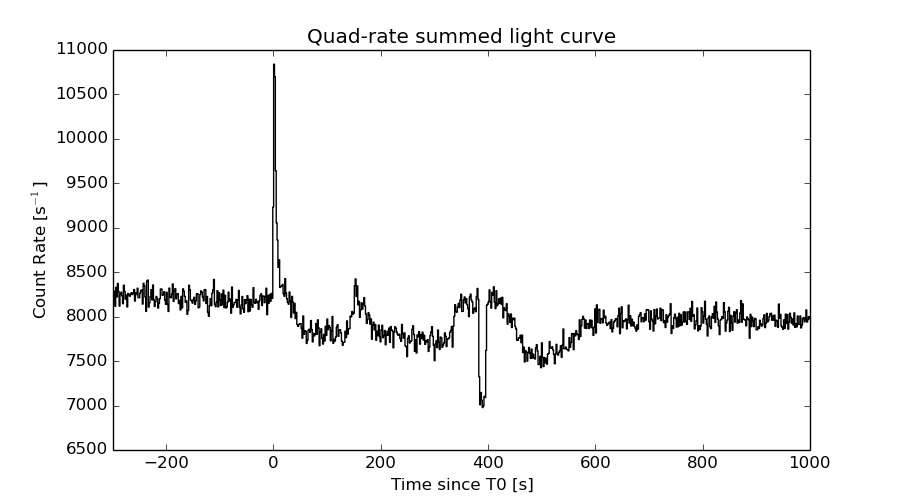
Quad-rate summed light curves (from T0-300s to T0+1000s)
Spectral Evolution
Spectra
Notes:
- 1) The fitting includes the systematic errors.
- 2) When the burst includes telescope slew time periods, the fitting uses an average response file made from multiple 5-s response files through out the slew time plus single time preiod for the non-slew times, and weighted by the total counts in the corresponding time period using addrmf. An average response file is needed becuase a spectral fit using the pre-slew DRM will introduce some errors in both a spectral shape and a normalization if the PHA file contains a lot of the slew/post-slew time interval.
- 3) For fits to more complicated models (e.g. a power-law over a cutoff power-law), the BAT team has decided to require a chi-square improvement of more than 6 for each extra dof.
Time averaged spectrum fit using the average DRM
Power-law model

Time interval is from   -0.944 sec. to  213.224 sec.

Spectral model in power-law:
------------------------------------------------------------
Parameters  : value       lower 90%   higher 90%
Photon index: 1.65742     ( -0.137141   0.139608 )
Norm@50keV  : 8.60359E-04    ( -7.15405e-05   7.08375e-05 )
------------------------------------------------------------
#Fit statistic : Chi-Squared =          60.64 using 59 PHA bins.
# Reduced chi-squared =          1.064 for     57 degrees of freedom
# Null hypothesis probability =   3.460905e-01

Photon flux (15-150 keV)    in 214.2 sec: 0.112618 ( -0.00866514  0.00867234 ) ph/cm2/s
Energy fluence (15-150 keV)             : 1.71272e-06 ( -1.51312e-07  1.53076e-07 ) ergs/cm2
Cutoff power-law model
Time interval is from   -0.944 sec. to  213.224 sec.
Spectral model in the cutoff power-law:
------------------------------------------------------------
Parameters  : value       lower 90%   higher 90%
Photon index: 1.23371     ( -0.635416   0.485454 )
Epeak [keV] : 84.0929      ( -26.6483 -84.0948 )
Norm@50keV  : 1.44820E-03    ( -0.000630344   0.00168077 )
------------------------------------------------------------
#Fit statistic : Chi-Squared =          58.95 using 59 PHA bins.
# Reduced chi-squared =          1.053 for     56 degrees of freedom
# Null hypothesis probability =   3.681247e-01

Photon flux (15-150 keV)    in 214.2 sec: 0.110304 ( -0.009202  0.009156 ) ph/cm2/s
Energy fluence (15-150 keV)             : 1.64333e-06 ( -1.76291e-07  1.77679e-07 ) ergs/cm2
Band function
Time interval is from   -0.944 sec. to  213.224 sec.

Spectral model in the Band function:
------------------------------------------------------------
Parameters  : value       lower 90%   higher 90%
alpha       : -1.01600   ( 1.01842   5.0969 )
beta        : -1.95296    ( 1.95409   0.362381 )
Epeak [keV] : 64.9589      ( -65.1734 -65.1734 )
Norm@50keV   : 1.97117E-03    ( -0.00114484   0 )
------------------------------------------------------------
#Fit statistic : Chi-Squared =          58.58 using 59 PHA bins.
# Reduced chi-squared =          1.065 for     55 degrees of freedom
# Null hypothesis probability =   3.454036e-01

Photon flux (15-150 keV)    in 214.2 sec:  (    ) ph/cm2/s
Energy fluence (15-150 keV)             : 1.64843e-06 ( 0  0 ) ergs/cm2
Single BB

Spectral model blackbody:
------------------------------------------------------------
Parameters  : value    Lower 90%  Upper 90%
kT [keV]    : 12.7206  (-1.15171  1.29523)
R^2/D10^2   : 2.20904E-02  (-0.00657701   0.00914566)
(R is the radius in km and D10 is the distance to the source in units of 10 kpc)
------------------------------------------------------------
#Fit statistic : Chi-Squared =          89.86 using 59 PHA bins.
# Reduced chi-squared =          1.576 for     57 degrees of freedom
# Null hypothesis probability =   3.580280e-03

Energy  Fluence     90% Error
[keV]   [erg/cm2]   [erg/cm2]
15- 25  1.624e-07   2.405e-08
25- 50  5.462e-07   5.558e-08
50-150  5.516e-07   9.810e-08
15-150  1.260e-06   1.115e-07
Thermal bremsstrahlung (OTTB)
Spectral model: thermal bremsstrahlung
------------------------------------------------------------
Parameters  : value         Lower 90%    Upper 90%
kT [keV]    : 145.978       (-45.694      -144.671)
Norm        : 0.464229       (-0.03989     0.0262335)
------------------------------------------------------------
#Fit statistic : Chi-Squared =          58.98 using 59 PHA bins.
# Reduced chi-squared =          1.035 for     57 degrees of freedom
# Null hypothesis probability =   4.030335e-01

Energy  Fluence     90% Error
[keV]   [erg/cm2]   [erg/cm2]
15- 25  2.560e-07   2.977e-08
25- 50  4.725e-07   6.887e-08
50-150  9.222e-07   4.091e-07
15-150  1.651e-06   4.569e-07
Double BB
Spectral model: bbodyrad<1> + bbodyrad<2>
------------------------------------------------------------
Parameters  : value         Lower 90%    Upper 90%
kT1 [keV]   : 7.02472        (-2.58319      2.58108)
R1^2/D10^2  : 0.120091        (-0.0714271      0.456584)
kT2 [keV]   : 23.3426        (-6.89461      23.1529)
R2^2/D10^2  : 1.80088E-03    (-0.00159973   0.00554638)
------------------------------------------------------------
#Fit statistic : Chi-Squared =          61.82 using 59 PHA bins.
# Reduced chi-squared =          1.124 for     55 degrees of freedom
# Null hypothesis probability =   2.457653e-01

Energy  Fluence     90% Error
[keV]   [erg/cm2]   [erg/cm2]
15- 25  2.425e-07   9.908e-08
25- 50  4.891e-07   1.360e-07
50-150  8.888e-07   4.591e-07
15-150  1.620e-06   5.701e-07
Peak spectrum fit
Power-law model
Time interval is from    1.156 sec. to    2.156 sec.

Spectral model in power-law:
------------------------------------------------------------
Parameters  : value       lower 90%   higher 90%
Photon index: 1.21086     ( -0.145699   0.144936 )
Norm@50keV  : 2.06417E-02    ( -0.00172183   0.00172128 )
------------------------------------------------------------
#Fit statistic : Chi-Squared =          81.87 using 59 PHA bins.
# Reduced chi-squared =          1.436 for     57 degrees of freedom
# Null hypothesis probability =   1.710659e-02

Photon flux (15-150 keV)    in 1 sec: 2.42668 ( -0.206533  0.206801 ) ph/cm2/s
Energy fluence (15-150 keV)             : 2.08782e-07 ( -1.95908e-08  1.97022e-08 ) ergs/cm2
Cutoff power-law model
Time interval is from    1.156 sec. to    2.156 sec.
Spectral model in the cutoff power-law:
------------------------------------------------------------
Parameters  : value       lower 90%   higher 90%
Photon index: 1.06151     ( -0.550151   0.278639 )
Epeak [keV] : 342.373      ( -342.244 -342.244 )
Norm@50keV  : 2.42987E-02    ( -0.0051949   0.0217325 )
------------------------------------------------------------
#Fit statistic : Chi-Squared =          81.66 using 59 PHA bins.
# Reduced chi-squared =          1.458 for     56 degrees of freedom
# Null hypothesis probability =   1.424005e-02

Photon flux (15-150 keV)    in 1 sec: 2.41325 ( -0.21011  0.20947 ) ph/cm2/s
Energy fluence (15-150 keV)             : 2.07247e-07 ( -2.0728e-08  2.0556e-08 ) ergs/cm2
Band function

Time interval is from    1.156 sec. to    2.156 sec.

Spectral model in the Band function:
------------------------------------------------------------
Parameters  : value       lower 90%   higher 90%
alpha       : -0.997463   ( 0.883912   0.883912 )
beta        : -1.39274    ( 1.38844   0.316598 )
Epeak [keV] : 245.174      ( -258.349 -258.349 )
Norm@50keV   : 2.62438E-02    ( -0.00672307   0.718985 )
------------------------------------------------------------
#Fit statistic : Chi-Squared =          81.63 using 59 PHA bins.
# Reduced chi-squared =          1.484 for     55 degrees of freedom
# Null hypothesis probability =   1.136692e-02

Photon flux (15-150 keV)    in 1 sec:  (    ) ph/cm2/s
Energy fluence (15-150 keV)             : 0 ( 0  0 ) ergs/cm2
Single BB

Spectral model blackbody:
------------------------------------------------------------
Parameters  : value    Lower 90%  Upper 90%
kT [keV]    : 19.0575  (-1.99003  2.29381)
R^2/D10^2   : 0.131603  (-0.0410678   0.0577491)
(R is the radius in km and D10 is the distance to the source in units of 10 kpc)
------------------------------------------------------------
#Fit statistic : Chi-Squared =         109.95 using 59 PHA bins.
# Reduced chi-squared =         1.9290 for     57 degrees of freedom
# Null hypothesis probability =   3.220789e-05

Energy  Fluence     90% Error
[keV]   [erg/cm2]   [erg/cm2]
15- 25  9.385e-09   1.650e-09
25- 50  4.523e-08   6.140e-09
50-150  1.208e-07   1.804e-08
15-150  1.754e-07   1.865e-08
Thermal bremsstrahlung (OTTB)
Spectral model: thermal bremsstrahlung
------------------------------------------------------------
Parameters  : value         Lower 90%    Upper 90%
kT [keV]    : 200.000       (      )
Norm        : 9.96020       (-0.846627     0.846583)
------------------------------------------------------------
#Fit statistic : Chi-Squared =          96.95 using 59 PHA bins.
# Reduced chi-squared =          1.701 for     57 degrees of freedom
# Null hypothesis probability =   7.626999e-04

Energy  Fluence     90% Error
[keV]   [erg/cm2]   [erg/cm2]
15- 25  2.480e-08   3.325e-09
25- 50  4.770e-08   9.825e-09
50-150  1.046e-07   4.025e-08
15-150  1.771e-07   6.054e-08
Double BB
Spectral model: bbodyrad<1> + bbodyrad<2>
------------------------------------------------------------
Parameters  : value         Lower 90%    Upper 90%
kT1 [keV]   : 5.35495        (-1.60585      2.66405)
R1^2/D10^2  : 4.92360        (-3.7208      17.3793)
kT2 [keV]   : 25.4257        (-4.06572      7.60285)
R2^2/D10^2  : 4.58279E-02    (-0.0270944   0.0374868)
------------------------------------------------------------
#Fit statistic : Chi-Squared =          82.13 using 59 PHA bins.
# Reduced chi-squared =          1.493 for     55 degrees of freedom
# Null hypothesis probability =   1.032166e-02

Energy  Fluence     90% Error
[keV]   [erg/cm2]   [erg/cm2]
15- 25  2.073e-08   9.836e-09
25- 50  4.123e-08   1.081e-08
50-150  1.402e-07   3.325e-08
15-150  2.022e-07   4.320e-08
Pre-slew spectrum (Pre-slew PHA with pre-slew DRM)
Power-law model
Spectral model in power-law:
------------------------------------------------------------
Parameters  : value       lower 90%   higher 90%
Photon index: 1.29520     ( -0.0852691   0.0848483 )
Norm@50keV  : 9.72469E-03    ( -0.000468157   0.000468153 )
------------------------------------------------------------
#Fit statistic : Chi-Squared =          66.23 using 59 PHA bins.
# Reduced chi-squared =          1.162 for     57 degrees of freedom
# Null hypothesis probability =   1.884527e-01

Photon flux (15-150 keV)    in 11.36 sec: 1.15916 ( -0.0583476  0.0584448 ) ph/cm2/s
Energy fluence (15-150 keV)             : 1.09296e-06 ( -5.75265e-08  5.76996e-08 ) ergs/cm2
Cutoff power-law model
Spectral model in the cutoff power-law:
------------------------------------------------------------
Parameters  : value       lower 90%   higher 90%
Photon index: 0.923355     ( -0.358377   0.330527 )
Epeak [keV] : 156.254      ( -51.5304 623.13 )
Norm@50keV  : 1.45652E-02    ( -0.00429686   0.00667649 )
------------------------------------------------------------
#Fit statistic : Chi-Squared =          62.50 using 59 PHA bins.
# Reduced chi-squared =          1.116 for     56 degrees of freedom
# Null hypothesis probability =   2.563764e-01

Photon flux (15-150 keV)    in 11.36 sec: 1.13798 ( -0.06124  0.06125 ) ph/cm2/s
Energy fluence (15-150 keV)             : 1.06823e-06 ( -6.26129e-08  6.22085e-08 ) ergs/cm2
Band function

Spectral model in the Band function:
------------------------------------------------------------
Parameters  : value       lower 90%   higher 90%
alpha       : -0.923340   ( -0.280761   0.241142 )
beta        : -10.0000    ( 10   7.10543e-15 )
Epeak [keV] : 156.230      ( -36.2899 619.882 )
Norm@50keV   : 1.45643E-02    ( -0.0042967   0.00667766 )
------------------------------------------------------------
#Fit statistic : Chi-Squared =          62.50 using 59 PHA bins.
# Reduced chi-squared =          1.136 for     55 degrees of freedom
# Null hypothesis probability =   2.272106e-01

Photon flux (15-150 keV)    in 11.36 sec: 1.13622 ( 5.86378  -0.06174 ) ph/cm2/s
Energy fluence (15-150 keV)             : 0 ( 0  0 ) ergs/cm2
S(25-50 keV) vs. S(50-100 keV) plot
S(25-50 keV)  = 4.55e-07
S(50-100 keV) = 5.77e-07
T90 vs. Hardness ratio plot

T90                                   = 189.980000019073 sec.
Hardness ratio (energy fluence ratio) = 1.26813
Color vs. Color plot
Count Ratio  (25-50 keV) / (15-25 keV) = 1.35046
Count Ratio (50-100 keV) / (15-25 keV) = 0.809545
Mask shadow pattern
IMX = 1.866490220671386E-01, IMY = -4.558668020498187E-01
TIME vs. PHA plot around the trigger time
Blue+Cyan dotted lines: Time interval of the scaled map
From 0.000000 to 0.512000
TIME vs. DetID plot around the trigger time
Blue+Cyan dotted lines: Time interval of the scaled map
From 0.000000 to 0.512000
100 us light curve (15-350 keV)
Blue+Cyan dotted lines: Time interval of the scaled map
From 0.000000 to 0.512000
Spacecraft aspect plot
Bright source in the pre-burst/pre-slew/post-slew images
Pre-burst image of 15-350 keV band
Time interval of the image:
-239.280000 -0.944000

# RAcent  DECcent POSerr Theta    Phi  PeakCts   SNR AngSep     Name
#  [deg]    [deg]    ['] [deg]  [deg]                   [']
 83.6343  22.0144    0.2   8.5 -145.7  10.7271  61.9    0.1	Crab
 41.9862   1.2142    2.7  39.7   85.0   2.9622   4.2 ------	UNKNOWN
 54.5608  -1.6978    2.3  29.8   70.4   1.4175   5.0 ------	UNKNOWN
 86.1498 -34.2258    2.7  48.8    3.9   1.7378   4.3 ------	UNKNOWN
 84.2354  64.8199    2.8  50.7 -166.9   1.7204   4.1 ------	UNKNOWN
108.7337  -4.3360    2.2  34.0  -48.3   1.3231   5.2 ------	UNKNOWN
Pre-slew background subtracted image of 15-350 keV band
Time interval of the image:
-0.944000 10.420590

# RAcent  DECcent POSerr Theta    Phi  PeakCts   SNR AngSep     Name
#  [deg]    [deg]    ['] [deg]  [deg]                   [']
 83.6014  22.0005    5.2   8.5 -145.9  -0.0732  -2.2    2.0	Crab
 58.2190  -0.7201    0.3  26.2   67.7   1.6579  33.8 ------	UNKNOWN
Post-slew image of 15-350 keV band
Time interval of the image:
58.020590 316.020590

# RAcent  DECcent POSerr Theta    Phi  PeakCts   SNR AngSep     Name
#  [deg]    [deg]    ['] [deg]  [deg]                   [']
 83.6297  22.0119    0.3  33.6 -126.7  10.8382  41.7    0.2	Crab
 42.4765 -13.1534    2.5  19.9   58.1   0.8717   4.6 ------	UNKNOWN
 58.2256  -0.7029    1.7   0.0 -155.9   1.1940   6.6 ------	UNKNOWN
 68.6379 -43.0310    2.7  43.3   -3.8   1.2286   4.3 ------	UNKNOWN
 91.7612  44.1909    2.5  53.9 -143.3   4.6871   4.7 ------	UNKNOWN
Plot creation:
Sun May 31 12:11:29 EDT 2015