Click here for the BAT GCN circular template
Image
Pre-slew 15.0-350.0 keV image (Event data)
#   RAcent    DECcent   POSerr    Theta     Phi              Peak Cts       SNR   Name
   31.8254     0.3321   0.0075    26.4050    89.2068         4.1098168     25.719 TRIG_00228581

Foreground time interval of the image:
-12.980  11.125 (delta_t =  24.105 [sec])
Background time interval of the image:
-19.475 -12.980 (delta_t =   6.495 [sec])
Lightcurves
Notes:
- 1) The mask-weighted light curves are using the flight position.
- 2) Multiple plots of different time binning/intervals are shown to cover all scenarios of short/long GRBs, rate/image triggers, and real/false positives.
- 3) For all the mask-weighted lightcurves, the y-axis units are counts/sec/det where a det is 0.4 x 0.4 = 0.16 sq cm.
- 4) The verticle lines correspond to following: green dotted lines are T50 interval, black dotted lines are T90 interval, blue solid line(s) is a spacecraft slew start time, and orange solid line(s) is a spacecraft slew end time.
- 5) Time of each bin is in the middle of the bin.
1 s binning
From T0-310 s to T0+310 s
From T100_start - 20 s to T100_end + 30 s

Full time interval

64 ms binning
Full time interval

From T100_start to T100_end

From T0-5 sec to T0+5 sec

16 ms binning
From T100_start-5 s to T100_start+5 s
Blue+Cyan dotted lines: Time interval of the scaled map
From 0.000000 to 1.024000
8 ms binning
From T100_start-3 s to T100_start+3 s
Blue+Cyan dotted lines: Time interval of the scaled map
From 0.000000 to 1.024000
2 ms binning
From T100_start-1 s to T100_start+1 s
Blue+Cyan dotted lines: Time interval of the scaled map
From 0.000000 to 1.024000
SN=5 or 10 sec. binning (whichever binning is satisfied first)
SN=5 or 10 sec. binning (T < 200 sec)
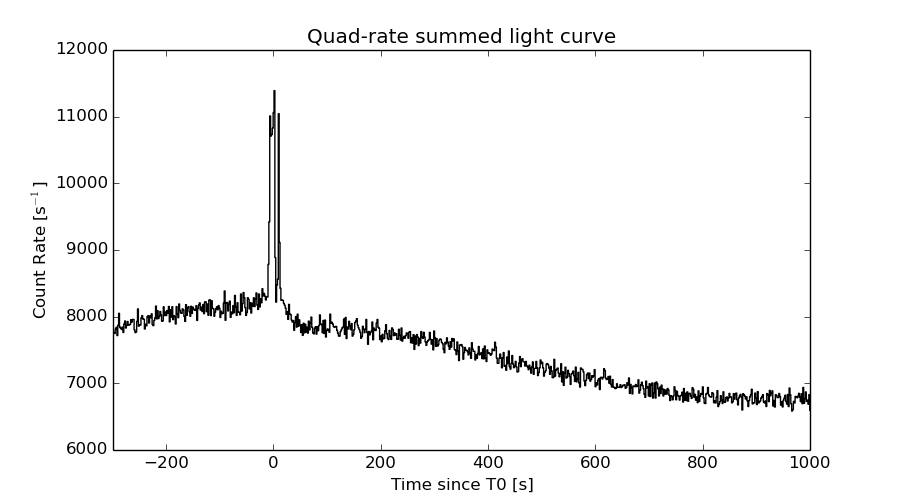
Quad-rate summed light curves (from T0-300s to T0+1000s)
Spectral Evolution

Spectra
Notes:
- 1) The fitting includes the systematic errors.
- 2) When the burst includes telescope slew time periods, the fitting uses an average response file made from multiple 5-s response files through out the slew time plus single time preiod for the non-slew times, and weighted by the total counts in the corresponding time period using addrmf. An average response file is needed becuase a spectral fit using the pre-slew DRM will introduce some errors in both a spectral shape and a normalization if the PHA file contains a lot of the slew/post-slew time interval.
- 3) For fits to more complicated models (e.g. a power-law over a cutoff power-law), the BAT team has decided to require a chi-square improvement of more than 6 for each extra dof.
Time averaged spectrum fit using the average DRM
Power-law model
Time interval is from  -12.980 sec. to   15.512 sec.

Spectral model in power-law:
------------------------------------------------------------
Parameters  : value       lower 90%   higher 90%
Photon index: 1.32426     ( -0.0594856   0.0593623 )
Norm@50keV  : 1.02825E-02    ( -0.000338894   0.000338894 )
------------------------------------------------------------
#Fit statistic : Chi-Squared =          54.35 using 59 PHA bins.
# Reduced chi-squared =         0.9534 for     57 degrees of freedom
# Null hypothesis probability =   5.752514e-01

Photon flux (15-150 keV)    in 28.49 sec: 1.23238 ( -0.0430359  0.0431063 ) ph/cm2/s
Energy fluence (15-150 keV)             : 2.87812e-06 ( -1.02779e-07  1.02999e-07 ) ergs/cm2
Cutoff power-law model
Time interval is from  -12.980 sec. to   15.512 sec.
Spectral model in the cutoff power-law:
------------------------------------------------------------
Parameters  : value       lower 90%   higher 90%
Photon index: 0.927525     ( -0.257859   0.243389 )
Epeak [keV] : 147.687      ( -37.4967 138.491 )
Norm@50keV  : 1.57030E-02    ( -0.00350909   0.00482301 )
------------------------------------------------------------
#Fit statistic : Chi-Squared =          46.35 using 59 PHA bins.
# Reduced chi-squared =         0.8278 for     56 degrees of freedom
# Null hypothesis probability =   8.174606e-01

Photon flux (15-150 keV)    in 28.49 sec: 1.20462 ( -0.04598  0.04604 ) ph/cm2/s
Energy fluence (15-150 keV)             : 2.80779e-06 ( -1.12969e-07  1.12516e-07 ) ergs/cm2
Band function

Time interval is from  -12.980 sec. to   15.512 sec.

Spectral model in the Band function:
------------------------------------------------------------
Parameters  : value       lower 90%   higher 90%
alpha       : -0.771033   ( -0.358632   1.73043 )
beta        : -1.57751    ( 1.57751   0.188965 )
Epeak [keV] : 110.929      ( -69.831 128.047 )
Norm@50keV   : 1.92177E-02    ( -0.00648216   0.0784244 )
------------------------------------------------------------
#Fit statistic : Chi-Squared =          45.49 using 59 PHA bins.
# Reduced chi-squared =         0.8271 for     55 degrees of freedom
# Null hypothesis probability =   8.159656e-01

Photon flux (15-150 keV)    in 28.49 sec:  (    ) ph/cm2/s
Energy fluence (15-150 keV)             : 0 ( 0  0 ) ergs/cm2
Single BB

Spectral model blackbody:
------------------------------------------------------------
Parameters  : value    Lower 90%  Upper 90%
kT [keV]    : 17.8561  (  )
R^2/D10^2   : 7.92370E-02  (   )
(R is the radius in km and D10 is the distance to the source in units of 10 kpc)
------------------------------------------------------------
#Fit statistic : Chi-Squared =         189.46 using 59 PHA bins.
# Reduced chi-squared =         3.3238 for     57 degrees of freedom
# Null hypothesis probability =   3.987082e-16

Energy  Fluence     90% Error
[keV]   [erg/cm2]   [erg/cm2]
15- 25  1.445e-07   9.843e-09
25- 50  6.642e-07   3.120e-08
50-150  1.534e-06   9.259e-08
15-150  2.343e-06   9.103e-08
Thermal bremsstrahlung (OTTB)
Spectral model: thermal bremsstrahlung
------------------------------------------------------------
Parameters  : value         Lower 90%    Upper 90%
kT [keV]    : 200.000       (      )
Norm        : 5.16091       (-0.1715     0.171444)
------------------------------------------------------------
#Fit statistic : Chi-Squared =          92.62 using 59 PHA bins.
# Reduced chi-squared =          1.625 for     57 degrees of freedom
# Null hypothesis probability =   1.993279e-03

Energy  Fluence     90% Error
[keV]   [erg/cm2]   [erg/cm2]
15- 25  3.662e-07   1.396e-08
25- 50  7.045e-07   2.521e-08
50-150  1.545e-06   5.470e-08
15-150  2.616e-06   9.046e-08
Double BB
Spectral model: bbodyrad<1> + bbodyrad<2>
------------------------------------------------------------
Parameters  : value         Lower 90%    Upper 90%
kT1 [keV]   : 7.96555        (-1.27366      1.4803)
R1^2/D10^2  : 0.673050        (-0.261633      0.499067)
kT2 [keV]   : 28.3851        (-3.53665      5.79638)
R2^2/D10^2  : 1.34351E-02    (-0.00647933   0.00848954)
------------------------------------------------------------
#Fit statistic : Chi-Squared =          52.07 using 59 PHA bins.
# Reduced chi-squared =         0.9468 for     55 degrees of freedom
# Null hypothesis probability =   5.871743e-01

Energy  Fluence     90% Error
[keV]   [erg/cm2]   [erg/cm2]
15- 25  2.692e-07   3.513e-08
25- 50  6.815e-07   5.826e-08
50-150  1.843e-06   2.140e-07
15-150  2.794e-06   2.620e-07
Peak spectrum fit
Power-law model
Time interval is from    0.540 sec. to    1.540 sec.

Spectral model in power-law:
------------------------------------------------------------
Parameters  : value       lower 90%   higher 90%
Photon index: 1.06905     ( -0.12622   0.124686 )
Norm@50keV  : 2.64976E-02    ( -0.00200854   0.00200716 )
------------------------------------------------------------
#Fit statistic : Chi-Squared =          59.87 using 59 PHA bins.
# Reduced chi-squared =          1.050 for     57 degrees of freedom
# Null hypothesis probability =   3.718275e-01

Photon flux (15-150 keV)    in 1 sec: 3.06499 ( -0.237314  0.237619 ) ph/cm2/s
Energy fluence (15-150 keV)             : 2.79835e-07 ( -2.30846e-08  2.31745e-08 ) ergs/cm2
Cutoff power-law model

Time interval is from    0.540 sec. to    1.540 sec.
Spectral model in the cutoff power-law:
------------------------------------------------------------
Parameters  : value       lower 90%   higher 90%
Photon index: 0.274293     ( -0.637936   0.555017 )
Epeak [keV] : 123.016      ( -31.616 144.627 )
Norm@50keV  : 6.06299E-02    ( -0.0261365   0.0540655 )
------------------------------------------------------------
#Fit statistic : Chi-Squared =          53.62 using 59 PHA bins.
# Reduced chi-squared =         0.9575 for     56 degrees of freedom
# Null hypothesis probability =   5.653944e-01

Photon flux (15-150 keV)    in 1 sec: 2.98275 ( -0.24543  0.24479 ) ph/cm2/s
Energy fluence (15-150 keV)             : 2.70736e-07 ( -2.4738e-08  2.4571e-08 ) ergs/cm2
Band function
Time interval is from    0.540 sec. to    1.540 sec.

Spectral model in the Band function:
------------------------------------------------------------
Parameters  : value       lower 90%   higher 90%
alpha       : -0.279209   ( -0.548495   0.461271 )
beta        : -9.37149    ( 9.37164   19.3716 )
Epeak [keV] : 123.533      ( -20.3867 53.0857 )
Norm@50keV   : 6.02848E-02    ( -0.0256589   0.0174563 )
------------------------------------------------------------
#Fit statistic : Chi-Squared =          53.62 using 59 PHA bins.
# Reduced chi-squared =         0.9750 for     55 degrees of freedom
# Null hypothesis probability =   5.273807e-01

Photon flux (15-150 keV)    in 1 sec: 2.98341 (    ) ph/cm2/s
Energy fluence (15-150 keV)             : 0 ( 0  0 ) ergs/cm2
Single BB

Spectral model blackbody:
------------------------------------------------------------
Parameters  : value    Lower 90%  Upper 90%
kT [keV]    : 20.4545  (-1.83523  2.08795)
R^2/D10^2   : 0.140052  (-0.0377299   0.0499267)
(R is the radius in km and D10 is the distance to the source in units of 10 kpc)
------------------------------------------------------------
#Fit statistic : Chi-Squared =          68.44 using 59 PHA bins.
# Reduced chi-squared =          1.201 for     57 degrees of freedom
# Null hypothesis probability =   1.426305e-01

Energy  Fluence     90% Error
[keV]   [erg/cm2]   [erg/cm2]
15- 25  1.119e-08   1.653e-09
25- 50  5.658e-08   5.665e-09
50-150  1.760e-07   2.290e-08
15-150  2.438e-07   2.295e-08
Thermal bremsstrahlung (OTTB)

Spectral model: thermal bremsstrahlung
------------------------------------------------------------
Parameters  : value         Lower 90%    Upper 90%
kT [keV]    : 200.000       (      )
Norm        : 12.4743       (-0.979374     0.979316)
------------------------------------------------------------
#Fit statistic : Chi-Squared =          96.49 using 59 PHA bins.
# Reduced chi-squared =          1.693 for     57 degrees of freedom
# Null hypothesis probability =   8.457291e-04

Energy  Fluence     90% Error
[keV]   [erg/cm2]   [erg/cm2]
15- 25  3.107e-08   2.935e-09
25- 50  5.976e-08   1.085e-08
50-150  1.311e-07   4.953e-08
15-150  2.219e-07   5.440e-08
Double BB

------------------------------------------------------------
Parameters  : value         Lower 90%    Upper 90%
kT1 [keV]   : 10.1022        (      )
R1^2/D10^2  : 0.601043        (-0.366527      2410.02)
kT2 [keV]   : 30.2289        (-9.72778      166.287)
R2^2/D10^2  : 3.12566E-02    (-0.0293094   0.103454)
------------------------------------------------------------
#Fit statistic : Chi-Squared =          56.55 using 59 PHA bins.
#Fit statistic : Chi-Squared =          55.11 using 59 PHA bins.
# Reduced chi-squared =          1.028 for     55 degrees of freedom
# Reduced chi-squared =          1.002 for     55 degrees of freedom
# Null hypothesis probability =   4.167423e-01
# Null hypothesis probability =   4.703407e-01

Energy  Fluence     90% Error
[keV]   [erg/cm2]   [erg/cm2]
15- 25  1.976e-08   6.816e-09
25- 50  5.178e-08   7.580e-09
50-150  1.854e-07   2.450e-08
15-150  2.569e-07   2.845e-08
Pre-slew spectrum (Pre-slew PHA with pre-slew DRM)
Power-law model

Spectral model in power-law:
------------------------------------------------------------
Parameters  : value       lower 90%   higher 90%
Photon index: 1.28163     ( -0.0576629   0.0574825 )
Norm@50keV  : 1.16396E-02    ( -0.000375298   0.000375282 )
------------------------------------------------------------
#Fit statistic : Chi-Squared =          57.82 using 59 PHA bins.
# Reduced chi-squared =          1.014 for     57 degrees of freedom
# Null hypothesis probability =   4.449414e-01

Photon flux (15-150 keV)    in 24.1 sec: 1.38404 ( -0.0471958  0.047274 ) ph/cm2/s
Energy fluence (15-150 keV)             : 2.78461e-06 ( -9.70203e-08  9.72076e-08 ) ergs/cm2
Cutoff power-law model

Spectral model in the cutoff power-law:
------------------------------------------------------------
Parameters  : value       lower 90%   higher 90%
Photon index: 0.855765     ( -0.251022   0.237258 )
Epeak [keV] : 147.924      ( -35.215 110.914 )
Norm@50keV  : 1.82878E-02    ( -0.00397438   0.0054043 )
------------------------------------------------------------
#Fit statistic : Chi-Squared =          48.04 using 59 PHA bins.
# Reduced chi-squared =         0.8579 for     56 degrees of freedom
# Null hypothesis probability =   7.663604e-01

Photon flux (15-150 keV)    in 24.1 sec: 1.35216 ( -0.05011  0.05017 ) ph/cm2/s
Energy fluence (15-150 keV)             : 2.71503e-06 ( -1.0604e-07  1.05582e-07 ) ergs/cm2
Band function

Spectral model in the Band function:
------------------------------------------------------------
Parameters  : value       lower 90%   higher 90%
alpha       : -0.635566   ( -0.392046   4.02633 )
beta        : -1.53067    ( 1.53066   0.174474 )
Epeak [keV] : 103.572      ( -68.6146 104.291 )
Norm@50keV   : 2.43531E-02    ( -0.00901256   0.207798 )
------------------------------------------------------------
#Fit statistic : Chi-Squared =          46.71 using 59 PHA bins.
# Reduced chi-squared =         0.8492 for     55 degrees of freedom
# Null hypothesis probability =   7.792979e-01

Photon flux (15-150 keV)    in 24.1 sec:  (    ) ph/cm2/s
Energy fluence (15-150 keV)             : 0 ( 0  0 ) ergs/cm2
S(25-50 keV) vs. S(50-100 keV) plot
S(25-50 keV)  = 6.49e-07
S(50-100 keV) = 1.04e-06
T90 vs. Hardness ratio plot

T90                                   = 19.2960000038147 sec.
Hardness ratio (energy fluence ratio) = 1.60247
Color vs. Color plot
Count Ratio  (25-50 keV) / (15-25 keV) = 1.69077
Count Ratio (50-100 keV) / (15-25 keV) = 1.52217
Mask shadow pattern
IMX = 6.873748454635550E-03, IMY = -4.964660977543811E-01
TIME vs. PHA plot around the trigger time
Blue+Cyan dotted lines: Time interval of the scaled map
From 0.000000 to 1.024000
TIME vs. DetID plot around the trigger time

Blue+Cyan dotted lines: Time interval of the scaled map
From 0.000000 to 1.024000
100 us light curve (15-350 keV)

Blue+Cyan dotted lines: Time interval of the scaled map
From 0.000000 to 1.024000
Spacecraft aspect plot

Bright source in the pre-burst/pre-slew/post-slew images
Pre-burst image of 15-350 keV band
Time interval of the image:
-19.475410 -12.980000

# RAcent  DECcent POSerr Theta    Phi  PeakCts   SNR AngSep     Name
#  [deg]    [deg]    ['] [deg]  [deg]                   [']
 83.6714  21.9983    1.5  33.6 -137.1   0.2521   7.9    2.3	Crab
 23.2029 -37.7097    2.5  49.0   33.9   0.4589   4.5 ------	UNKNOWN
 82.8716 -16.6496    2.3  29.0  -58.4   0.1514   4.9 ------	UNKNOWN
Pre-slew background subtracted image of 15-350 keV band
Time interval of the image:
-12.980000 11.124560

# RAcent  DECcent POSerr Theta    Phi  PeakCts   SNR AngSep     Name
#  [deg]    [deg]    ['] [deg]  [deg]                   [']
 83.7769  21.9267    7.6  33.7 -136.9  -0.2157  -1.5    9.6	Crab
 31.8254   0.3321    0.4  26.4   89.2   4.1099  25.8 ------	UNKNOWN
 78.6572  -5.8143    2.0  21.0  -78.6   0.6698   5.7 ------	UNKNOWN
 78.6779 -57.5572    2.4  59.1  -15.7   3.0158   4.9 ------	UNKNOWN
Post-slew image of 15-350 keV band
Time interval of the image:
60.724590 962.244000

# RAcent  DECcent POSerr Theta    Phi  PeakCts   SNR AngSep     Name
#  [deg]    [deg]    ['] [deg]  [deg]                   [']
 63.1816 -27.4164    3.8  40.9  -36.4   2.0217   3.0 ------	UNKNOWN
 69.6160  -2.9302    4.2  37.9  -76.4   3.2684   2.7 ------	UNKNOWN
 76.3790 -29.6774    4.1  52.0  -42.3   7.0313   2.9 ------	UNKNOWN
 72.8538   1.4095    3.5  41.0  -83.3   6.8253   3.3 ------	UNKNOWN
Plot creation:
Sun May 31 12:07:15 EDT 2015