Special notes of this burst
Image
Pre-slew 15.0-350.0 keV image (Event data)

#   RAcent    DECcent   POSerr    Theta     Phi              Peak Cts       SNR   Name
    5.2808    20.9684   0.0054    33.1688   125.7329         2.2791541     35.438 TRIG_00229185

Foreground time interval of the image:
 -0.560   6.116 (delta_t =   6.676 [sec])
Background time interval of the image:
-239.584  -0.560 (delta_t = 239.024 [sec])
Lightcurves
Notes:
- 1) The mask-weighted light curves are using the flight position.
- 2) Multiple plots of different time binning/intervals are shown to cover all scenarios of short/long GRBs, rate/image triggers, and real/false positives.
- 3) For all the mask-weighted lightcurves, the y-axis units are counts/sec/det where a det is 0.4 x 0.4 = 0.16 sq cm.
- 4) The verticle lines correspond to following: green dotted lines are T50 interval, black dotted lines are T90 interval, blue solid line(s) is a spacecraft slew start time, and orange solid line(s) is a spacecraft slew end time.
- 5) Time of each bin is in the middle of the bin.
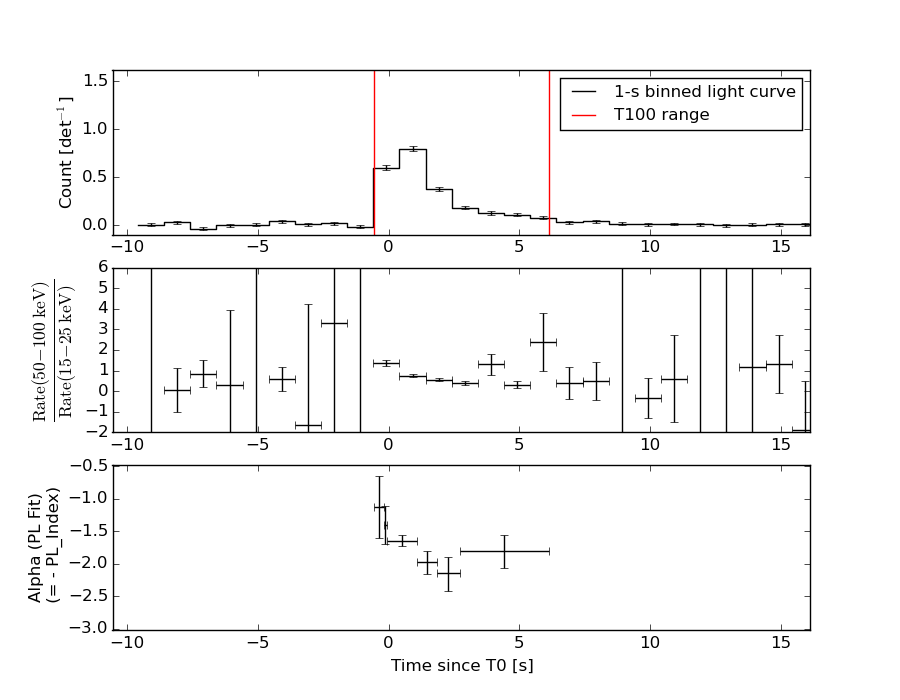
1 s binning
From T0-310 s to T0+310 s

From T100_start - 20 s to T100_end + 30 s

Full time interval

64 ms binning
Full time interval

From T100_start to T100_end

From T0-5 sec to T0+5 sec

16 ms binning
From T100_start-5 s to T100_start+5 s

Blue+Cyan dotted lines: Time interval of the scaled map
From 0.000000 to 1.024000
8 ms binning
From T100_start-3 s to T100_start+3 s

Blue+Cyan dotted lines: Time interval of the scaled map
From 0.000000 to 1.024000
2 ms binning
From T100_start-1 s to T100_start+1 s

Blue+Cyan dotted lines: Time interval of the scaled map
From 0.000000 to 1.024000
SN=5 or 10 sec. binning (whichever binning is satisfied first)

SN=5 or 10 sec. binning (T < 200 sec)

Quad-rate summed light curves (from T0-300s to T0+1000s)

Spectral Evolution
Spectra
Notes:
- 1) The fitting includes the systematic errors.
- 2) When the burst includes telescope slew time periods, the fitting uses an average response file made from multiple 5-s response files through out the slew time plus single time preiod for the non-slew times, and weighted by the total counts in the corresponding time period using addrmf. An average response file is needed becuase a spectral fit using the pre-slew DRM will introduce some errors in both a spectral shape and a normalization if the PHA file contains a lot of the slew/post-slew time interval.
- 3) For fits to more complicated models (e.g. a power-law over a cutoff power-law), the BAT team has decided to require a chi-square improvement of more than 6 for each extra dof.
Time averaged spectrum fit using the average DRM
Power-law model

Time interval is from   -0.560 sec. to    6.116 sec.

Spectral model in power-law:
------------------------------------------------------------
Parameters  : value       lower 90%   higher 90%
Photon index: 1.72868     ( -0.0796071   0.0803243 )
Norm@50keV  : 2.21167E-02    ( -0.000960723   0.000956696 )
------------------------------------------------------------
#Fit statistic : Chi-Squared =          67.60 using 59 PHA bins.
# Reduced chi-squared =          1.186 for     57 degrees of freedom
# Null hypothesis probability =   1.589957e-01

Photon flux (15-150 keV)    in 6.676 sec: 2.96740 ( -0.130408  0.130887 ) ph/cm2/s
Energy fluence (15-150 keV)             : 1.36423e-06 ( -6.16312e-08  6.19703e-08 ) ergs/cm2
Cutoff power-law model

Time interval is from   -0.560 sec. to    6.116 sec.
Spectral model in the cutoff power-law:
------------------------------------------------------------
Parameters  : value       lower 90%   higher 90%
Photon index: 1.73192     ( -0.118297   0.0780582 )
Epeak [keV] : 9999.36      ( -9999.35 -9999.36 )
Norm@50keV  : 2.20787E-02    ( -0.00712308   0.00554867 )
------------------------------------------------------------
#Fit statistic : Chi-Squared =          67.63 using 59 PHA bins.
# Reduced chi-squared =          1.208 for     56 degrees of freedom
# Null hypothesis probability =   1.372542e-01

Photon flux (15-150 keV)    in 6.676 sec: 2.96600 ( -0.13035  0.13063 ) ph/cm2/s
Energy fluence (15-150 keV)             : 1.36372e-06 ( -5.84684e-08  6.09853e-08 ) ergs/cm2
Band function

Time interval is from   -0.560 sec. to    6.116 sec.

Spectral model in the Band function:
------------------------------------------------------------
Parameters  : value       lower 90%   higher 90%
alpha       : 4.97363   ( -4.97363   -4.97363 )
beta        : -1.74917    ( -0.0849525   0.0831784 )
Epeak [keV] : 20.5665      ( -20.5665 3.42404 )
Norm@50keV   : 9252.49    ( -381.298   1.71365e+07 )
------------------------------------------------------------
#Fit statistic : Chi-Squared =          66.94 using 59 PHA bins.
# Reduced chi-squared =          1.217 for     55 degrees of freedom
# Null hypothesis probability =   1.297056e-01

Photon flux (15-150 keV)    in 6.676 sec: 2.94384 (    ) ph/cm2/s
Energy fluence (15-150 keV)             : 0 ( 0  0 ) ergs/cm2
Single BB

Spectral model blackbody:
------------------------------------------------------------
Parameters  : value    Lower 90%  Upper 90%
kT [keV]    : 13.6675  (  )
R^2/D10^2   : 0.421242  (   )
(R is the radius in km and D10 is the distance to the source in units of 10 kpc)
------------------------------------------------------------
#Fit statistic : Chi-Squared =         262.00 using 59 PHA bins.
# Reduced chi-squared =         4.5965 for     57 degrees of freedom
# Null hypothesis probability =   4.727930e-28

Energy  Fluence     90% Error
[keV]   [erg/cm2]   [erg/cm2]
15- 25  1.112e-07   9.180e-09
25- 50  4.036e-07   2.126e-08
50-150  4.902e-07   4.680e-08
15-150  1.005e-06   5.307e-08
Thermal bremsstrahlung (OTTB)

Spectral model: thermal bremsstrahlung
------------------------------------------------------------
Parameters  : value         Lower 90%    Upper 90%
kT [keV]    : 140.908       (-27.1819      33.1539)
Norm        : 12.0732       (-0.626349     0.768707)
------------------------------------------------------------
#Fit statistic : Chi-Squared =          76.89 using 59 PHA bins.
# Reduced chi-squared =          1.349 for     57 degrees of freedom
# Null hypothesis probability =   4.072803e-02

Energy  Fluence     90% Error
[keV]   [erg/cm2]   [erg/cm2]
15- 25  2.080e-07   1.489e-08
25- 50  3.820e-07   2.480e-08
50-150  7.344e-07   1.996e-07
15-150  1.324e-06   2.260e-07
Double BB

Spectral model: bbodyrad<1> + bbodyrad<2>
------------------------------------------------------------
Parameters  : value         Lower 90%    Upper 90%
kT1 [keV]   : 6.19723        (-0.599938      0.651837)
R1^2/D10^2  : 5.80559        (-1.86508      2.91894)
kT2 [keV]   : 26.5324        (-2.9321      3.78658)
R2^2/D10^2  : 3.16313E-02    (-0.0116383   0.0163856)
------------------------------------------------------------
#Fit statistic : Chi-Squared =          57.93 using 59 PHA bins.
# Reduced chi-squared =          1.053 for     55 degrees of freedom
# Null hypothesis probability =   3.676350e-01

Energy  Fluence     90% Error
[keV]   [erg/cm2]   [erg/cm2]
15- 25  2.319e-07   2.677e-08
25- 50  3.672e-07   3.602e-08
50-150  7.772e-07   1.028e-07
15-150  1.376e-06   1.232e-07
Peak spectrum fit
Power-law model

Time interval is from    0.000 sec. to    1.000 sec.

Spectral model in power-law:
------------------------------------------------------------
Parameters  : value       lower 90%   higher 90%
Photon index: 1.65449     ( -0.0821027   0.0828892 )
Norm@50keV  : 6.53178E-02    ( -0.00323374   0.00322237 )
------------------------------------------------------------
#Fit statistic : Chi-Squared =          54.50 using 59 PHA bins.
# Reduced chi-squared =         0.9562 for     57 degrees of freedom
# Null hypothesis probability =   5.692894e-01

Photon flux (15-150 keV)    in 1 sec: 8.54156 ( -0.418844  0.419357 ) ph/cm2/s
Energy fluence (15-150 keV)             : 6.0721e-07 ( -3.17172e-08  3.18358e-08 ) ergs/cm2
Cutoff power-law model

Time interval is from    0.000 sec. to    1.000 sec.
Spectral model in the cutoff power-law:
------------------------------------------------------------
Parameters  : value       lower 90%   higher 90%
Photon index: 1.19628     ( -0.348537   0.322237 )
Epeak [keV] : 86.3862      ( -18.8342 82.7 )
Norm@50keV  : 0.112149    ( -0.034697   0.0557272 )
------------------------------------------------------------
#Fit statistic : Chi-Squared =          48.40 using 59 PHA bins.
# Reduced chi-squared =         0.8643 for     56 degrees of freedom
# Null hypothesis probability =   7.548065e-01

Photon flux (15-150 keV)    in 1 sec: 8.36652 ( -0.43536  0.43563 ) ph/cm2/s
Energy fluence (15-150 keV)             : 5.88282e-07 ( -3.4854e-08  3.4725e-08 ) ergs/cm2
Band function

Time interval is from    0.000 sec. to    1.000 sec.

Spectral model in the Band function:
------------------------------------------------------------
Parameters  : value       lower 90%   higher 90%
alpha       : 0.790763   ( -2.55434   -1.37144 )
beta        : -1.81133    ( -0.250092   0.127814 )
Epeak [keV] : 34.9544      ( -6.60481 47.4224 )
Norm@50keV   : 2.78316    ( -2.77906   1978.47 )
------------------------------------------------------------
#Fit statistic : Chi-Squared =          45.43 using 59 PHA bins.
# Reduced chi-squared =         0.8259 for     55 degrees of freedom
# Null hypothesis probability =   8.178816e-01

Photon flux (15-150 keV)    in 1 sec:  (    ) ph/cm2/s
Energy fluence (15-150 keV)             : 5.91456e-07 ( -5.91449e-07  -3.3304e-08 ) ergs/cm2
Single BB

Spectral model blackbody:
------------------------------------------------------------
Parameters  : value    Lower 90%  Upper 90%
kT [keV]    : 13.4710  (  )
R^2/D10^2   : 1.37009  (   )
(R is the radius in km and D10 is the distance to the source in units of 10 kpc)
------------------------------------------------------------
#Fit statistic : Chi-Squared =         142.43 using 59 PHA bins.
# Reduced chi-squared =         2.4988 for     57 degrees of freedom
# Null hypothesis probability =   2.917873e-09

Energy  Fluence     90% Error
[keV]   [erg/cm2]   [erg/cm2]
15- 25  5.267e-08   4.850e-09
25- 50  1.884e-07   1.155e-08
50-150  2.205e-07   2.300e-08
15-150  4.616e-07   2.530e-08
Thermal bremsstrahlung (OTTB)

Spectral model: thermal bremsstrahlung
------------------------------------------------------------
Parameters  : value         Lower 90%    Upper 90%
kT [keV]    : 153.278       (-32.1788      40.7035)
Norm        : 35.1465       (-1.91108     2.28672)
------------------------------------------------------------
#Fit statistic : Chi-Squared =          48.45 using 59 PHA bins.
# Reduced chi-squared =         0.8499 for     57 degrees of freedom
# Null hypothesis probability =   7.828260e-01

Energy  Fluence     90% Error
[keV]   [erg/cm2]   [erg/cm2]
15- 25  9.010e-08   6.285e-09
25- 50  1.675e-07   1.480e-08
50-150  3.336e-07   1.013e-07
15-150  5.912e-07   1.088e-07
Double BB

Spectral model: bbodyrad<1> + bbodyrad<2>
------------------------------------------------------------
Parameters  : value         Lower 90%    Upper 90%
kT1 [keV]   : 7.43479        (-1.00419      1.07205)
R1^2/D10^2  : 7.89398        (-2.77483      4.88976)
kT2 [keV]   : 26.2181        (-4.04876      6.19923)
R2^2/D10^2  : 9.02840E-02    (-0.0486652   0.0821714)
------------------------------------------------------------
#Fit statistic : Chi-Squared =          44.64 using 59 PHA bins.
# Reduced chi-squared =         0.8116 for     55 degrees of freedom
# Null hypothesis probability =   8.397386e-01

Energy  Fluence     90% Error
[keV]   [erg/cm2]   [erg/cm2]
15- 25  8.481e-08   1.265e-08
25- 50  1.751e-07   2.345e-08
50-150  3.319e-07   7.590e-08
15-150  5.918e-07   9.745e-08
Pre-slew spectrum (Pre-slew PHA with pre-slew DRM)
Power-law model
Spectral model in power-law:
------------------------------------------------------------
Parameters  : value       lower 90%   higher 90%
Photon index: 1.72868     ( -0.0796071   0.0803243 )
Norm@50keV  : 2.21167E-02    ( -0.000960723   0.000956696 )
------------------------------------------------------------
#Fit statistic : Chi-Squared =          67.60 using 59 PHA bins.
# Reduced chi-squared =          1.186 for     57 degrees of freedom
# Null hypothesis probability =   1.589957e-01

Photon flux (15-150 keV)    in 6.676 sec: 2.96740 ( -0.130408  0.130887 ) ph/cm2/s
Energy fluence (15-150 keV)             : 1.36423e-06 ( -6.16312e-08  6.19703e-08 ) ergs/cm2
Cutoff power-law model

Spectral model in the cutoff power-law:
------------------------------------------------------------
Parameters  : value       lower 90%   higher 90%
Photon index: 1.73192     ( -0.118297   0.0780582 )
Epeak [keV] : 9999.36      ( -9999.35 -9999.36 )
Norm@50keV  : 2.20787E-02    ( -0.00712308   0.00554867 )
------------------------------------------------------------
#Fit statistic : Chi-Squared =          67.63 using 59 PHA bins.
# Reduced chi-squared =          1.208 for     56 degrees of freedom
# Null hypothesis probability =   1.372542e-01

Photon flux (15-150 keV)    in 6.676 sec: 2.96600 ( -0.13035  0.13063 ) ph/cm2/s
Energy fluence (15-150 keV)             : 1.36372e-06 ( -5.84684e-08  6.09853e-08 ) ergs/cm2
Band function
Spectral model in the Band function:
------------------------------------------------------------
Parameters  : value       lower 90%   higher 90%
alpha       : 4.97363   ( -4.97363   -4.97363 )
beta        : -1.74917    ( -0.0849525   0.0831784 )
Epeak [keV] : 20.5665      ( -20.5665 3.42404 )
Norm@50keV   : 9252.49    ( -381.298   1.52952e+07 )
------------------------------------------------------------
#Fit statistic : Chi-Squared =          66.94 using 59 PHA bins.
# Reduced chi-squared =          1.217 for     55 degrees of freedom
# Null hypothesis probability =   1.297056e-01

Photon flux (15-150 keV)    in 6.676 sec: 2.94384 (    ) ph/cm2/s
Energy fluence (15-150 keV)             : 0 ( 0  0 ) ergs/cm2
S(25-50 keV) vs. S(50-100 keV) plot

S(25-50 keV)  = 3.74e-07
S(50-100 keV) = 4.51e-07
T90 vs. Hardness ratio plot

T90                                   = 5.0280000269413 sec.
Hardness ratio (energy fluence ratio) = 1.20588
Color vs. Color plot

Count Ratio  (25-50 keV) / (15-25 keV) = 1.20394
Count Ratio (50-100 keV) / (15-25 keV) = 0.818242
Mask shadow pattern

IMX = -3.817101656232284E-01, IMY = -5.305631240612986E-01
TIME vs. PHA plot around the trigger time
Blue+Cyan dotted lines: Time interval of the scaled map
From 0.000000 to 1.024000
TIME vs. DetID plot around the trigger time

Blue+Cyan dotted lines: Time interval of the scaled map
From 0.000000 to 1.024000
100 us light curve (15-350 keV)

Blue+Cyan dotted lines: Time interval of the scaled map
From 0.000000 to 1.024000
Spacecraft aspect plot

Bright source in the pre-burst/pre-slew/post-slew images
Pre-burst image of 15-350 keV band
Time interval of the image:
-239.584000 -0.560000

# RAcent  DECcent POSerr Theta    Phi  PeakCts   SNR AngSep     Name
#  [deg]    [deg]    ['] [deg]  [deg]                   [']
355.5141  12.7222    2.5  38.1  106.0   2.2338   4.6 ------	UNKNOWN
 17.2591  50.9122    2.7  52.1  163.9   2.5176   4.3 ------	UNKNOWN
 49.5971 -54.1787    2.5  56.4  -16.8   2.9734   4.5 ------	UNKNOWN
Pre-slew background subtracted image of 15-350 keV band
Time interval of the image:
-0.560000 6.116000

# RAcent  DECcent POSerr Theta    Phi  PeakCts   SNR AngSep     Name
#  [deg]    [deg]    ['] [deg]  [deg]                   [']
  5.2808  20.9683    0.3  33.2  125.7   2.2789  35.4 ------	UNKNOWN
 74.5641  27.5171    2.2  49.1 -131.8   0.6132   5.2 ------	UNKNOWN
Post-slew image of 15-350 keV band
Time interval of the image:
91.716580 962.515600

# RAcent  DECcent POSerr Theta    Phi  PeakCts   SNR AngSep     Name
#  [deg]    [deg]    ['] [deg]  [deg]                   [']
308.0521  41.0329   12.2  52.0 -175.4   1.1367   1.0    5.5	Cyg X-3
326.1878  38.3360   16.9  37.8 -175.6   0.3855   0.7    1.1	Cyg X-2
319.3383   8.1370    2.5  46.1  139.2   6.9075   4.7 ------	UNKNOWN
 28.5626 -13.0927    3.5  41.0   22.5   2.2205   3.3 ------	UNKNOWN
308.0680  37.6694    0.9  51.8 -179.6  13.9344  12.8 ------	UNKNOWN
 26.6976  29.1347    3.0  21.0  -58.8   1.4936   3.8 ------	UNKNOWN
309.7392  53.9174    2.9  53.1 -159.1   4.9707   4.0 ------	UNKNOWN
 62.4919   8.8548    4.1  56.3  -28.4   6.8111   2.8 ------	UNKNOWN
 61.3116  20.7112    3.2  52.0  -42.1   9.4240   3.6 ------	UNKNOWN
Plot creation:
Sun May 31 12:05:26 EDT 2015