Special notes of this burst
Image
Pre-slew 15.0-350.0 keV image (Event data)
#   RAcent    DECcent   POSerr    Theta     Phi              Peak Cts       SNR   Name
  276.9026   -50.9951   0.0139    32.8743   112.5663         0.9236257     13.862 TRIG_00230115

Foreground time interval of the image:
 -0.920   9.028 (delta_t =   9.948 [sec])
Background time interval of the image:
-239.128  -0.920 (delta_t = 238.208 [sec])
Lightcurves
Notes:
- 1) The mask-weighted light curves are using the flight position.
- 2) Multiple plots of different time binning/intervals are shown to cover all scenarios of short/long GRBs, rate/image triggers, and real/false positives.
- 3) For all the mask-weighted lightcurves, the y-axis units are counts/sec/det where a det is 0.4 x 0.4 = 0.16 sq cm.
- 4) The verticle lines correspond to following: green dotted lines are T50 interval, black dotted lines are T90 interval, blue solid line(s) is a spacecraft slew start time, and orange solid line(s) is a spacecraft slew end time.
- 5) Time of each bin is in the middle of the bin.
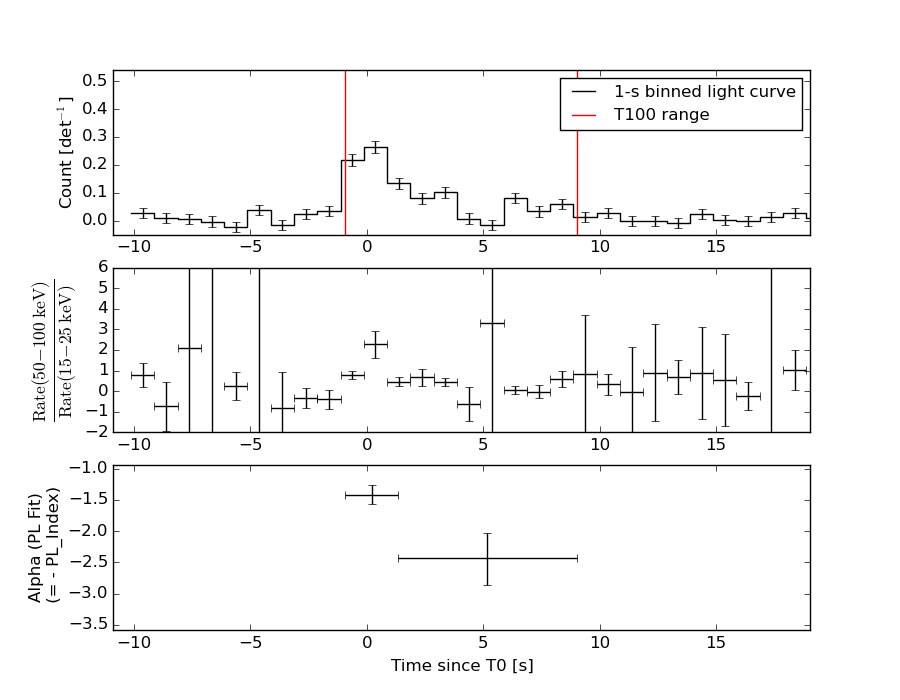
1 s binning
From T0-310 s to T0+310 s
From T100_start - 20 s to T100_end + 30 s
Full time interval
64 ms binning
Full time interval
From T100_start to T100_end
From T0-5 sec to T0+5 sec
16 ms binning
From T100_start-5 s to T100_start+5 s
Blue+Cyan dotted lines: Time interval of the scaled map
From 0.000000 to 1.024000
8 ms binning
From T100_start-3 s to T100_start+3 s
Blue+Cyan dotted lines: Time interval of the scaled map
From 0.000000 to 1.024000
2 ms binning
From T100_start-1 s to T100_start+1 s
Blue+Cyan dotted lines: Time interval of the scaled map
From 0.000000 to 1.024000
SN=5 or 10 sec. binning (whichever binning is satisfied first)
SN=5 or 10 sec. binning (T < 200 sec)
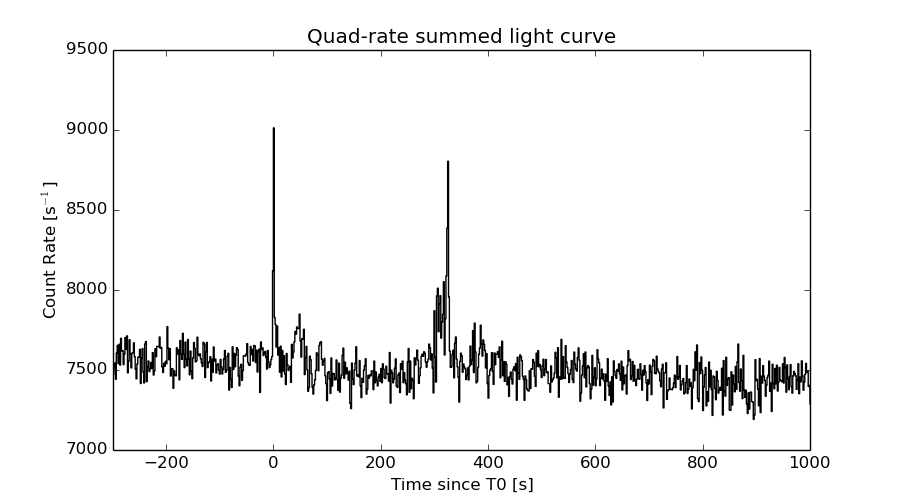
Quad-rate summed light curves (from T0-300s to T0+1000s)
Spectral Evolution
Spectra
Notes:
- 1) The fitting includes the systematic errors.
- 2) When the burst includes telescope slew time periods, the fitting uses an average response file made from multiple 5-s response files through out the slew time plus single time preiod for the non-slew times, and weighted by the total counts in the corresponding time period using addrmf. An average response file is needed becuase a spectral fit using the pre-slew DRM will introduce some errors in both a spectral shape and a normalization if the PHA file contains a lot of the slew/post-slew time interval.
- 3) For fits to more complicated models (e.g. a power-law over a cutoff power-law), the BAT team has decided to require a chi-square improvement of more than 6 for each extra dof.
Time averaged spectrum fit using the average DRM
Power-law model

Time interval is from   -0.920 sec. to    9.028 sec.

Spectral model in power-law:
------------------------------------------------------------
Parameters  : value       lower 90%   higher 90%
Photon index: 1.82596     ( -0.182925   0.187965 )
Norm@50keV  : 5.90904E-03    ( -0.000687527   0.000678858 )
------------------------------------------------------------
#Fit statistic : Chi-Squared =          79.10 using 59 PHA bins.
# Reduced chi-squared =          1.388 for     57 degrees of freedom
# Null hypothesis probability =   2.802135e-02

Photon flux (15-150 keV)    in 9.948 sec: 0.822592 ( -0.0891609  0.0893734 ) ph/cm2/s
Energy fluence (15-150 keV)             : 5.40745e-07 ( -6.31054e-08  6.38197e-08 ) ergs/cm2
Cutoff power-law model
Time interval is from   -0.920 sec. to    9.028 sec.
Spectral model in the cutoff power-law:
------------------------------------------------------------
Parameters  : value       lower 90%   higher 90%
Photon index: 0.841135     ( -1.04808   0.84124 )
Epeak [keV] : 53.3427      ( -10.8901 48.6925 )
Norm@50keV  : 2.01499E-02    ( -0.0201545   0.0529312 )
------------------------------------------------------------
#Fit statistic : Chi-Squared =          75.00 using 59 PHA bins.
# Reduced chi-squared =          1.339 for     56 degrees of freedom
# Null hypothesis probability =   4.583622e-02

Photon flux (15-150 keV)    in 9.948 sec: 0.787258 ( -0.094568  0.094315 ) ph/cm2/s
Energy fluence (15-150 keV)             : 4.98758e-07 ( -6.92371e-08  7.23508e-08 ) ergs/cm2
Band function

Time interval is from   -0.920 sec. to    9.028 sec.

Spectral model in the Band function:
------------------------------------------------------------
Parameters  : value       lower 90%   higher 90%
alpha       : -0.777332   ( -0.866149   0.740893 )
beta        : -2.63394    ( 2.68202   0.79831 )
Epeak [keV] : 51.5359      ( -26.0905 24.9528 )
Norm@50keV   : 2.21912E-02    ( -0.0120076   302.46 )
------------------------------------------------------------
#Fit statistic : Chi-Squared =          74.67 using 59 PHA bins.
# Reduced chi-squared =          1.358 for     55 degrees of freedom
# Null hypothesis probability =   3.995022e-02

Photon flux (15-150 keV)    in 9.948 sec:  (    ) ph/cm2/s
Energy fluence (15-150 keV)             : 5.02761e-07 ( 0  0 ) ergs/cm2
Single BB
Spectral model blackbody:
------------------------------------------------------------
Parameters  : value    Lower 90%  Upper 90%
kT [keV]    : 12.1404  (-1.34039  1.51645)
R^2/D10^2   : 0.190269  (-0.0685929   0.10602)
(R is the radius in km and D10 is the distance to the source in units of 10 kpc)
------------------------------------------------------------
#Fit statistic : Chi-Squared =          85.61 using 59 PHA bins.
# Reduced chi-squared =          1.502 for     57 degrees of freedom
# Null hypothesis probability =   8.435025e-03

Energy  Fluence     90% Error
[keV]   [erg/cm2]   [erg/cm2]
15- 25  5.906e-08   1.177e-08
25- 50  1.884e-07   2.537e-08
50-150  1.683e-07   3.790e-08
15-150  4.157e-07   5.929e-08
Thermal bremsstrahlung (OTTB)
Spectral model: thermal bremsstrahlung
------------------------------------------------------------
Parameters  : value         Lower 90%    Upper 90%
kT [keV]    : 92.6394       (-27.2132      50.6668)
Norm        : 3.71847       (-0.544969     0.659762)
------------------------------------------------------------
#Fit statistic : Chi-Squared =          75.71 using 59 PHA bins.
# Reduced chi-squared =          1.328 for     57 degrees of freedom
# Null hypothesis probability =   4.929255e-02

Energy  Fluence     90% Error
[keV]   [erg/cm2]   [erg/cm2]
15- 25  9.659e-08   1.525e-08
25- 50  1.644e-07   2.139e-08
50-150  2.548e-07   1.129e-07
15-150  5.158e-07   1.180e-07
Double BB
Spectral model: bbodyrad<1> + bbodyrad<2>
------------------------------------------------------------
Parameters  : value         Lower 90%    Upper 90%
kT1 [keV]   : 4.67217        (-1.7093      3.47888)
R1^2/D10^2  : 3.31056        (-2.76924      12.66)
kT2 [keV]   : 15.3957        (-2.64381      7.51005)
R2^2/D10^2  : 6.62267E-02    (-0.0555327   0.0788927)
------------------------------------------------------------
#Fit statistic : Chi-Squared =          74.81 using 59 PHA bins.
# Reduced chi-squared =          1.360 for     55 degrees of freedom
# Null hypothesis probability =   3.902906e-02

Energy  Fluence     90% Error
[keV]   [erg/cm2]   [erg/cm2]
15- 25  9.312e-08   4.685e-08
25- 50  1.657e-07   6.453e-08
50-150  2.170e-07   1.211e-07
15-150  4.758e-07   1.960e-07
Peak spectrum fit
Power-law model
Time interval is from   -0.504 sec. to    0.496 sec.

Spectral model in power-law:
------------------------------------------------------------
Parameters  : value       lower 90%   higher 90%
Photon index: 1.26196     ( -0.199393   0.196088 )
Norm@50keV  : 1.94446E-02    ( -0.002356   0.00235403 )
------------------------------------------------------------
#Fit statistic : Chi-Squared =          46.62 using 59 PHA bins.
# Reduced chi-squared =         0.8178 for     57 degrees of freedom
# Null hypothesis probability =   8.352867e-01

Photon flux (15-150 keV)    in 1 sec: 2.30433 ( -0.294691  0.296256 ) ph/cm2/s
Energy fluence (15-150 keV)             : 1.93993e-07 ( -2.46101e-08  2.4705e-08 ) ergs/cm2
Cutoff power-law model

Time interval is from   -0.504 sec. to    0.496 sec.
Spectral model in the cutoff power-law:
------------------------------------------------------------
Parameters  : value       lower 90%   higher 90%
Photon index: 0.208305     ( -1.12828   0.891022 )
Epeak [keV] : 95.2380      ( -24.1723 188.448 )
Norm@50keV  : 5.86717E-02    ( -0.0351319   0.121828 )
------------------------------------------------------------
#Fit statistic : Chi-Squared =          42.44 using 59 PHA bins.
# Reduced chi-squared =         0.7579 for     56 degrees of freedom
# Null hypothesis probability =   9.095274e-01

Photon flux (15-150 keV)    in 1 sec: 2.20886 ( -0.30558  0.30734 ) ph/cm2/s
Energy fluence (15-150 keV)             : 1.86177e-07 ( -2.6372e-08  2.6169e-08 ) ergs/cm2
Band function
Time interval is from   -0.504 sec. to    0.496 sec.

Spectral model in the Band function:
------------------------------------------------------------
Parameters  : value       lower 90%   higher 90%
alpha       : -6.08394E-02   ( -1.00486   4.95748 )
beta        : -2.02377    ( 2.05072   0.761161 )
Epeak [keV] : 86.9428      ( -53.9428 156.125 )
Norm@50keV   : 7.05724E-02    ( -0.0723774   145.504 )
------------------------------------------------------------
#Fit statistic : Chi-Squared =          42.19 using 59 PHA bins.
# Reduced chi-squared =         0.7671 for     55 degrees of freedom
# Null hypothesis probability =   8.973689e-01

Photon flux (15-150 keV)    in 1 sec:  (    ) ph/cm2/s
Energy fluence (15-150 keV)             : 1.85699e-07 ( 0  0 ) ergs/cm2
Single BB
Spectral model blackbody:
------------------------------------------------------------
Parameters  : value    Lower 90%  Upper 90%
kT [keV]    : 18.7046  (-2.42888  2.89389)
R^2/D10^2   : 0.135588  (-0.0527   0.0823126)
(R is the radius in km and D10 is the distance to the source in units of 10 kpc)
------------------------------------------------------------
#Fit statistic : Chi-Squared =          47.68 using 59 PHA bins.
# Reduced chi-squared =         0.8364 for     57 degrees of freedom
# Null hypothesis probability =   8.058331e-01

Energy  Fluence     90% Error
[keV]   [erg/cm2]   [erg/cm2]
15- 25  9.376e-09   2.249e-09
25- 50  4.460e-08   9.005e-09
50-150  1.143e-07   2.485e-08
15-150  1.683e-07   2.720e-08
Thermal bremsstrahlung (OTTB)
Spectral model: thermal bremsstrahlung
------------------------------------------------------------
Parameters  : value         Lower 90%    Upper 90%
kT [keV]    : 200.000       (      )
Norm        : 9.78972       (-1.19607     1.19593)
------------------------------------------------------------
#Fit statistic : Chi-Squared =          51.15 using 59 PHA bins.
# Reduced chi-squared =         0.8974 for     57 degrees of freedom
# Null hypothesis probability =   6.931465e-01

Energy  Fluence     90% Error
[keV]   [erg/cm2]   [erg/cm2]
15- 25  2.437e-08   1.384e-08
25- 50  4.689e-08   2.588e-08
50-150  1.028e-07   5.595e-08
15-150  1.741e-07   9.580e-08
Double BB
Spectral model: bbodyrad<1> + bbodyrad<2>
------------------------------------------------------------
Parameters  : value         Lower 90%    Upper 90%
kT1 [keV]   : 9.61039        (-6.52753      -9.63317)
R1^2/D10^2  : 0.576046        (-0.424845      29.9556)
kT2 [keV]   : 26.6846        (-23.6782      -26.7879)
R2^2/D10^2  : 3.09976E-02    (-0.0301646   0.106987)
------------------------------------------------------------
#Fit statistic : Chi-Squared =          42.71 using 59 PHA bins.
# Reduced chi-squared =         0.7766 for     55 degrees of freedom
# Null hypothesis probability =   8.863499e-01

Energy  Fluence     90% Error
[keV]   [erg/cm2]   [erg/cm2]
15- 25  1.438e-08   8.080e-09
25- 50  4.674e-08   2.390e-08
50-150  1.247e-07   6.550e-08
15-150  1.858e-07   9.415e-08
Pre-slew spectrum (Pre-slew PHA with pre-slew DRM)
Power-law model
Spectral model in power-law:
------------------------------------------------------------
Parameters  : value       lower 90%   higher 90%
Photon index: 1.82596     ( -0.182925   0.187965 )
Norm@50keV  : 5.90904E-03    ( -0.000687527   0.000678858 )
------------------------------------------------------------
#Fit statistic : Chi-Squared =          79.10 using 59 PHA bins.
# Reduced chi-squared =          1.388 for     57 degrees of freedom
# Null hypothesis probability =   2.802135e-02

Photon flux (15-150 keV)    in 9.948 sec: 0.822592 ( -0.0891609  0.0893734 ) ph/cm2/s
Energy fluence (15-150 keV)             : 5.40745e-07 ( -6.31054e-08  6.38197e-08 ) ergs/cm2
Cutoff power-law model

Spectral model in the cutoff power-law:
------------------------------------------------------------
Parameters  : value       lower 90%   higher 90%
Photon index: 0.841135     ( -1.04808   0.84124 )
Epeak [keV] : 53.3427      ( -10.8901 48.6925 )
Norm@50keV  : 2.01499E-02    ( -0.0201545   0.0529312 )
------------------------------------------------------------
#Fit statistic : Chi-Squared =          75.00 using 59 PHA bins.
# Reduced chi-squared =          1.339 for     56 degrees of freedom
# Null hypothesis probability =   4.583622e-02

Photon flux (15-150 keV)    in 9.948 sec: 0.787258 ( -0.094568  0.094315 ) ph/cm2/s
Energy fluence (15-150 keV)             : 4.98758e-07 ( -6.92371e-08  7.23508e-08 ) ergs/cm2
Band function
Spectral model in the Band function:
------------------------------------------------------------
Parameters  : value       lower 90%   higher 90%
alpha       : -0.777332   ( -0.866149   0.740893 )
beta        : -2.63394    ( 2.68202   0.79831 )
Epeak [keV] : 51.5359      ( -26.0852 25.4823 )
Norm@50keV   : 2.21912E-02    ( -0.0120076   302.46 )
------------------------------------------------------------
#Fit statistic : Chi-Squared =          74.67 using 59 PHA bins.
# Reduced chi-squared =          1.358 for     55 degrees of freedom
# Null hypothesis probability =   3.995022e-02

Photon flux (15-150 keV)    in 9.948 sec:  (    ) ph/cm2/s
Energy fluence (15-150 keV)             : 5.02761e-07 ( 0  0 ) ergs/cm2
S(25-50 keV) vs. S(50-100 keV) plot
S(25-50 keV)  = 1.54e-07
S(50-100 keV) = 1.73e-07
T90 vs. Hardness ratio plot
T90                                   = 9.00000002980232 sec.
Hardness ratio (energy fluence ratio) = 1.12338
Color vs. Color plot
Count Ratio  (25-50 keV) / (15-25 keV) = 1.05231
Count Ratio (50-100 keV) / (15-25 keV) = 0.660307
Mask shadow pattern
IMX = -2.480164407110524E-01, IMY = -5.968109589008466E-01
TIME vs. PHA plot around the trigger time
Blue+Cyan dotted lines: Time interval of the scaled map
From 0.000000 to 1.024000
TIME vs. DetID plot around the trigger time
Blue+Cyan dotted lines: Time interval of the scaled map
From 0.000000 to 1.024000
100 us light curve (15-350 keV)
Blue+Cyan dotted lines: Time interval of the scaled map
From 0.000000 to 1.024000
Spacecraft aspect plot

Bright source in the pre-burst/pre-slew/post-slew images
Pre-burst image of 15-350 keV band
Time interval of the image:
-239.128000 -0.920000

# RAcent  DECcent POSerr Theta    Phi  PeakCts   SNR AngSep     Name
#  [deg]    [deg]    ['] [deg]  [deg]                   [']
170.3099 -60.6192   36.4  44.0 -155.2   0.1203   0.3    0.3	Cen X-3
187.0259 -62.7554   14.1  36.6 -160.5   0.2512   0.8   10.2	GX 301-2
244.9854 -15.6448    0.2  25.2   13.6  12.3633  58.4    0.4	Sco X-1
256.0048 -37.9199    3.9  17.9   81.0   0.6613   3.0    4.6	4U 1700-377
256.3832 -36.4666    5.3  18.5   76.6   0.4875   2.2    3.6	GX 349+2
263.0364 -24.8037    2.1  28.8   56.1   1.6586   5.4    3.8	GX 1+4
264.7820 -44.5496    3.9  24.3  100.4   0.8501   3.0    6.2	4U 1735-44
270.2896 -25.0748    7.2  34.1   63.7   0.6919   1.6    0.4	GX 5-1
270.4398 -25.6089    0.0  33.9   64.6   0.0871   0.2   10.9	GRS 1758-258
274.0979 -13.9172   25.8  43.7   53.0   0.3639   0.4    8.9	GX 17+2
275.7247 -30.2706   12.4  35.8   75.7   0.5144   0.9   11.9	H1820-303
263.0788 -33.7997    1.7  24.5   74.0   1.8723   6.7    4.9	GX 354-0
255.2433 -41.6467    1.7  17.1   93.2   1.4171   6.6 ------	UNKNOWN
217.8669 -27.5919    3.9  16.8  -67.8   0.6329   3.0 ------	UNKNOWN
230.7861  17.7967    2.6  56.4  -16.7   3.9752   4.5 ------	UNKNOWN
Pre-slew background subtracted image of 15-350 keV band
Time interval of the image:
-0.920000 9.028000

# RAcent  DECcent POSerr Theta    Phi  PeakCts   SNR AngSep     Name
#  [deg]    [deg]    ['] [deg]  [deg]                   [']
170.4283 -60.4473   11.8  44.0 -155.0  -0.0508  -1.0   11.1	Cen X-3
186.5852 -62.6318    6.7  36.8 -160.2   0.0703   1.7    8.5	GX 301-2
245.1204 -15.6547    7.6  25.2   13.9  -0.0530  -1.5    8.2	Sco X-1
255.9375 -37.9868    8.1  17.9   81.1  -0.0551  -1.4    8.9	4U 1700-377
256.2470 -36.2790    0.0  18.5   75.9  -0.0293  -0.8   12.6	GX 349+2
263.1044 -24.7149    6.0  28.9   56.1  -0.0982  -1.9    5.5	GX 1+4
264.9299 -44.2996    6.9  24.4   99.7   0.0847   1.7   12.1	4U 1735-44
270.1121 -25.0327    4.2  33.9   63.4   0.2017   2.7    9.8	GX 5-1
270.1647 -25.8774    0.0  33.5   64.8   0.1075   1.5   11.0	GRS 1758-258
273.9946 -13.9101    3.7  43.6   52.9  -0.4567  -3.1    7.6	GX 17+2
275.9292 -30.2802    8.6  35.9   75.8  -0.1262  -1.3    5.2	H1820-303
262.8054 -33.7030    8.8  24.4   73.5   0.0602   1.3   12.1	GX 354-0
276.9027 -50.9952    0.8  32.9  112.6   0.9238  13.9 ------	UNKNOWN
Post-slew image of 15-350 keV band
Time interval of the image:
71.172600 962.940000

# RAcent  DECcent POSerr Theta    Phi  PeakCts   SNR AngSep     Name
#  [deg]    [deg]    ['] [deg]  [deg]                   [']
186.9003 -62.6219   20.4  46.3 -133.4  -0.9654  -0.6   11.1	GX 301-2
244.9826 -15.6327    0.3  43.6  -40.3  40.2191  38.4    0.5	Sco X-1
256.1417 -38.0025    0.0  19.6  -49.2   0.4808   0.9   12.0	4U 1700-377
256.3927 -36.4136    2.3  20.7  -45.8   2.6399   5.0    2.1	GX 349+2
262.9556 -24.7851    2.0  28.3  -20.2   3.0484   5.9    3.8	GX 1+4
264.8623 -44.5397    3.8  10.3  -48.7   1.5248   3.0    7.4	4U 1735-44
268.3502  -1.5056    6.6  50.0   -4.0   1.9611   1.7    3.4	SW J1753.5-0127
270.2707 -25.1049    1.4  26.4   -6.4   4.4454   8.1    1.7	GX 5-1
270.2702 -25.7155    2.4  25.8   -6.6   2.5492   4.7    2.4	GRS 1758-258
274.0035 -13.9889    4.2  37.1    2.5   1.7436   2.8    2.9	GX 17+2
275.9462 -30.3701    1.8  20.6    4.9   3.2193   6.5    1.1	H1820-303
284.9121 -25.0301    4.7  26.7   23.5   1.2804   2.5    9.4	HT1900.1-2455
263.0033 -33.8527    1.3  19.9  -28.6   4.1285   8.8    1.3	GX 354-0
300.4530 -22.3823    3.1  34.0   48.6   2.9721   3.7 ------	UNKNOWN
286.8895 -10.6780    2.3  41.2   22.2   4.0132   4.9 ------	UNKNOWN
255.1552 -41.6185    1.0  17.6  -59.1   5.9830  11.5 ------	UNKNOWN
250.1844 -53.7774    1.8  16.4 -102.9   3.2508   6.4 ------	UNKNOWN
247.8439 -48.8228    1.7  18.7  -87.5   3.7117   6.7 ------	UNKNOWN
Plot creation:
Sun May 31 12:03:37 EDT 2015